Articles
Tutorials
Interactive Guides
How to integrate Dynatrace and Jira for greater observability

Rob Jahn
Technical Partner Manager and DevOps Evangelist at Dynatrace
This tutorial details how to automatically generate new Jira Issues for problems that are auto-detected in your Dynatrace monitored environments. You will learn how to enable Jira automation to create a bi-directional integration for problem management.
Why should you integrate your observability platform with Jira?
The easy, out-of-the-box integration of Dynatrace and Jira cuts down manual work by completely automating the reporting of Dynatrace-detected problems in your monitored environment. It then sends reports directly to your organization's Jira project.
Time
15-minute read. Complete over 2-3 hours.
Audience
You're familiar with how scrum and/or kanban works in Jira.
You have administrator projects permission for all projects on your scrum or kanban board. See Managing project permissions for more information.
You have administration permission for your Dynatrace environment. See Get started with Dynatrace for more information.
You have a basic knowledge of Linux commands.
Prerequisites
You have a Jira account and basic proficiency in Jira. Get started with Jira here
You have a Dynatrace environment - Get a 15-day trial of Dynatrace.
A Linux host is required to run a Dynatrace provided sample application. Follow the installation instructions found in this README for requirements and instructions to install on a virtual machine.
This same Linux host needs to have the Dynatrace OneAgent installed.
Want to learn more?
For more detailed information on working with sprints in Jira, check out the sprints tutorial.
Have questions? Ask the Atlassian Community.
Overview
This tutorial depends on several components that interact with each other. In this tutorial, you will:
1. Configure Jira Automaton to create a Dynatrace problem card comment with the URL back to the Jira issue.
2. Configure Dynatrace to push problems to Jira.
3. Trigger a problem in the sample application and review how Dynatrace detects the problem and automatically creates a Jira issue.
4. Configure Jira issues queries within the Dynatrace Release page.
5. Clean up your environment.
This diagram shows the components for this tutorial and the basic interaction between them.
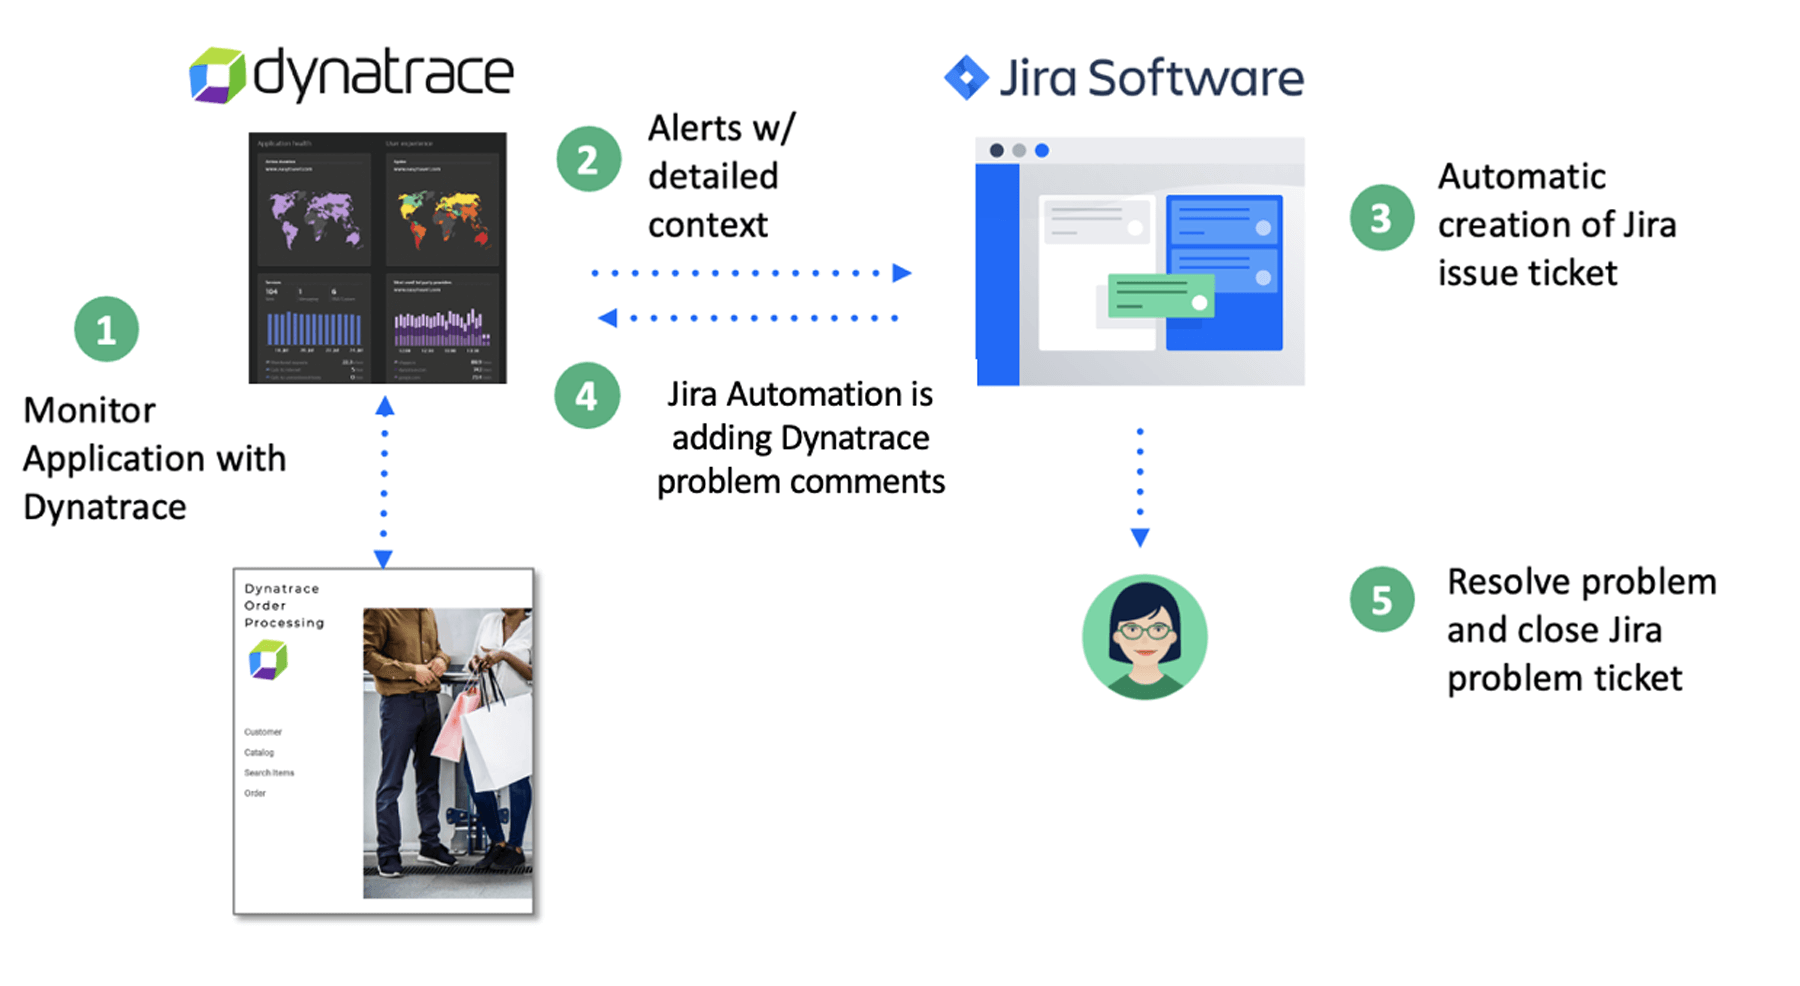
1. Monitor application with Dynatrace – For this tutorial, Dynatrace will collect metrics from a Dynatrace agent installed on the host that runs the sample application. All the data is centralized into the central Dynatrace tenant, which also provides the web interface for administration and AI-powered problem detection.
2. Problem notification with detailed context – Dynatrace’s AI Engine, Davis, uses high-fidelity metrics, traces, logs, and real user data mapped to a unified entity model. It uses Davis’ deterministic AI to reveal the precise root causes of problems. Davis not only locates the precise root cause, but it delivers valuable context instantly. You'll know whether a problem is the result of a resource bottleneck or deployment change, and even who's behind it. You can replay problems to fully understand why they happened and how to fix them.
3. Automatic creation of a Jira issue – The Dynatrace and Jira integration automatically issues for all new problems auto-detected in your Dynatrace environments.
4. Jira automation updates Dynatrace – Automation in Jira is a “no-code” feature that allows for easy build rules in a few clicks. A web request to the Dynatrace API uses the Dynatrace problem ID to update the Dynatrace problem card comments.
5. Resolve problem and close Jira issue
Setup
To complete this tutorial, several setup steps are required before you work through the tutorial use cases.
Step 1: Ensure the application is monitored by Dynatrace
1. The provided sample application should be viewable in a browser. The home page looks like this:

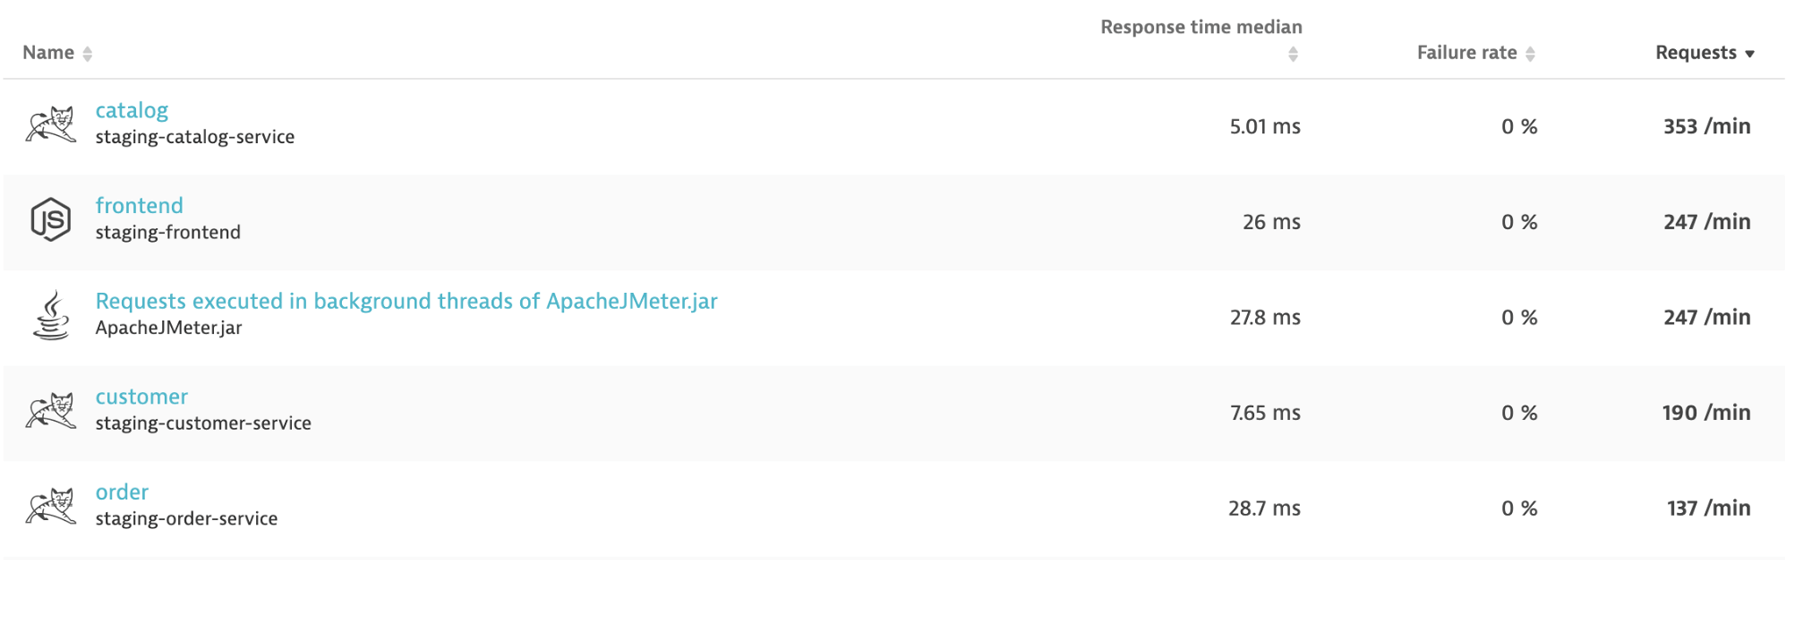
2. Within Dynatrace, use the left-side menu and click on the Transactions and services option to view the running services. You should see several running including the frontend and order service.
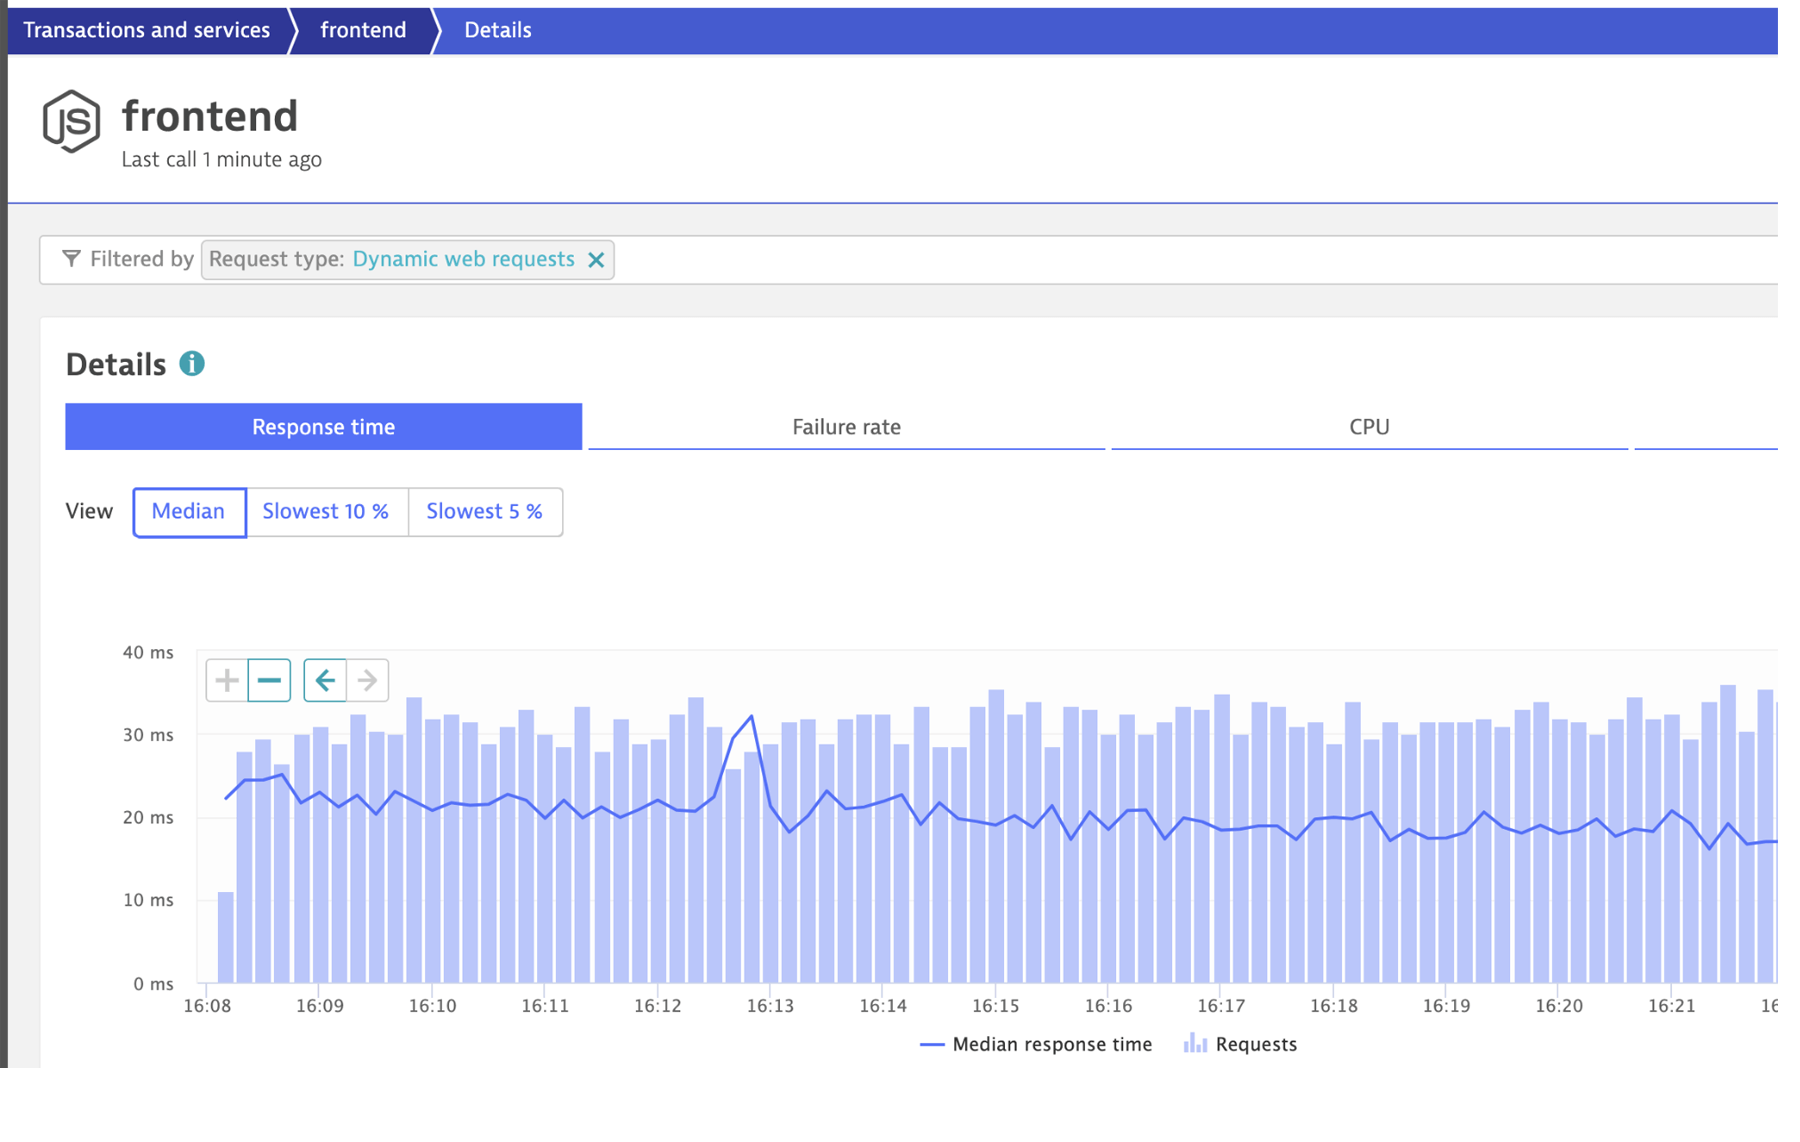
3. Click on the frontend service. On the service page, click the View dynamic requests button.
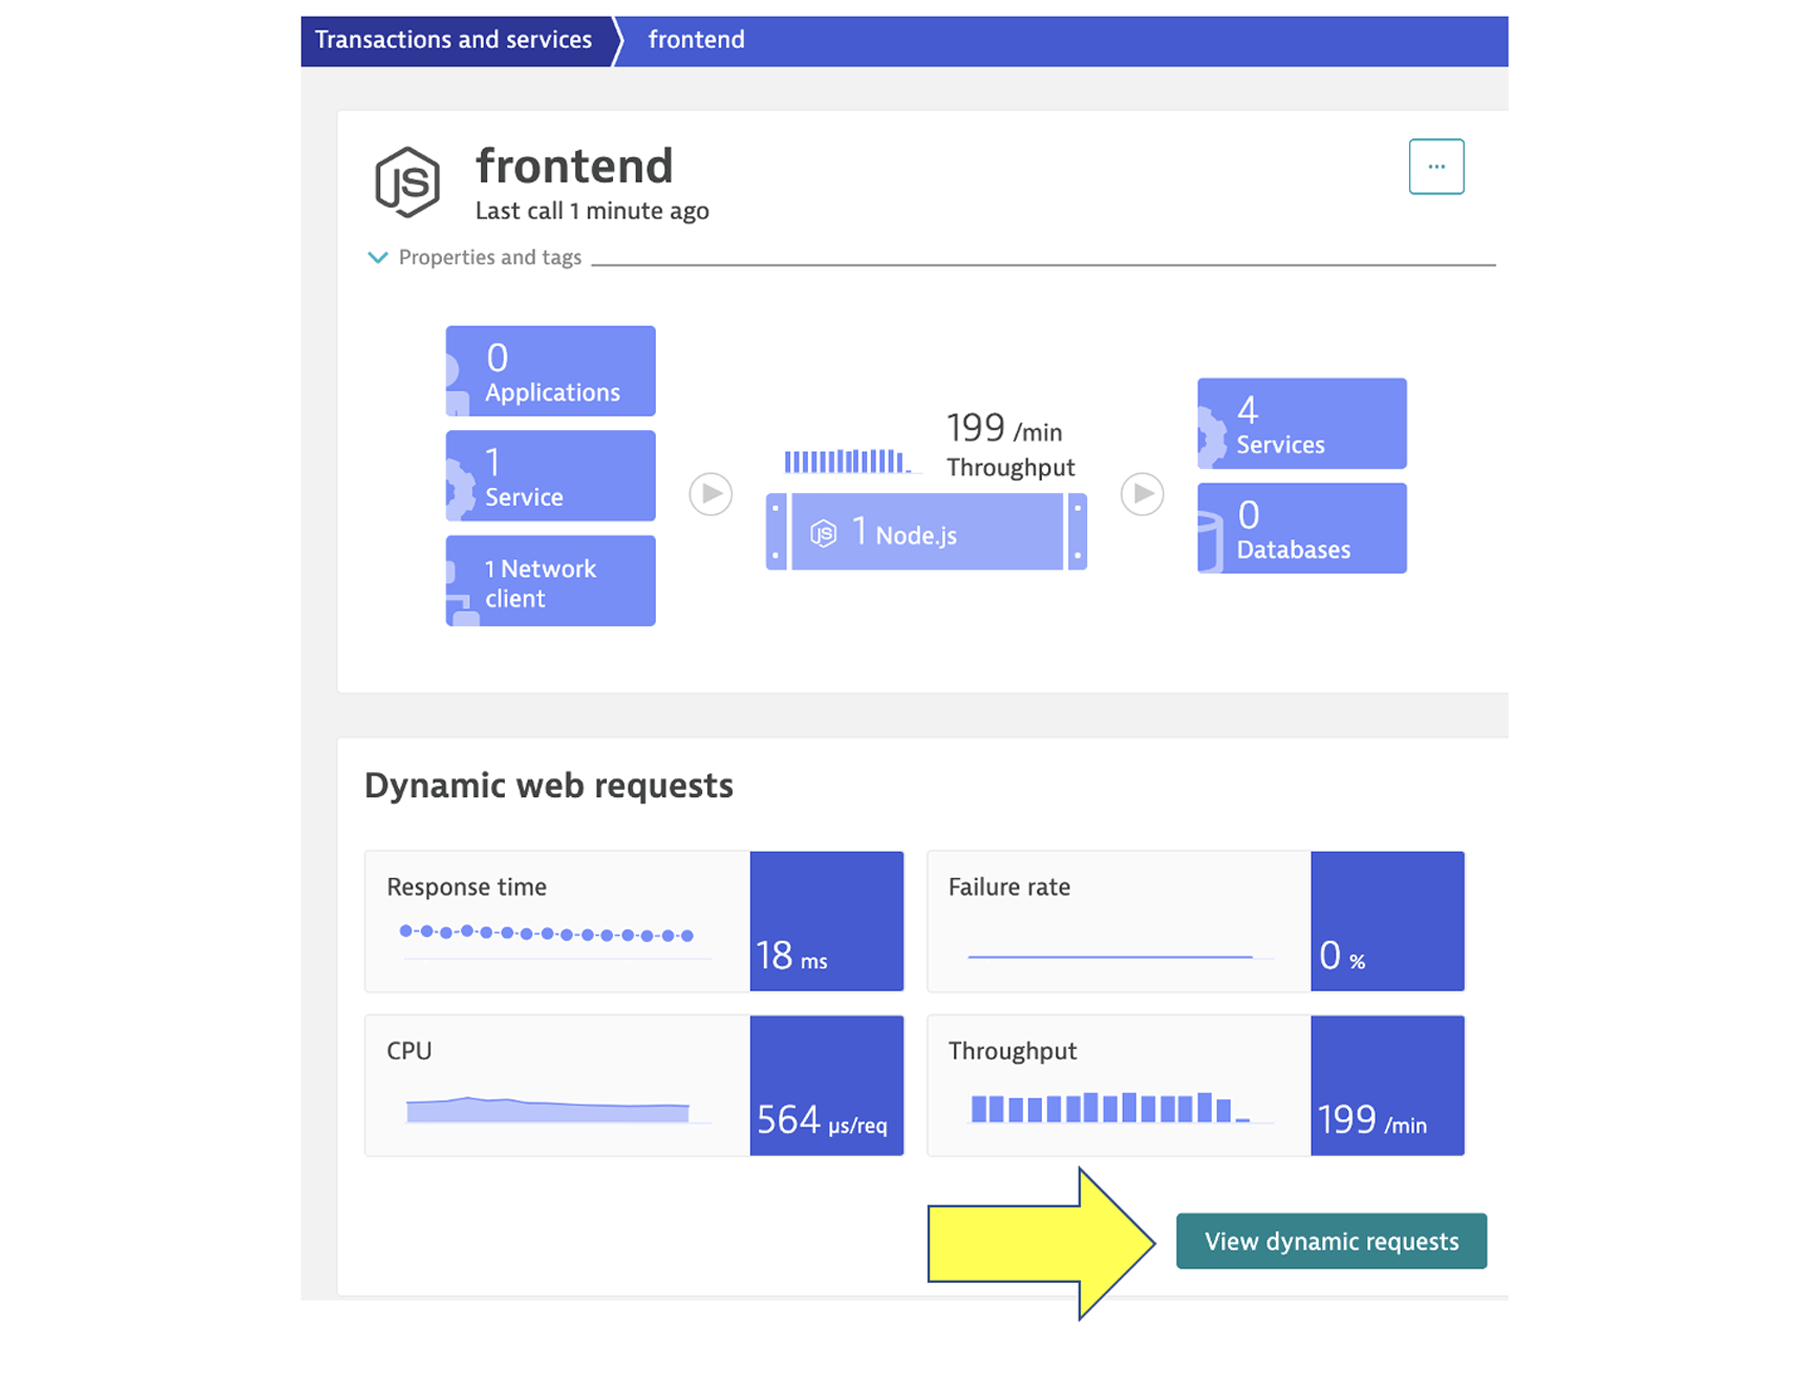
There should be requests to the service as shown below.
Step 2: Create a Dynatrace API token
You will need a valid API token to be authenticated to use the Dynatrace API. The Dynatrace API is fine-grained, which means you need the proper permissions assigned to the token. You will need this Dynatrace API token for the Jira automation rule that you will configure in Step 4.
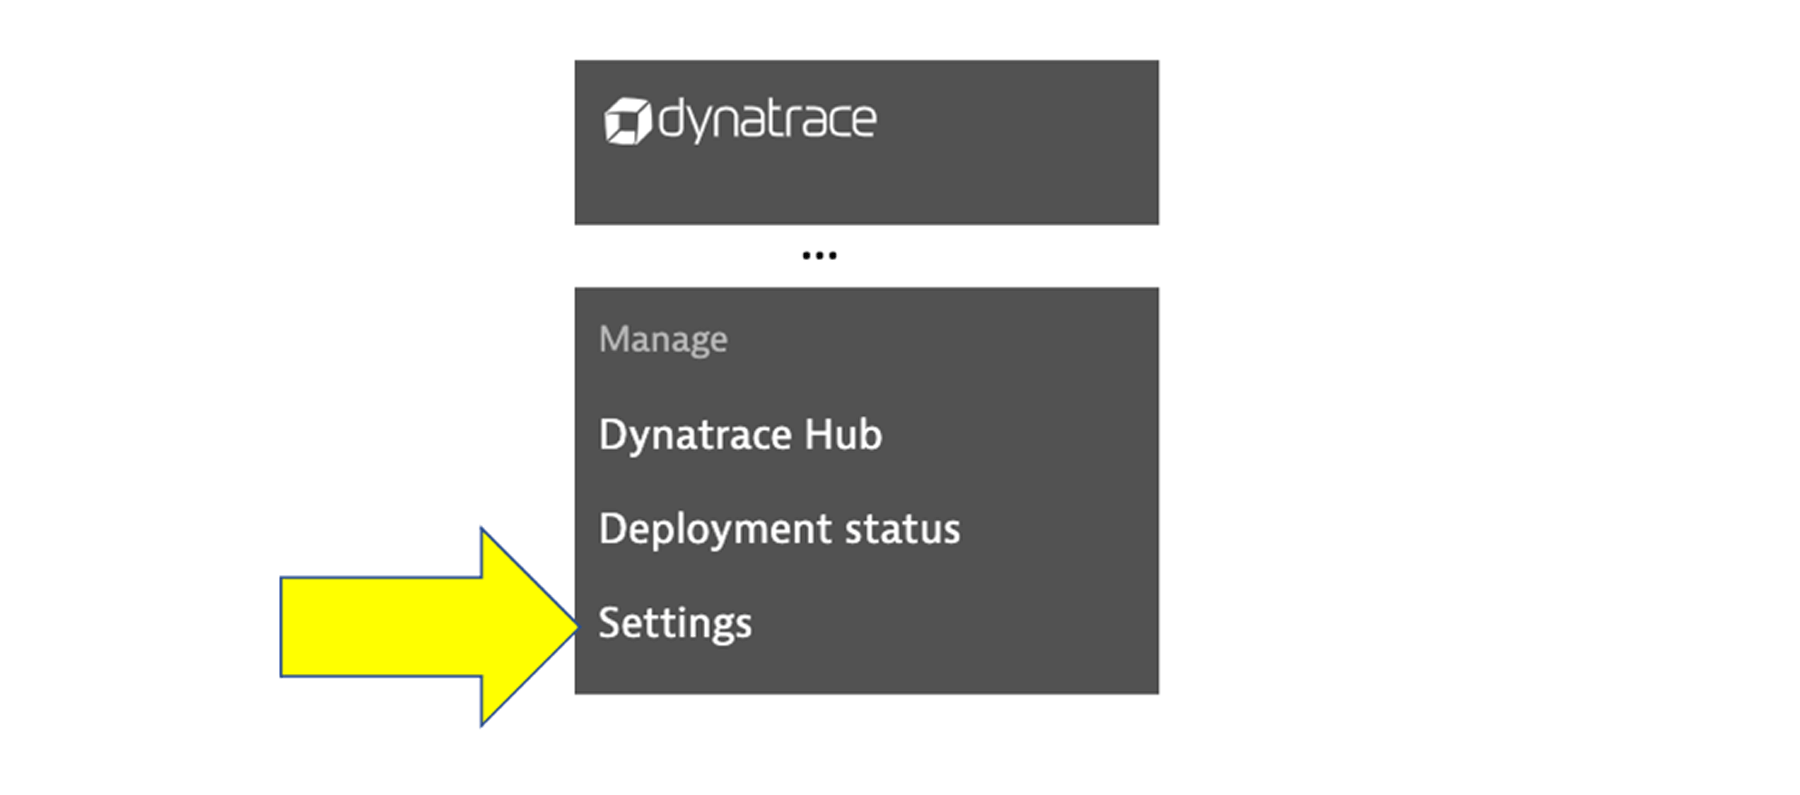
1. Within Dynatrace, on the left-side menu, click the Settings option.
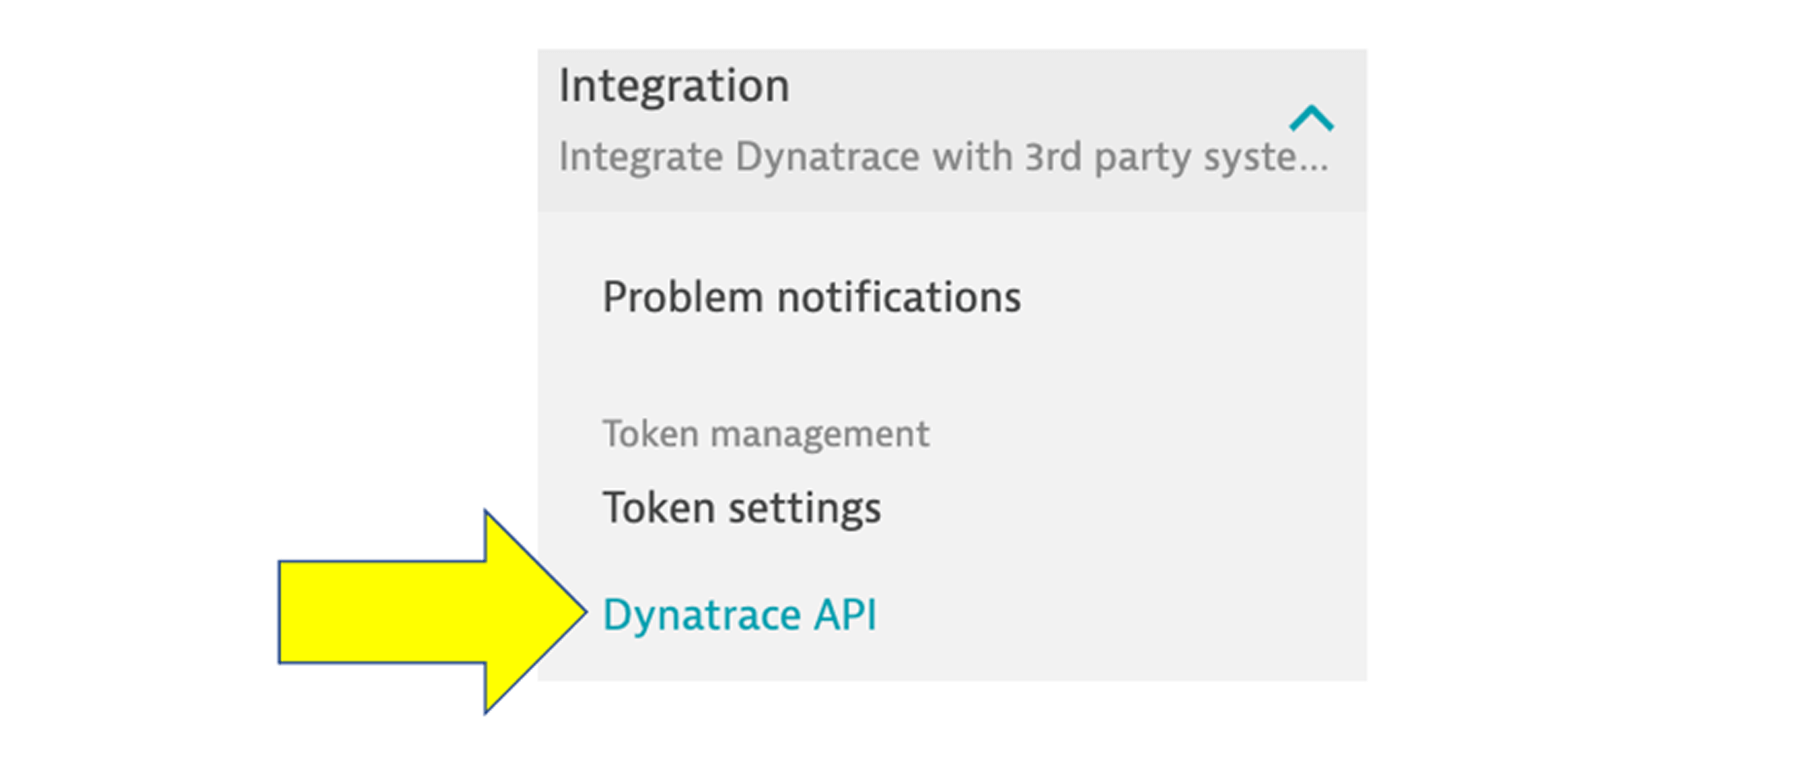
2. In the settings sub-menu, expand the Integration sub-menu and then select the Dynatrace API option.
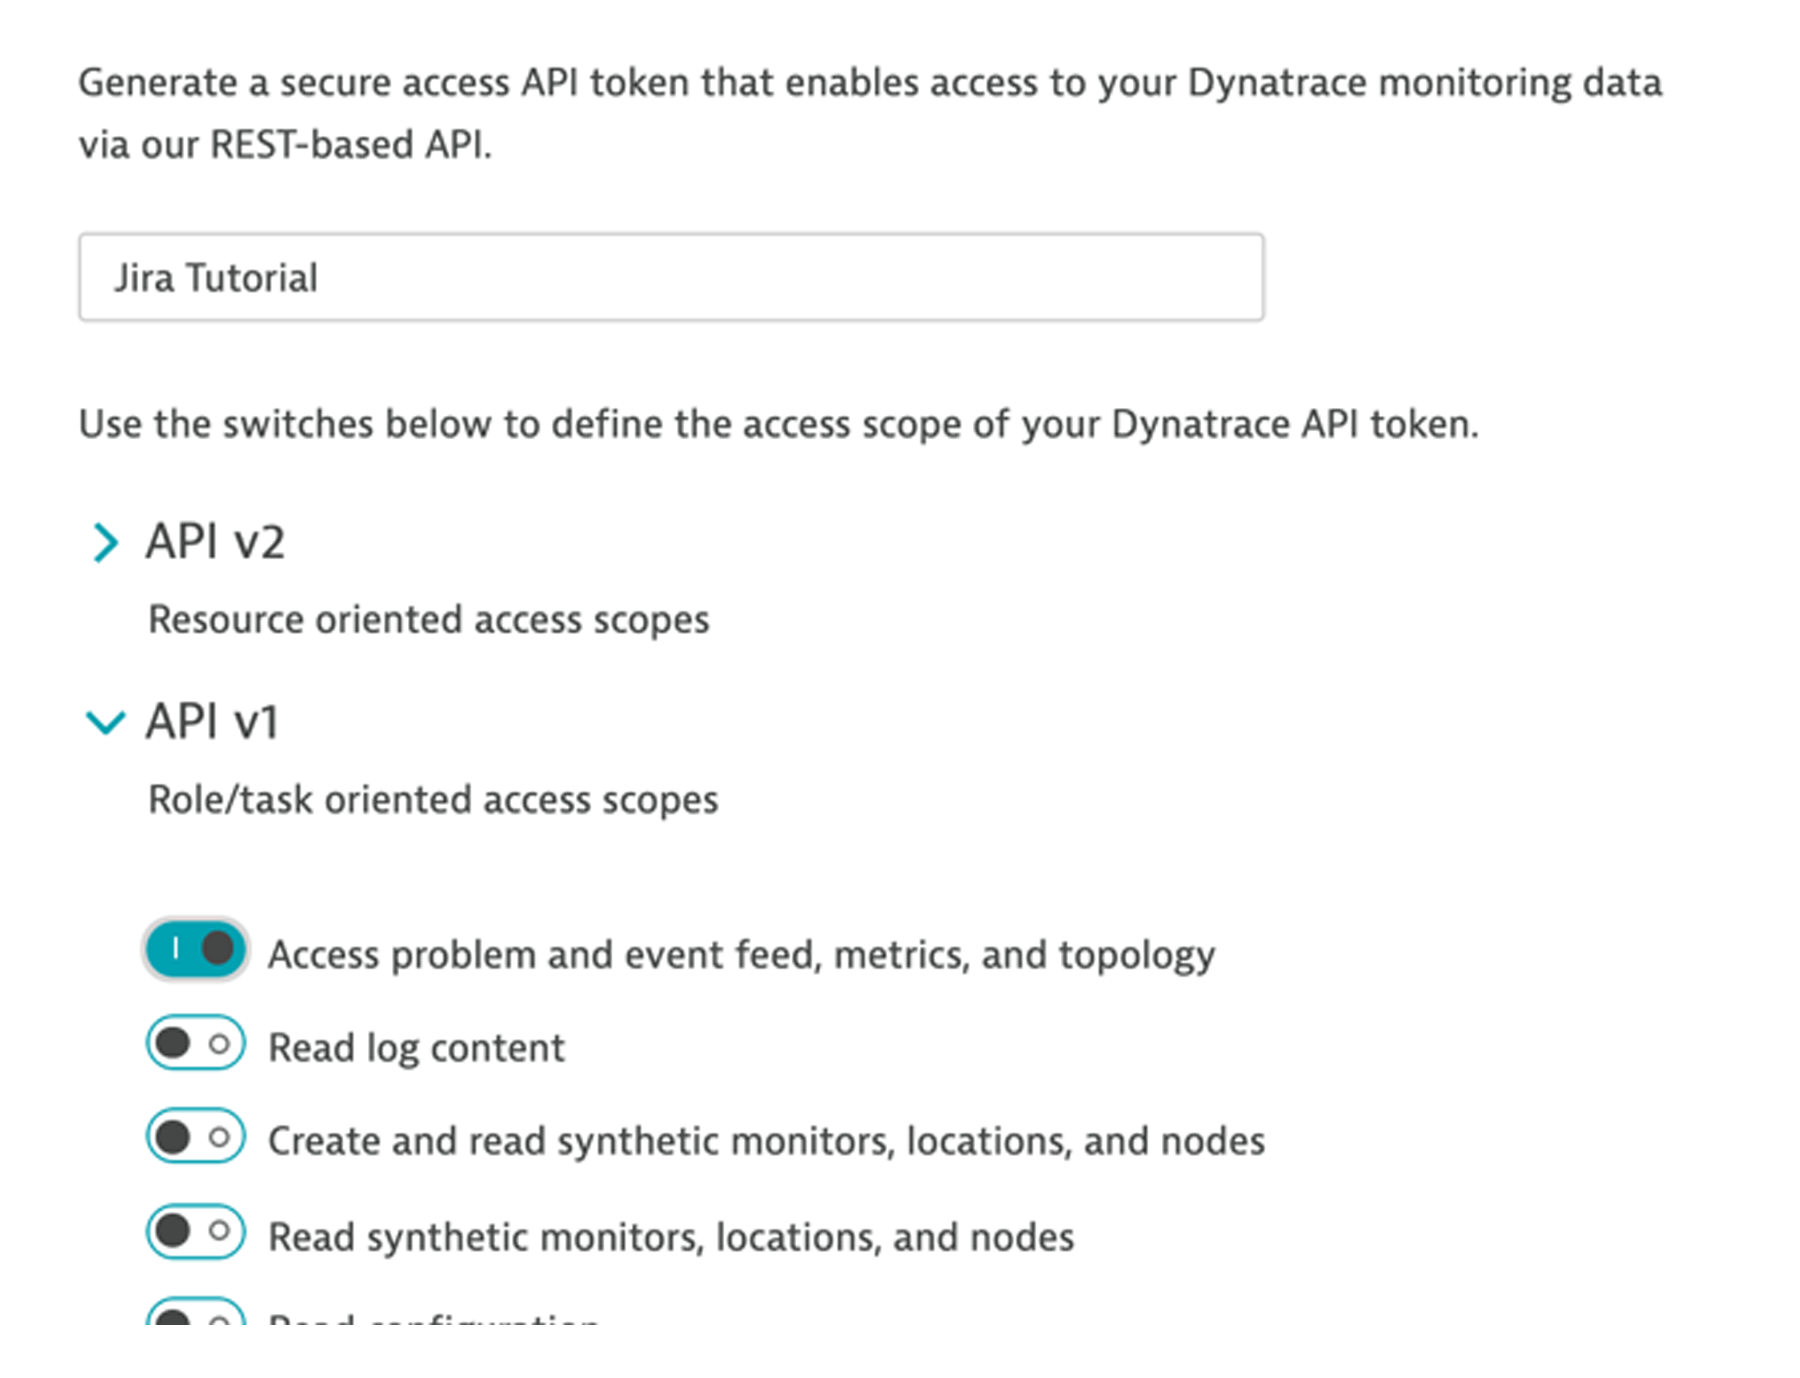
3. On the Dynatrace API page, choose the Generate Token button.
4. Provide a token name such as Jira Tutorial.
5. Expand the API v1 section and enable the Access problem feed, metrics, and topology scope. Leave all other scopes off.
6. Click the Generate button.
7. IMPORTANT: You need to save the generated token to a safe place. You will need this value later in the tutorial and you will not be able to view it again. Use the Copy button to ensure you get the full string.
8. Once the token is saved to a safe place, click the Close button.
Step 3: Create a Jira project
Having a dedicated Jira project for this tutorial allows you to delete it once you are finished. Each Jira project has a name and a project key. The Jira project key is needed for the Dynatrace Problem Notification configuration in Step 6.
1. In your Jira account, from the Projects menu, select Create Project option.
2. Enter the name “Dynatrace Tutorial”, select the Kanban template, and click the Create button.
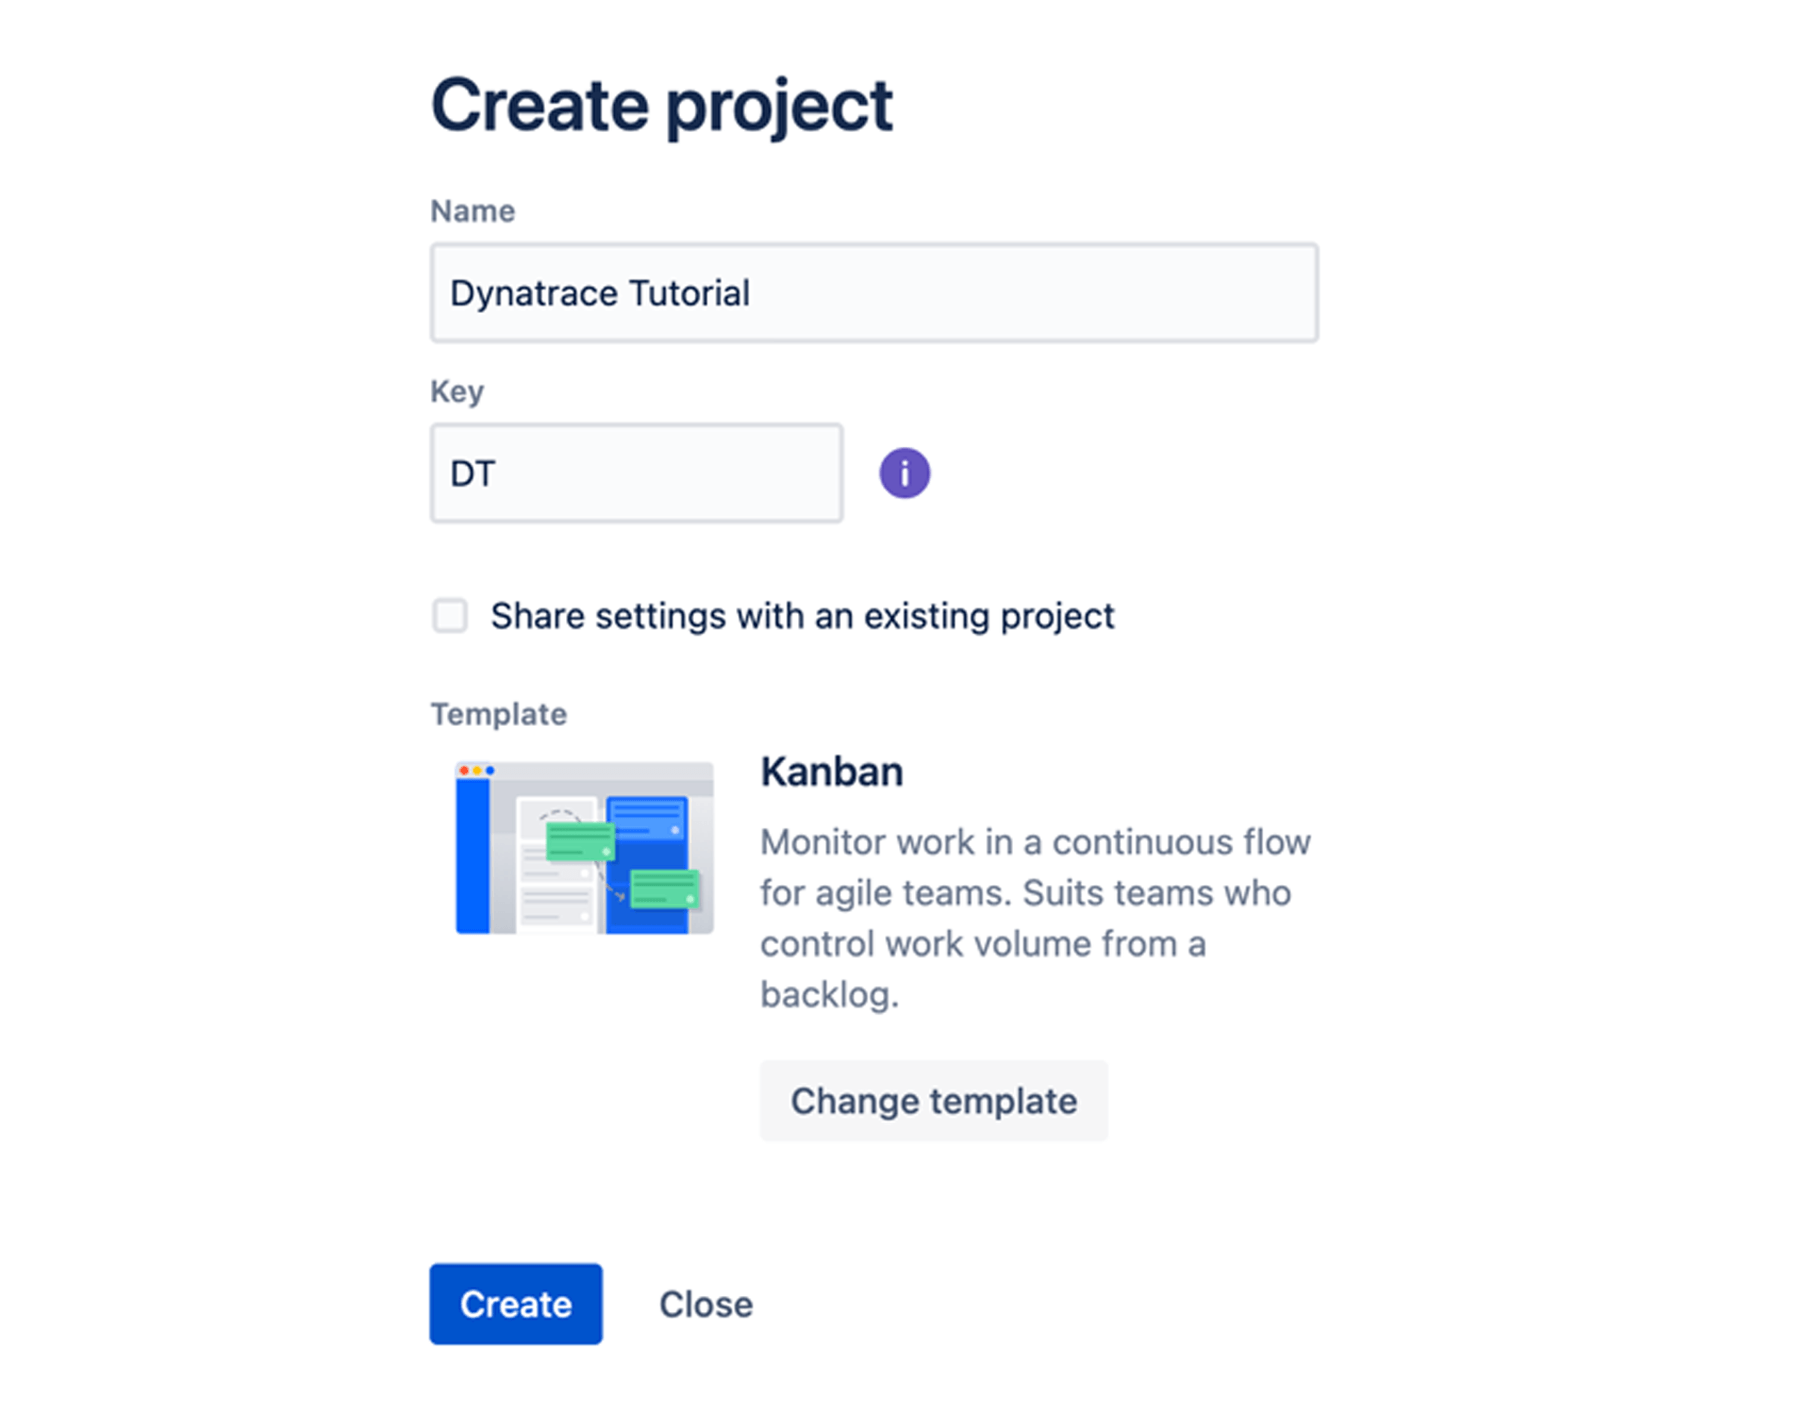
3. IMPORTANT: Remember to write down the Jira project key. You will need this value in the Dynatrace configuration. In the example above, the key is “DT”.
Step 4: Create Jira automation rule
This step sets up an automation rule that is triggered for any new Jira comment. Once triggered, the Jira automation rule directs the Dynatrace Problem API to add the text from Jira comments to the Dynatrace problem.
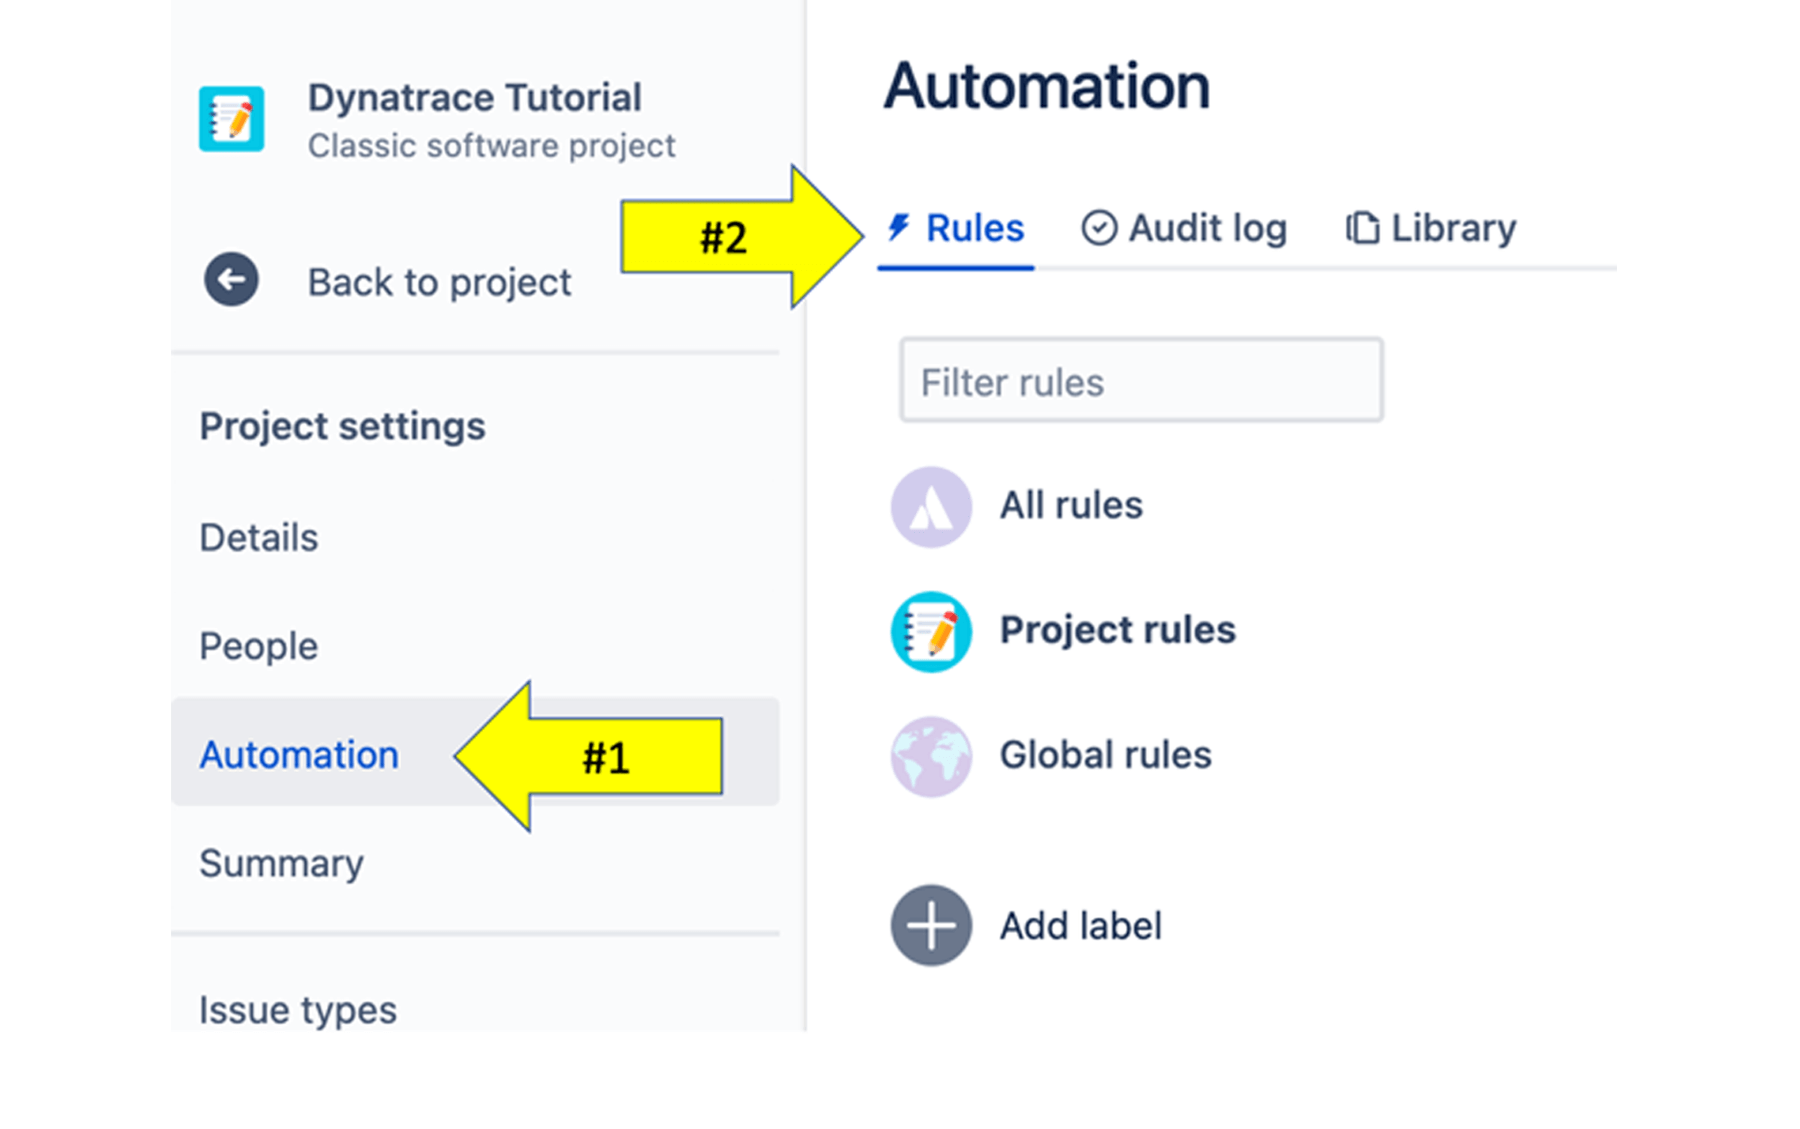
1. From the left-side project menu, choose Project settings.
2. On the left-side project settings menu, choose Automation.
3. On the Automation page click the Rules tab at the top to get into the Project rules.
4. On the top right, click the Create rule button.
5. On the New trigger page, choose the trigger named Issue commented and then Save on the next page.

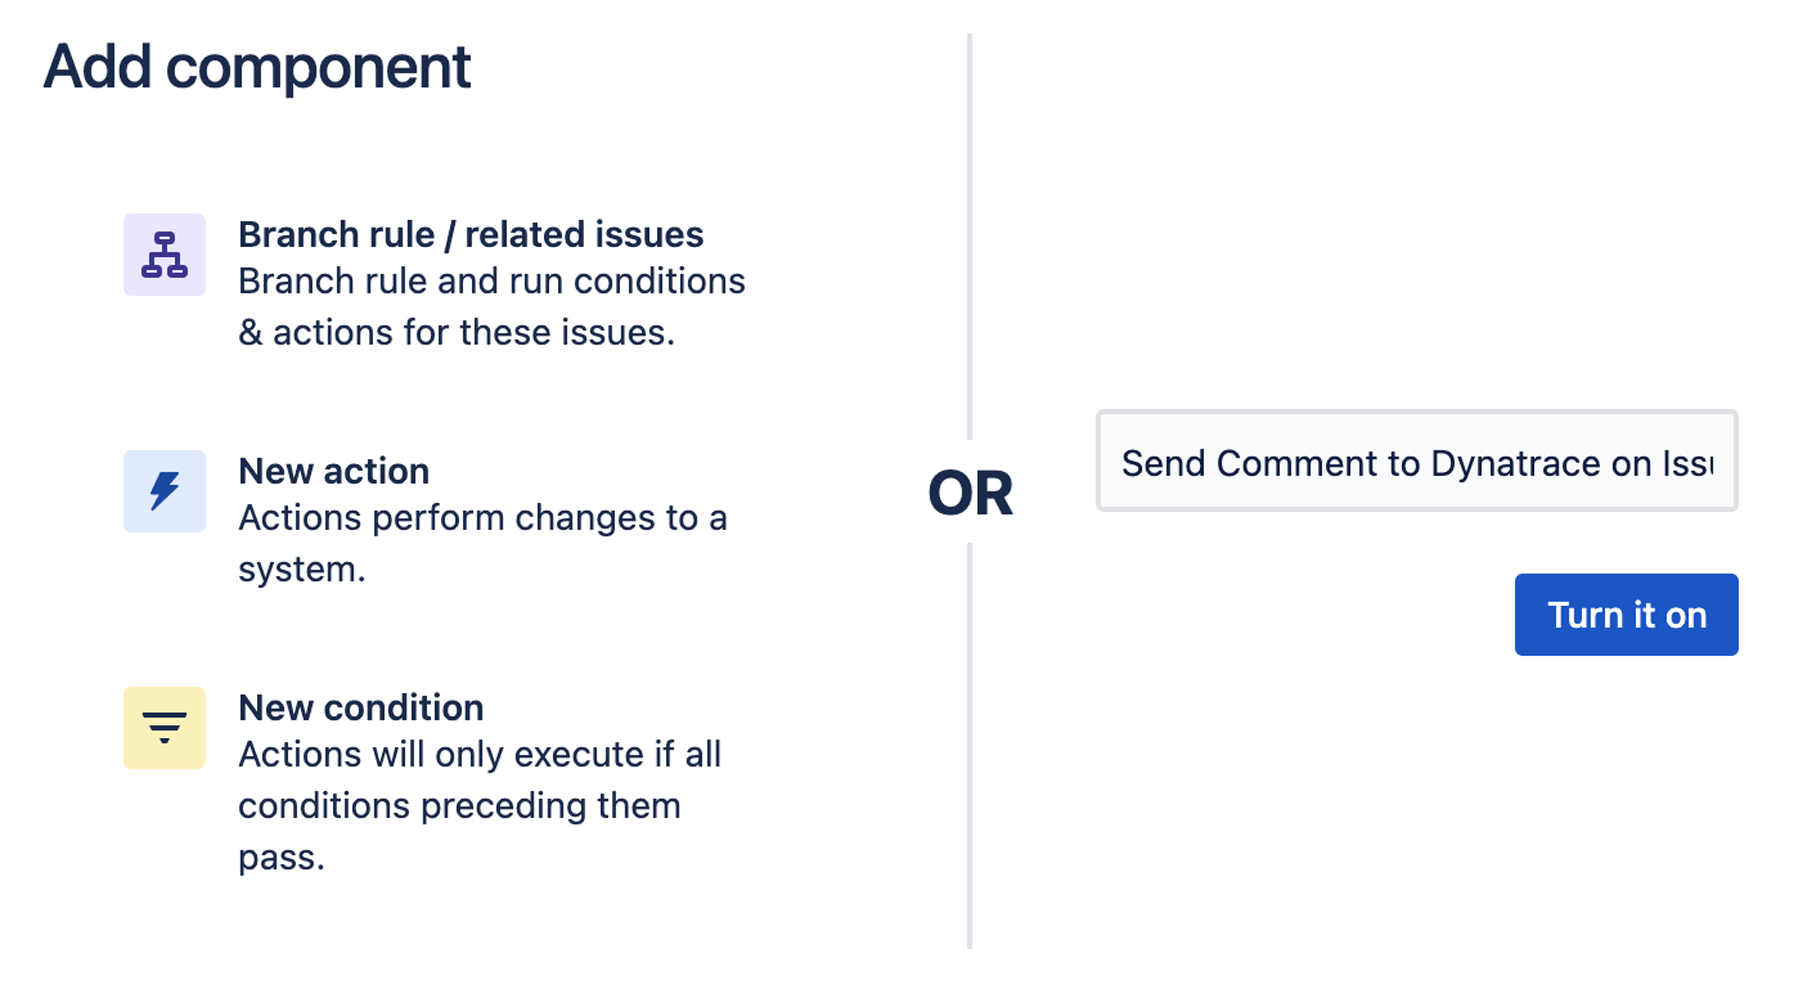
6. From the Add component page rule, click the New action option.
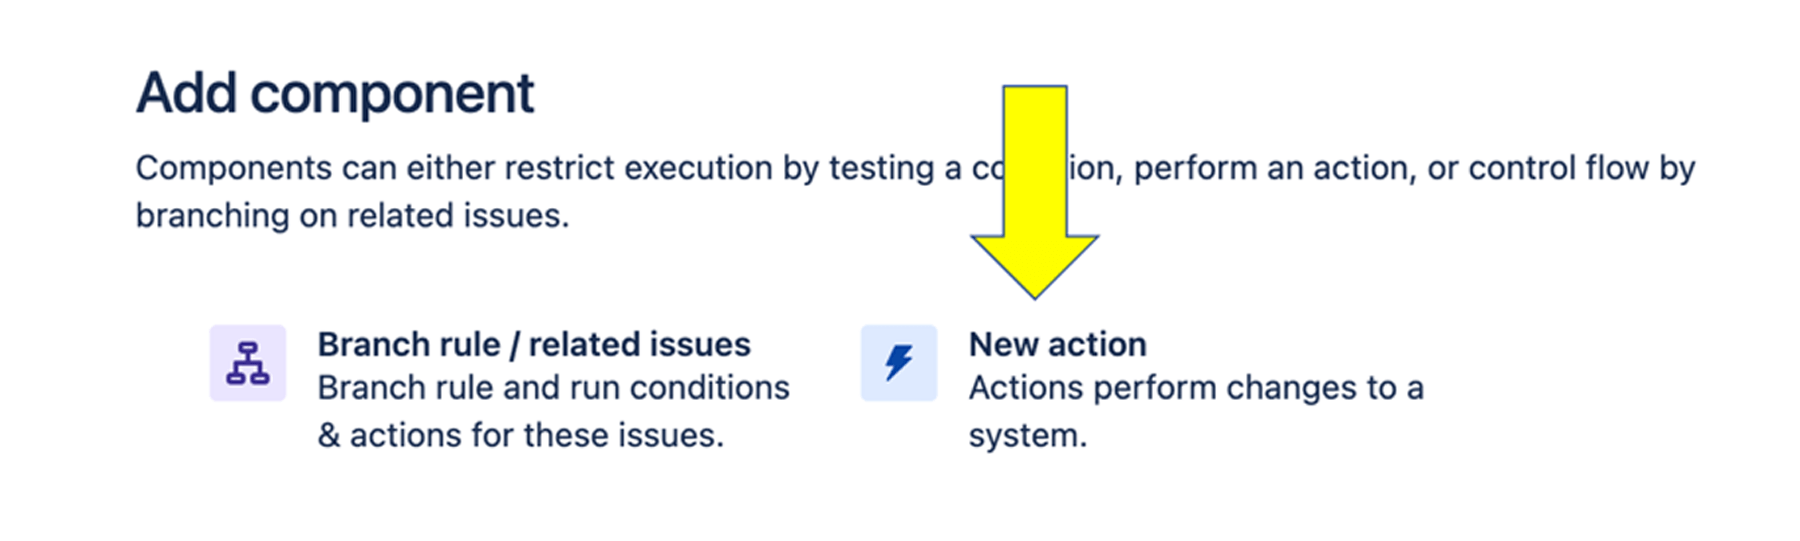
7. On the New action page, choose the Send Web Request notification option.

8. Enter the information detailed below. The following is an example of how it will look when complete:
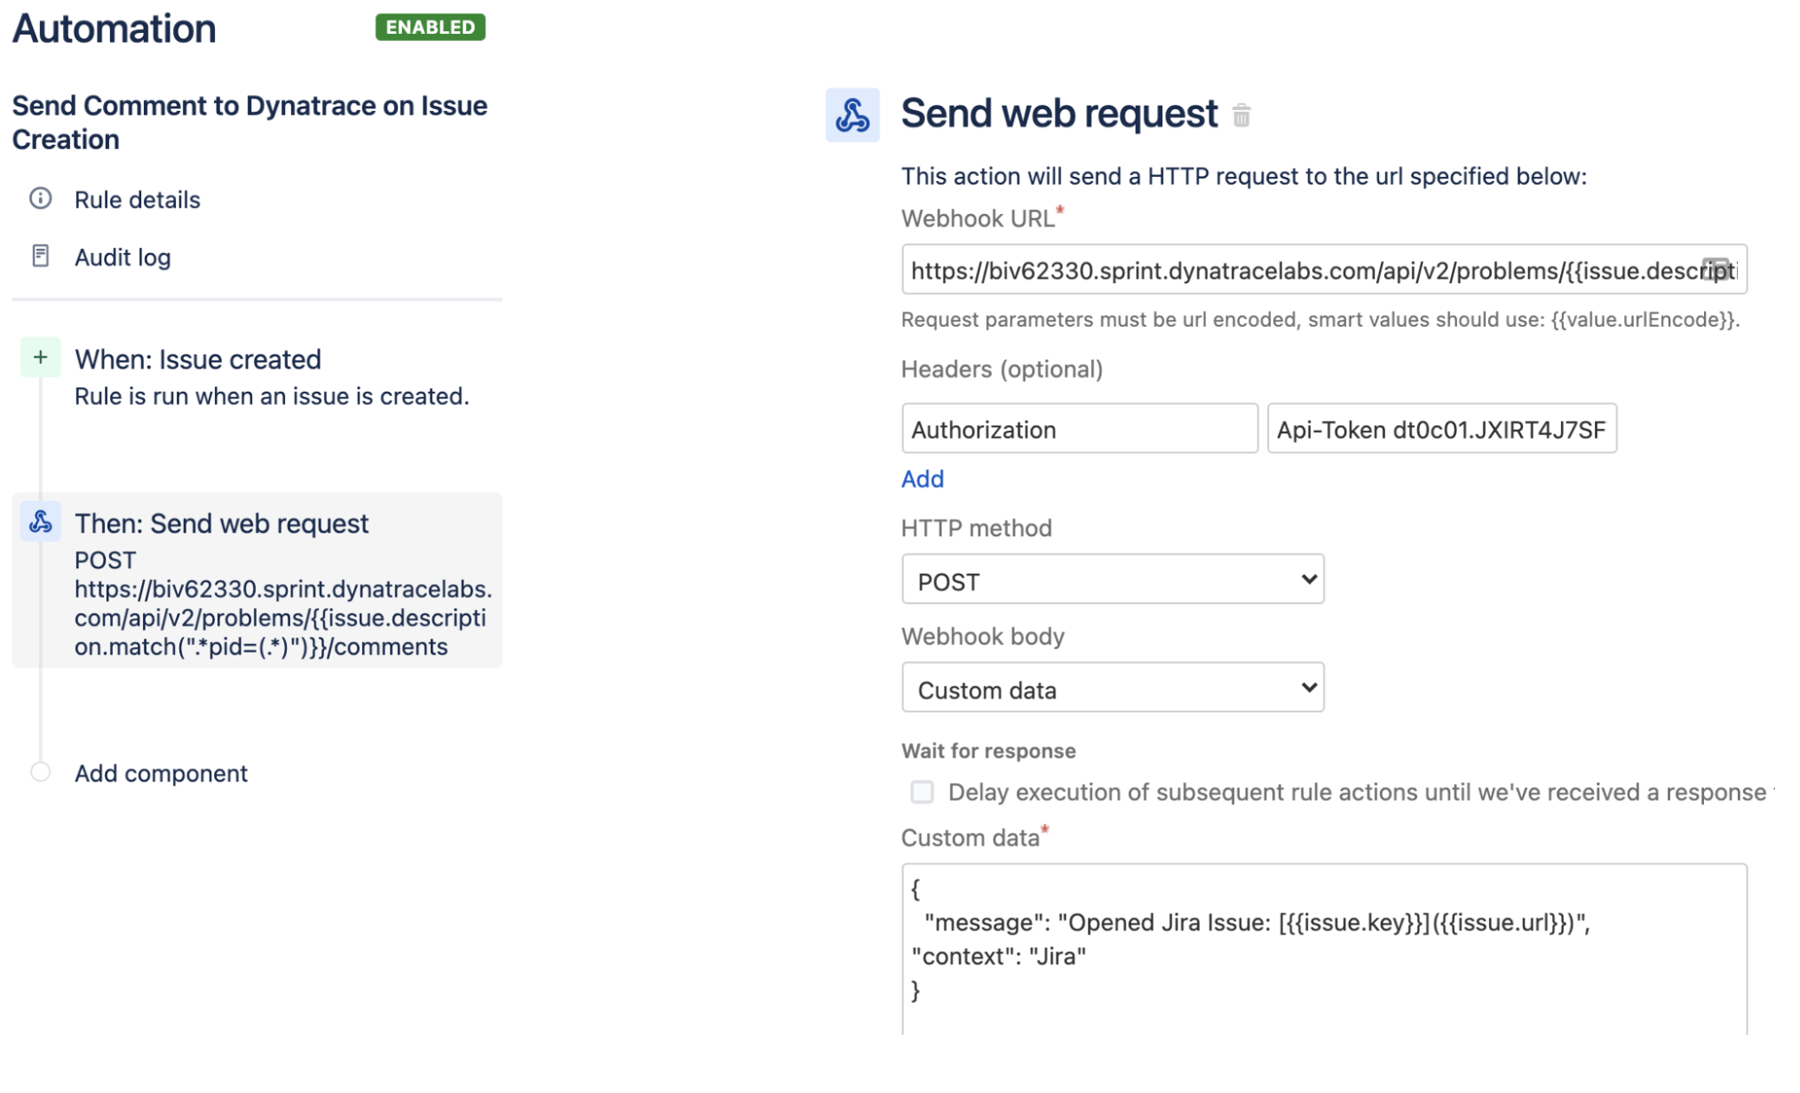
- Webhook URL – This is the URL to the Dynatrace API endpoint. You need to replace the [YOUR-ENVIRONMENT-ID] in this string with your environment. Refer to the URL from your Dynatrace environment to get this value.
https://[YOUR-ENVIRONMENT]/api/v1/problem/details/{{issue.description.match(".*pid=(.*)")}}/comments
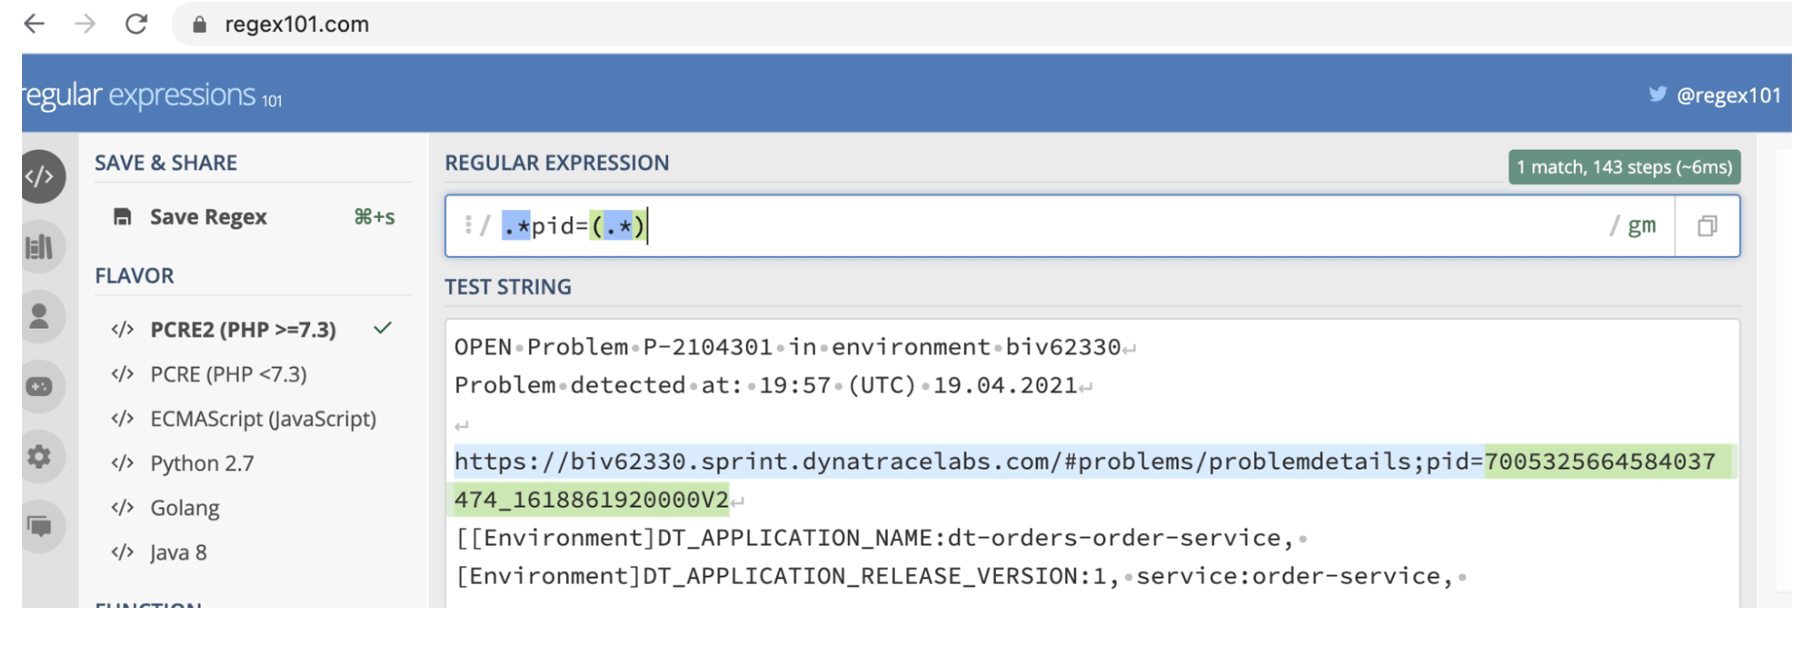
TECHNICAL NOTE: the Jira Match smart value expression will extract the Dynatrace Problem or PID from the Problem URL that is in the Issue Description. A website like regex101 can help you construct these expressions.
- Headers – This contains the Dynatrace API Token value you created earlier. For the header name, use the Authorization value. For the header value use this string and replace with the token value: Api-Token [YOUR-DYNATRACE-API-TOKEN]. NOTE: You need to include Api-Token with a space before the token string.
- HTTP Method – Choose the POST option.
-
Webhook Body – From the dropdown list, choose Custom Body and paste in the full JSON body.
{"message": "Opened Jira Issue: [{{issue.key}}]({{issue.url}})","context": "Jira"}
*** Pro Tip: Learn more about Smart Values here: https://support.atlassian.com/jira-software-cloud/docs/smart-values-general/
9. Click the Save button.
10. On the next page, enter a name such as “Send Comment to Dynatrace on Issue Creation” and click the Turn it on button.
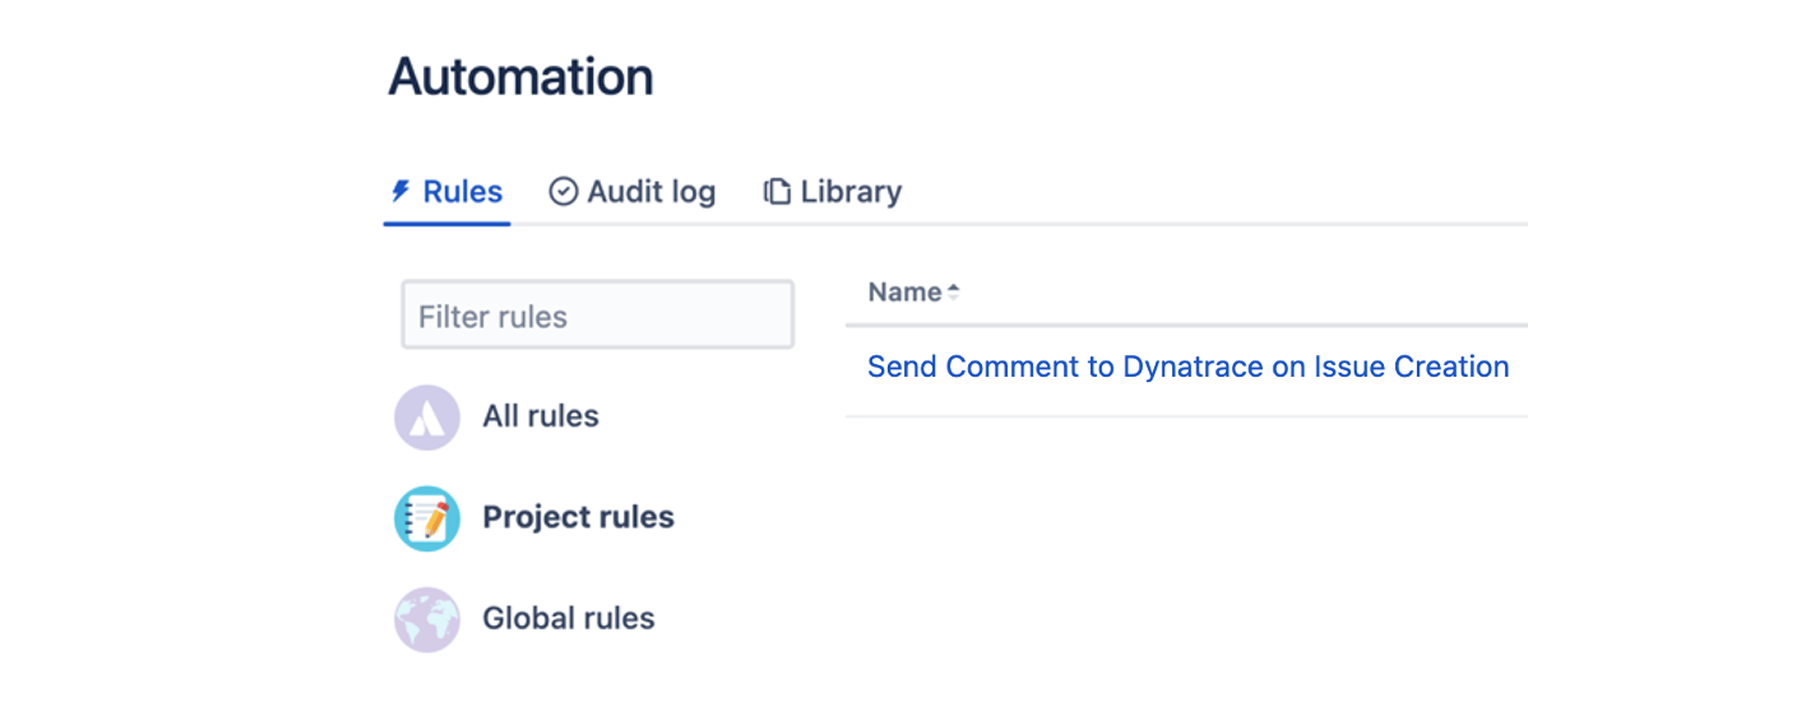
11. Once saved, on the top right, click the Return to list link and you should see the new rule enabled.
Step 5: Create a Jira API token
An Atlassian API token is used to authenticate a script or other process with an Atlassian cloud product. The token is generated from your Atlassian account. This Jira API token is needed for the Dynatrace problem notification configuration performed in Step 6.
1. Log in to https://id.atlassian.com/manage/api-tokens
2. Click “Create API token” button.
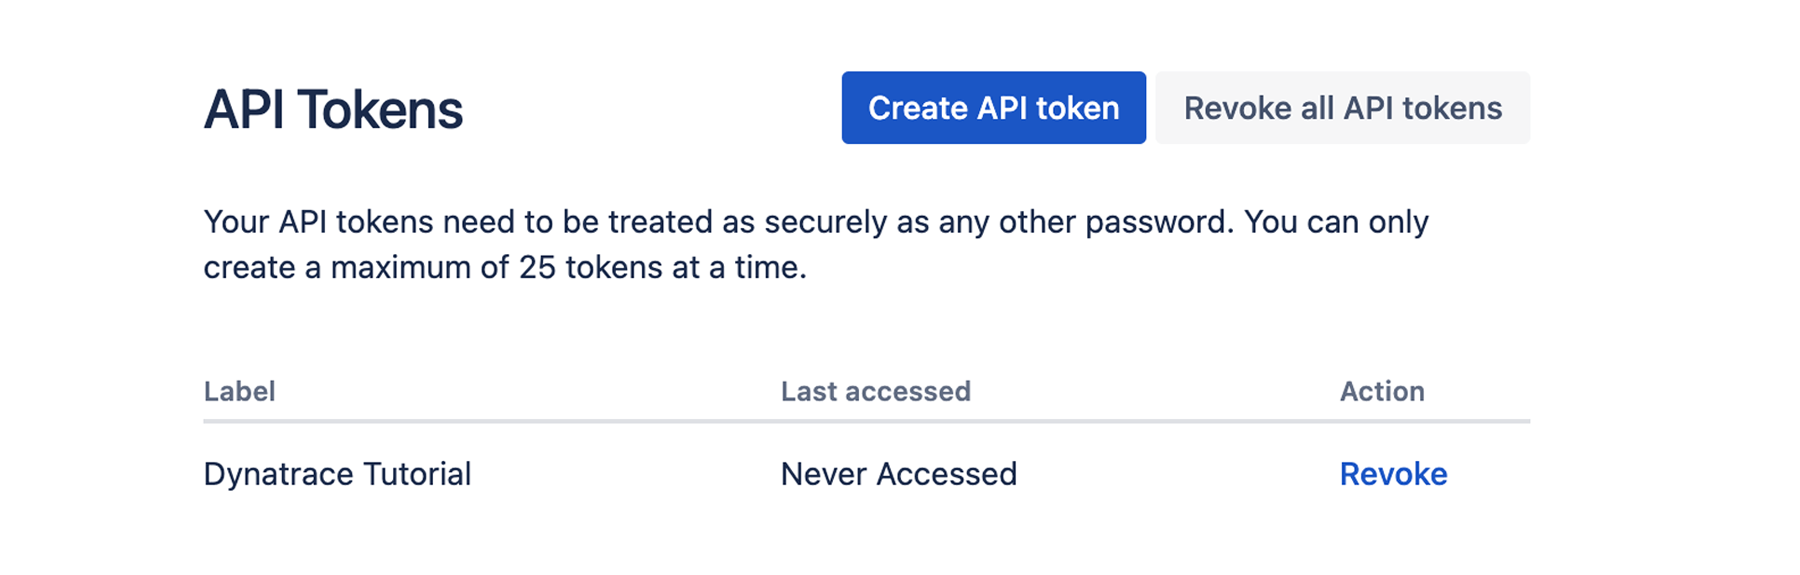
3. From the dialog that appears, enter a memorable and concise Label for your token such as “Dynatrace Tutorial” and click Create.
4. IMPORTANT: Click “Copy” button and then paste and save the API token somewhere safe since you need this value later in the tutorial. The saved API token will look like this.
Step 6: Configure the Dynatrace Problem notification rule
With the Dynatrace and Jira integration, issues are generated automatically for all new problems that are auto detected in your Dynatrace environments. Here is example for how it will look when complete:
1. Within Dynatrace, on the left-side menu, click the Settings option.
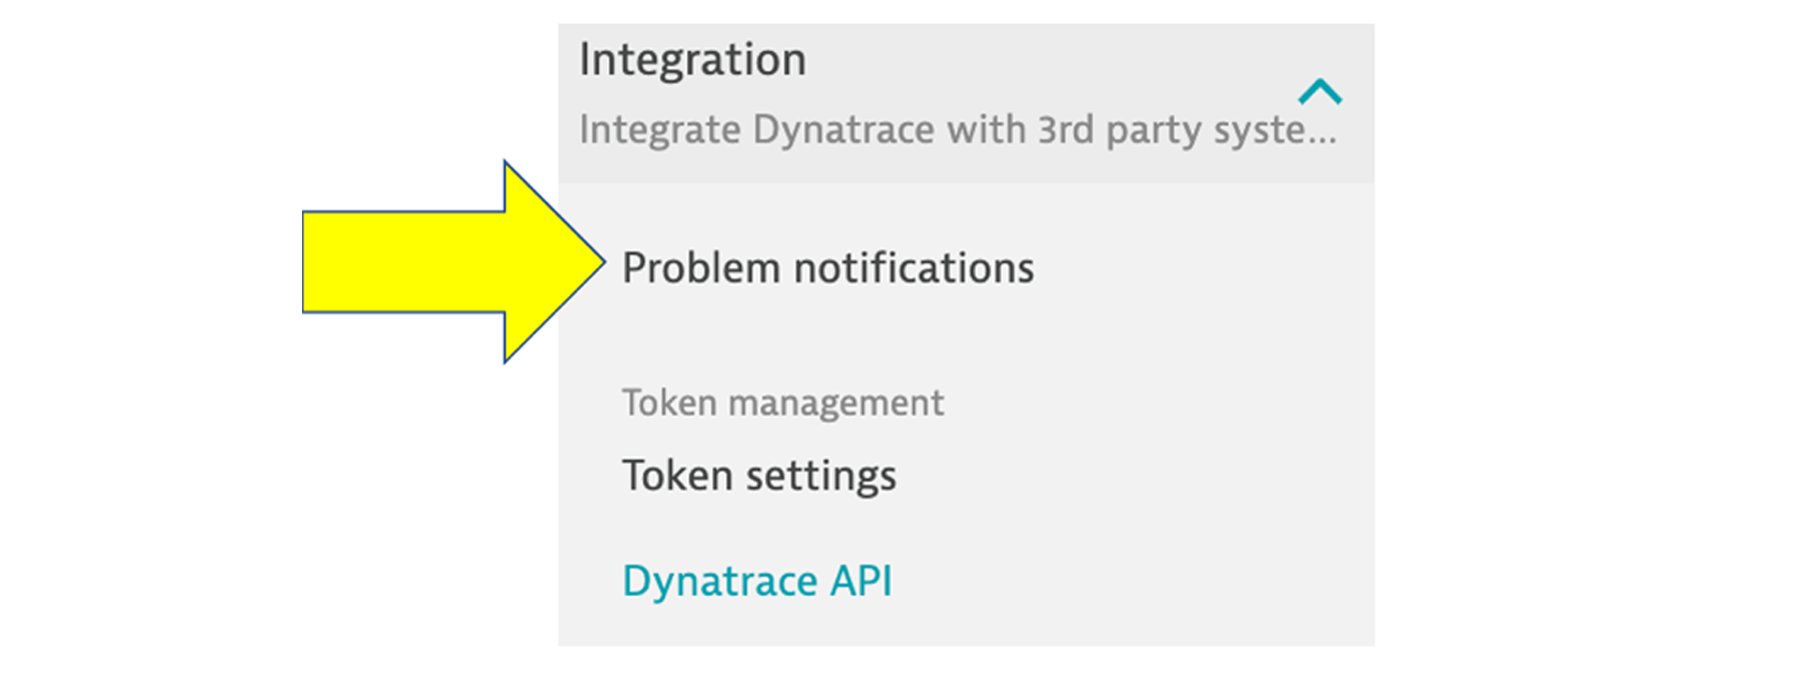
2. In the settings sub-menu, expand the Integrations sub-menu and then select the Problem notifications option.
3. Select Set up notifications.
4. Select Jira from the available notification types.
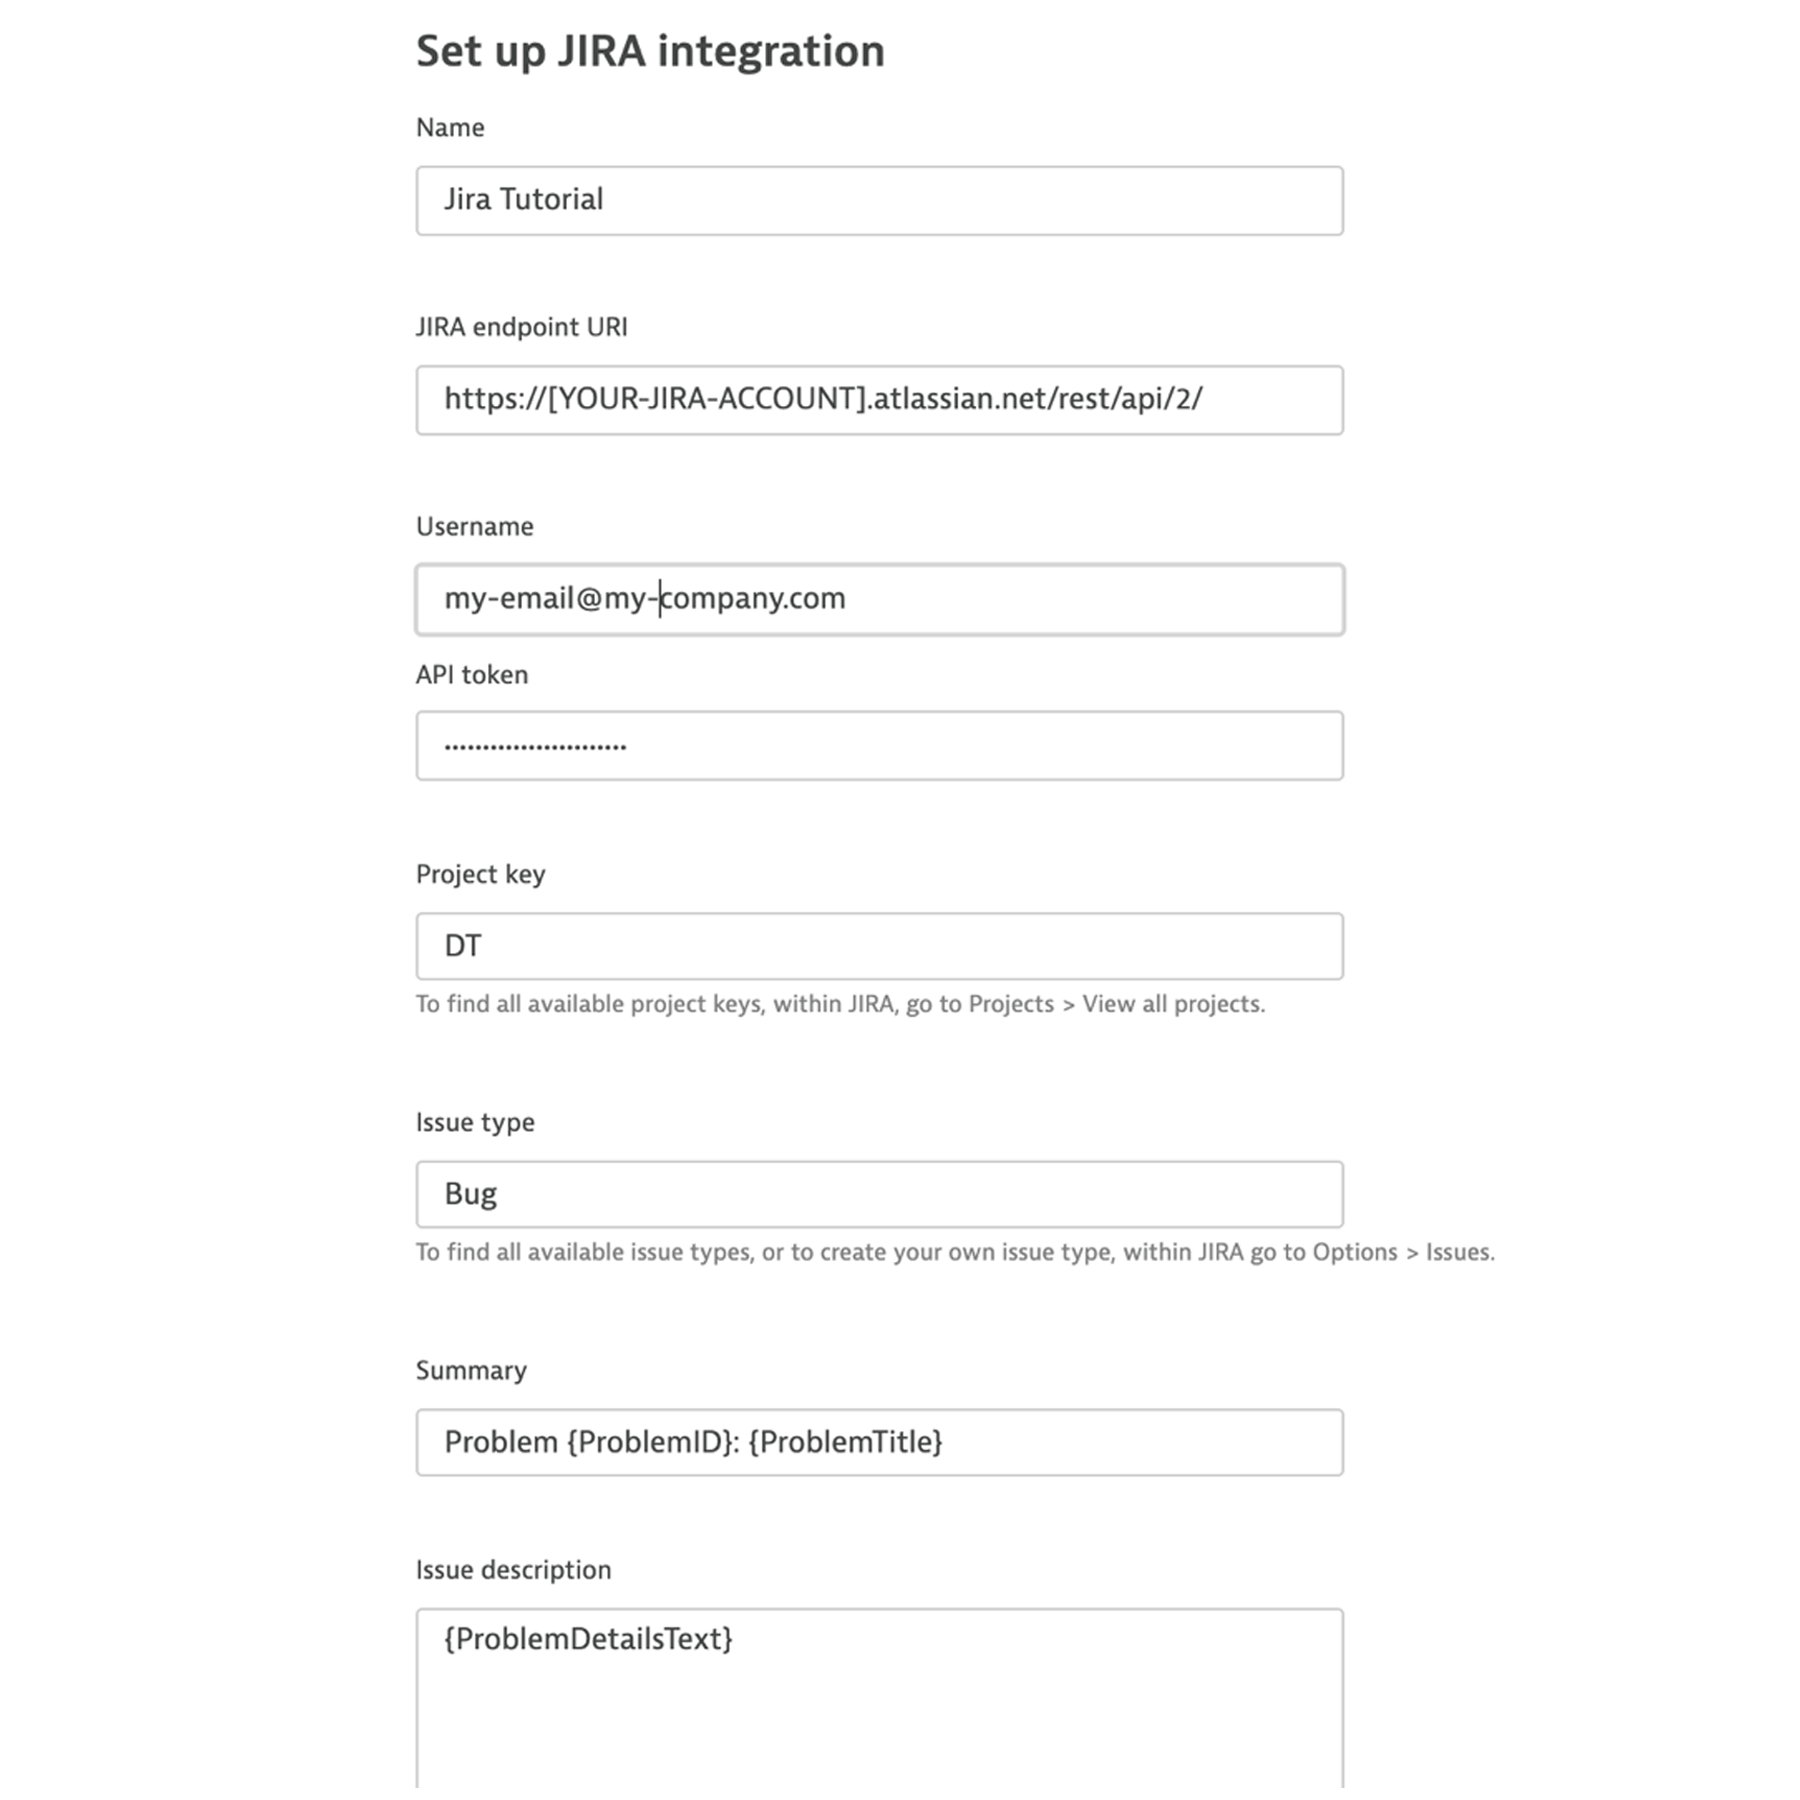
5. Configure the notification:
-
Display name – Enter a value like “Jira Tutorial”
-
Jira endpoint URI – Update this value to reflect your JIRA account
https://[YOUR-JIRA-ACCOUNT].atlassian.net/rest/api/2/ -
Username – The User ID that you used to create the Atlassian API Token
-
API token – The Atlassian API Token string
-
Project key – The Key (not the project name) of the Jira project where new issues are created and tracked. If you used the same one in the example above, it was “DT”
-
Summary – Leave as the default value
-
Issue description – Leave as the default value
*** Pro Tip -- The Available placeholders section of the configuration page lists placeholders you can use for this integration. Placeholders are automatically replaced with problem-related information.
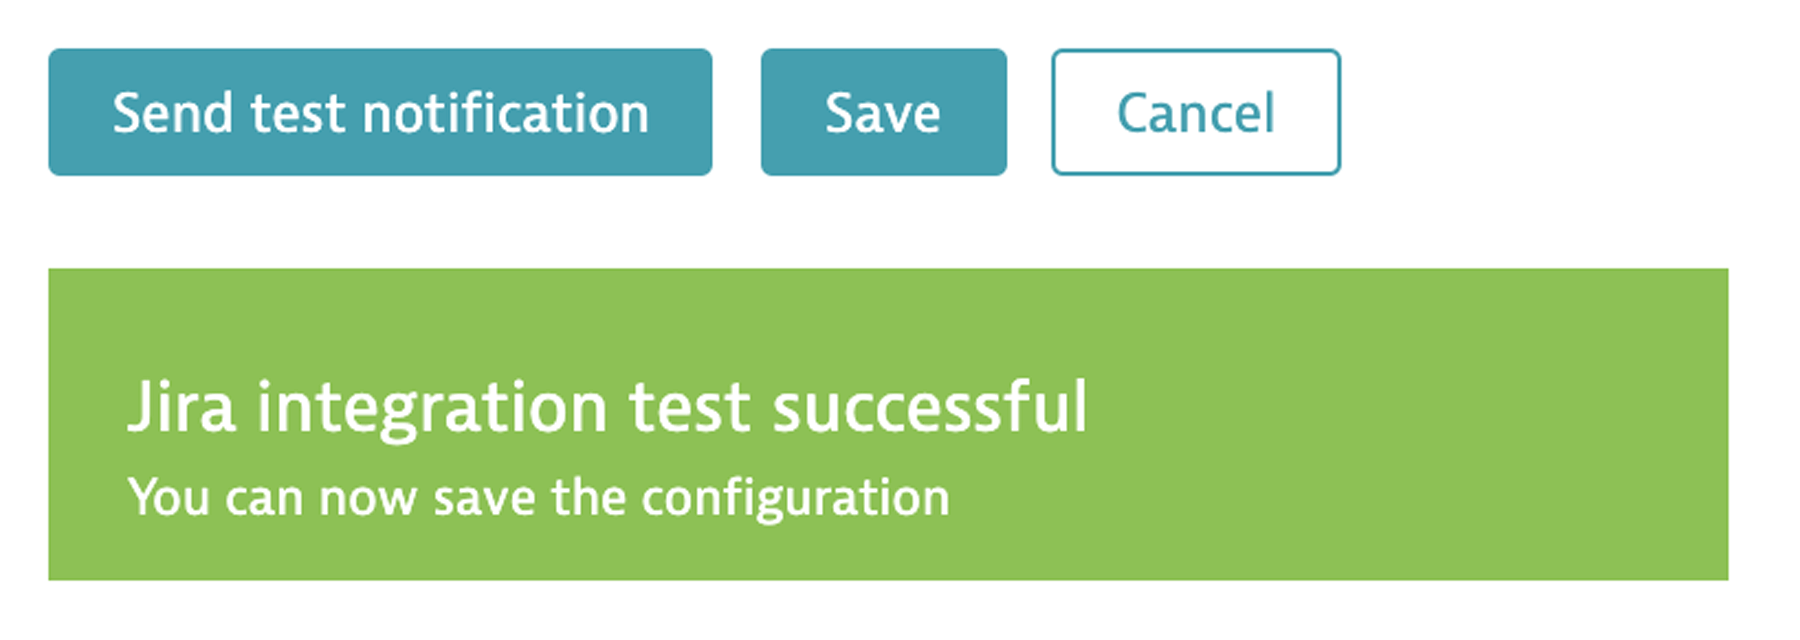
6. Select Send test notification to make sure your Jira integration is working. You want to see:
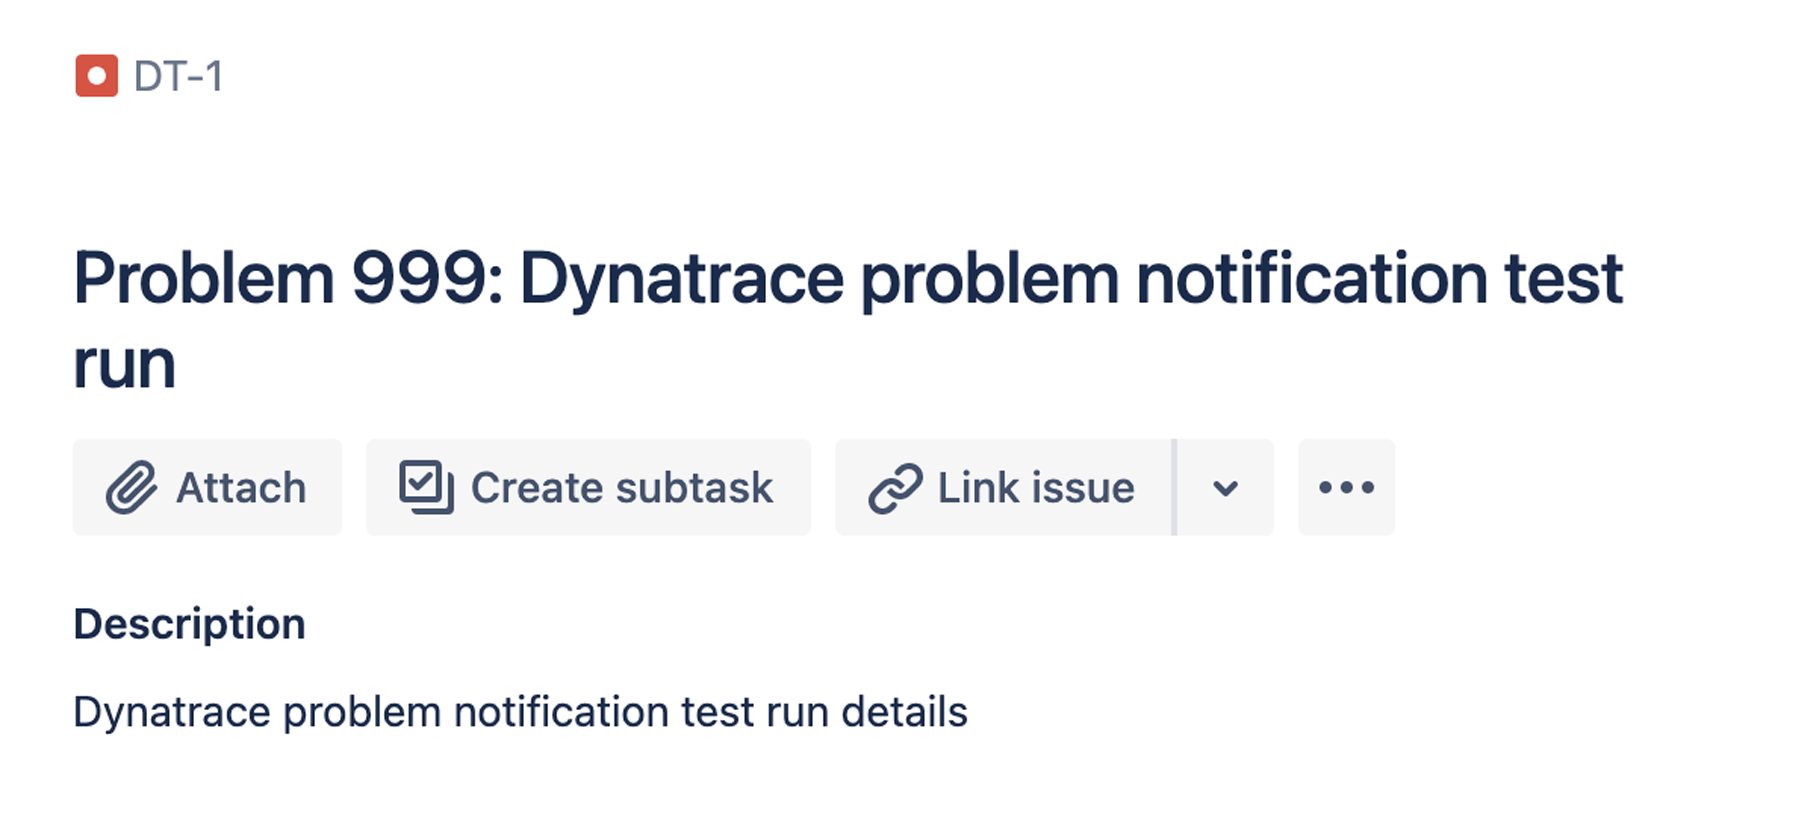
And in Jira the test Issue will look like this:
7. Click the Save button.
Learn more
Get the Dynatrace Problem Integration for Jira plugin on the Atlassian Marketplace.
Ask questions (and offer advice) on our Dynatrace Community.
Learn more about Dynatrace + Atlassian capabilities here.
Read more about Dynatrace + Atlassian (and how to work smarter, not harder) here.
See Atlassian, Dynatrace, and Keptn in action in this Dynatrace Performance Clinic.
See more integrations for Atlassian Open DevOps
Please visit our other tutorial to see how a Dynatrace detected problem can automatically create an issue in Jira Software!
Share this article
Next Topic
Recommended reading
Bookmark these resources to learn about types of DevOps teams, or for ongoing updates about DevOps at Atlassian.

DevOps community

DevOps learning path