What is IT support?
IT Metrics: 4 best practices for success
In IT, measuring and reporting is critical. But in the effort to track every statistic possible, IT teams sometimes lose focus.
With endless possibilities out there, it can be hard to know which IT metrics are best to measure IT efficiency. Today, we'll look at four practical guidelines for measuring and reporting on IT performance, and for setting the right goals from the start.
What are IT metrics?
Before jumping in, it seems prudent to first define IT metrics; understanding their purpose will help us determine which ones to track.
So what are they? IT metrics are quantifiable measurements used by IT leaders to help manage the business of IT. They help CIOs or Heads of IT understand the value of technology and demonstrate the value of IT to the rest of the business.
Common IT metrics
Given the importance of metrics in demonstrating the value of IT, choosing the right ones to track is key. There’s no single set of metrics that’s best to look at, and the right metrics for you will depend largely on your own IT team and business. Keeping that in mind, here are a few that are commonly used:
- MTTR: When we talk about MTTR, it’s easy to assume it’s a single metric with a single meaning. But the truth is it potentially represents four different measurements. The R can stand for resolve, respond, repair, or recovery, and while the four metrics do overlap, they each have their own meaning and nuance. You can read up more on MTTR metrics here. Here we’ll focus on three:
- Mean time to resolve: This metric tracks the average elapsed time from when a ticket is opened until it is closed (and the issue is resolved).
- Mean time to respond: Mean time to respond allows IT teams to track the average response time to a newly opened ticket.
- Mean time to recovery (or resolve): This is the time it takes to detect, mitigate, and resolve a problem. It’s a key DevOps metric, since it measures the stability of a DevOps team, as noted by the DevOps Research and Assessment (DORA) research program.
- Uptime: This is the amount of time (represented as a percentage) that your systems are available and functional.
- Cost Per Ticket: This metric is calculated by taking the operating cost of your service desk and dividing it by your ticket volume. It provides a sense of the service desk’s efficiency and can be associated with customer satisfaction.
- Customer Satisfaction: Measuring customer satisfaction can help you better understand your customers and improve the customer experience.
- Service Level Agreements (SLA): SLAs are plain-language agreements between you and your customer (i.e. between the IT department and the business) that may include one or more of the other metrics mentioned here. The promises made in SLAs (about uptime, mean time to resolve, etc.) are one of the reasons IT teams need to track these metrics. IT teams can keep track of the percentage of SLAs that are being met.
These metrics just represent a jumping off point and you may choose to track a small number of metrics or many of them. The important thing to remember is that every team’s tracking and reporting needs are different. Here's a deeper dive on metrics and KPIs related to incident management.
Best practices for successful IT metrics and reporting
With so many options for IT metrics, it’s hard to decide which ones to track. And once you’ve chosen, it’s important to also think about how you report those metrics to your stakeholders. We’ve outlined a few best practices below that will help guide you through both selecting your IT metrics and reporting them out.
Align IT performance goals with your business goals
When deciding which IT metrics to track, you should carefully consider the implications for the IT department and the business.
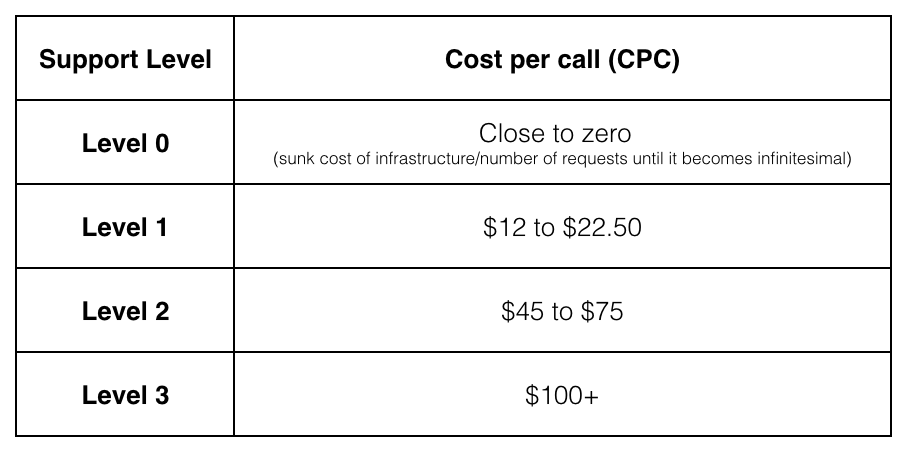
For example, mean time to resolve and percentage of open tickets are certainly helpful metrics for IT teams to track, but relying heavily on these metrics may have undesirable consequences for your team. When your first-level support team is incentivized to close tickets quickly, they may do so without satisfactorily solving the customer’s issue. Incentivizing a low-level support team to close or escalate tickets quickly can actually cost the company more, and HDI has the numbers to prove it:
To avoid this kind of trap in your own organization, look for ways to set meaningful goals and measurements that encourage behavior in line with company and organization-wide goals.
Share different metrics with different stakeholders
As we’ve already acknowledged, IT metrics are a great way to demonstrate the value of IT to the rest of the organization. But when sharing that information with others, think about your audience and what kinds of things they want to see. It’s fairly obvious, but different stakeholders care about different things: a front-line IT manager cares deeply about technical performance data, while a CTO cares much more about the bigger picture. Avoid distributing generic, tell-all reports to large audiences altogether, and instead, meet with your key stakeholders and agree on the right measurements to help them achieve their goals.
Use visuals to make reports easy to understand
Excel spreadsheets full of raw data aren’t very effective as report-outs to your team members, peers, and leadership, because they require the viewer to interpret the data.
Fortunately, adding context to the data isn’t always hard if you are already using a strong reporting dashboard. You want to provide clean, crisp, and easily understood reports that provide enough context to quickly communicate how you’re doing against your goals, your benchmarks, and your history. Jira Service Management — Atlassian's service management solution — is outfitted with default dashboards optimized for common service metric functions. However, if your reporting needs exceed the scope of the default reports, users can edit and create new reports to capture the full scope of context.
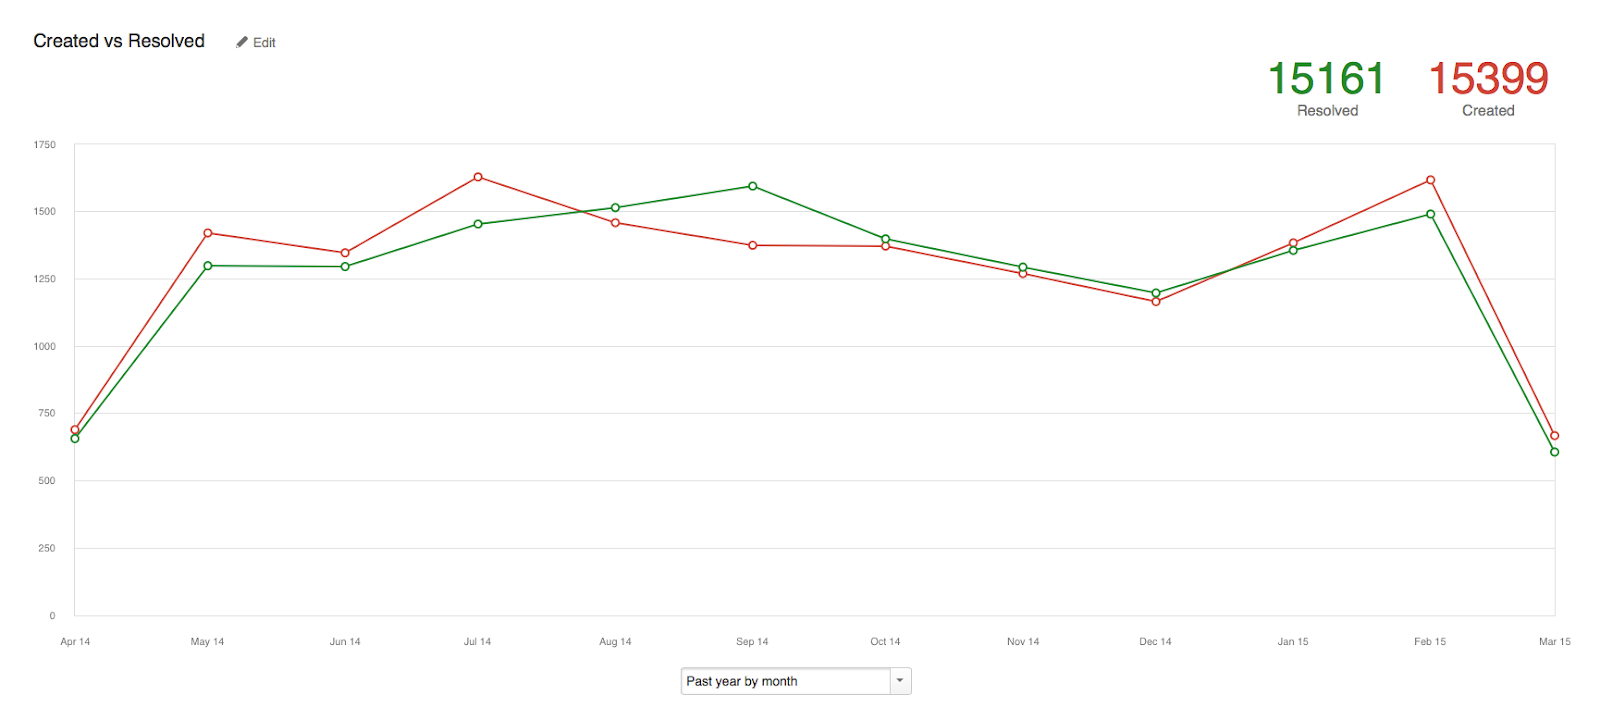
Trending reports can be particularly helpful, because you can compare your performance over a period of time, and look for any anomalies that might be worth exploring further. If you looked at your time-to-resolution data in a vacuum each month, you would never notice that July and August showed a strong upward climb in the number of issues opened. It’s important to look at the entire picture, and to understand the data you are looking at (and if possible, what caused it) before you share reports and discuss results.
Keep a scorecard
Scorecards are a simple, high-level way to both evaluate and communicate your team’s performance. An effective scorecard will include the objective or measurement you are scoring yourself against, and an easy “traffic light” system to indicate your current progress: red (at risk), yellow (caution), or green (good).
The most important thing about a scorecard is to be honest. Nobody performs perfectly at all times, so giving yourself a green smiley across every category at every reporting interval will likely cause more alarm and disbelief than praise. Plus, when something truly does go wrong, you are more likely to get support and understanding if you have been candidly assessing your performance and flagging the areas that are putting you at risk.
A basic scorecard for operational performance is a great way to quickly update stakeholders without burying them in unnecessary technical data. More advanced scorecards, like balanced scorecards, can measure IT’s contribution to larger business goals, and are effective at tracking the performance across entire organizations and companies.
Summary
The above are just guiding principles to help you narrow in on what you want to report, and how. What’s critical is that your metrics are aligned with the unique goals of your organization.
Discover how Jira Service Management helps teams gain context around key metrics and stay on top of customer service goals with robust reporting features and dynamic charts.
How to choose incident management KPIs and metrics
What metrics and KPIs should you use to track your incident management program? Here are some of the most common options and guidance on when to use them.
Read the articleWhat Is SLA? Service Level Agreements Explained
An SLA (service level agreement) outlines expectations between a service provider and a customer. Learn how to set SLAs, measure performance and more.
Read this article