Articles
Tutorials
Interactive Guides
How to track your team's progress in Jira and Zephyr

Sergejs Cuhrajs
Product Marketing Manager
Are you struggling with maintaining visibility of your team’s progress in Jira? This tutorial details how to track your team’s testing activities using built-in reports in Zephyr Scale.
Time:
10 minute read.
Audience:
You are a test manager working on a project in Jira, and need a high-level overview of your team’s testing activities.
Prerequisites:
- You have created a Jira account and a Jira scrum project
- You're familiar with the basics of scrum and epics
- You have installed Zephyr Scale and used it to populate your Jira instance with test cases and test executions
Scenario
You’re a test manager and need a high-level overview of your team’s testing progress. Usually this information involves the number of tests left to execute, or the number of tests that failed or were blocked from successful execution for a given plan or a set of test cycles. You also want an easy way to share this information with other teams or stakeholders for increased visibility and collaboration.
Step 1: Set up your test cases in Zephyr Scale
It’s easy to set up test cases in Zephyr Scale. Follow the step-by-step tutorial here.
Step 2: Execute your test cases
Learn more about test executions in Zephyr Scale here.
Step 3: Track a team’s progress with test execution reports
Test-execution reports provide information about the status of the testing effort, including overall software quality and test execution progress.
To view a test execution report:
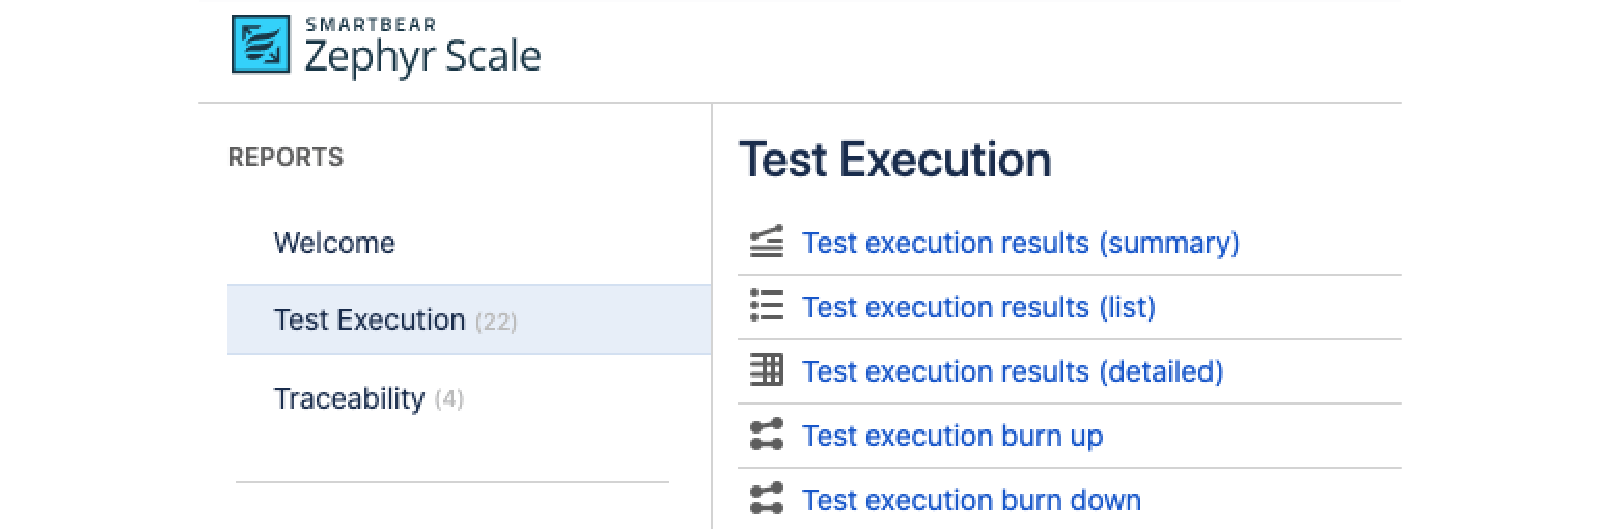
1. With a project open in Zephyr Scale, click the Reports tab in the upper right corner of your screen.

2. Click on the Test Execution tab, then Test execution results (summary). This report provides the summary of the test execution results, including the overall status and progress.
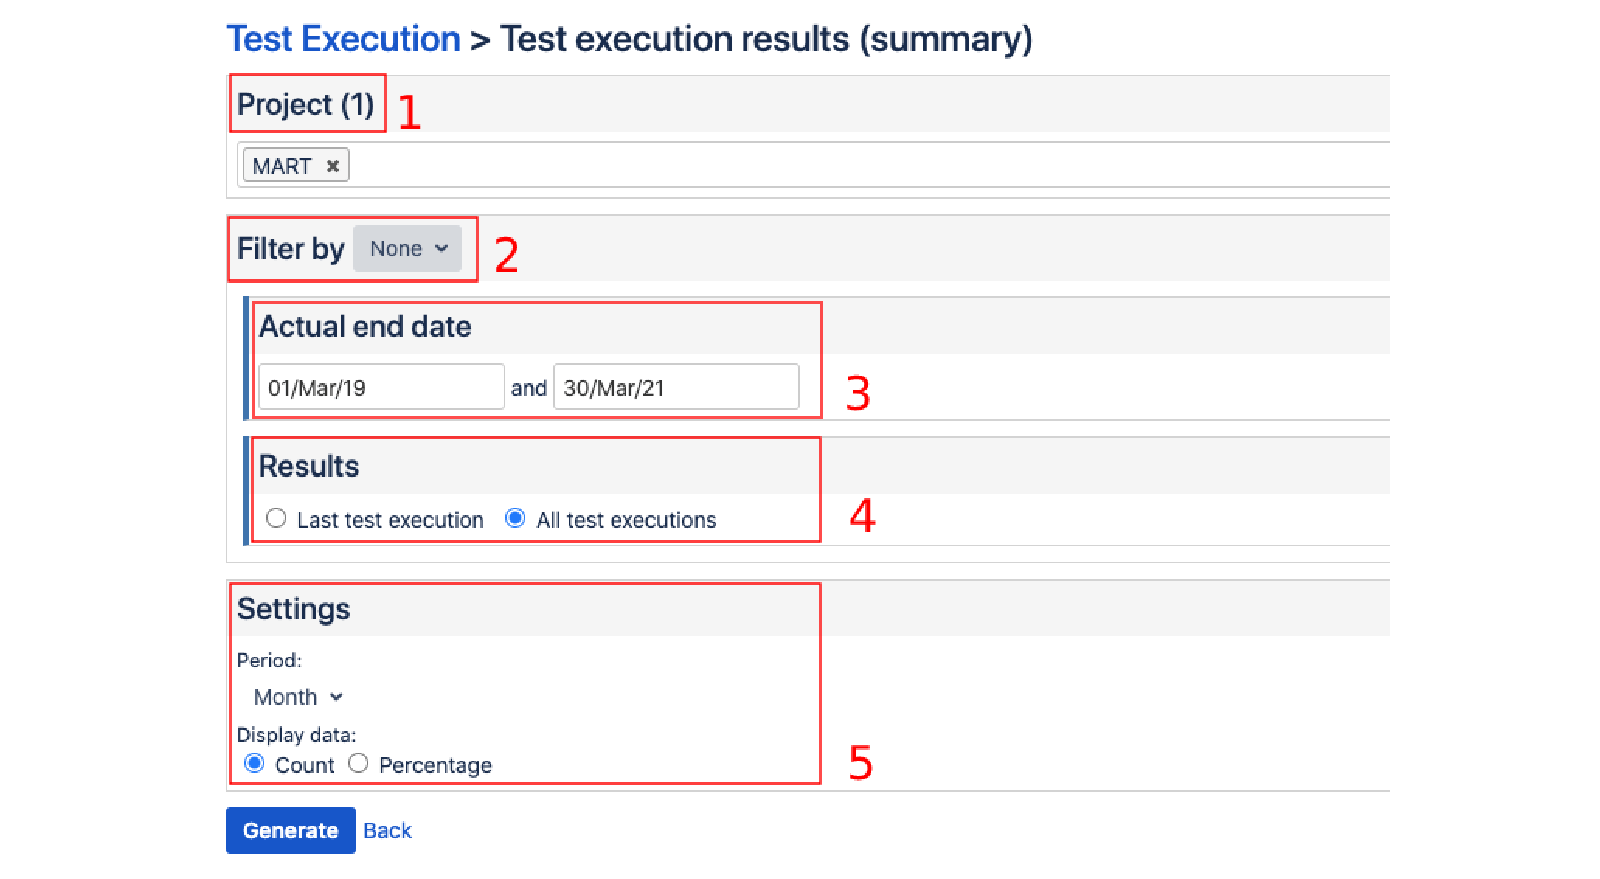
3. In the following screen, you can configure what you want to report on:
- You can select one or multiple projects
- Filter and specify from the dropdown menu
- Select the start and end date if you want to report on a specific test cycle or version
- Filter the results by last test execution or all test executions
- Filter the increments of the data to be displayed
Here are some tips:
- You can filter reports by projects so you can easily conduct cross-project reviews for a client, or for testing effort. For example, you can identify a project that's falling behind on estimates.
- Reports can also filter by epics, stories, or versions, so you can easily get visibility on testing progress for a given area of work or release.
- Learn more about each of these options here.
4. Once you are happy with your settings, hit the Generate button to create a report.
5. To share the report to relevant stakeholders outside of Jira, hit the Printer button in the upper right corner of the screen to generate a PDF version of the report, or use the ‘Share’ button to export raw reporting data to Excel or other spreadsheet application.

Understanding the test execution summary report
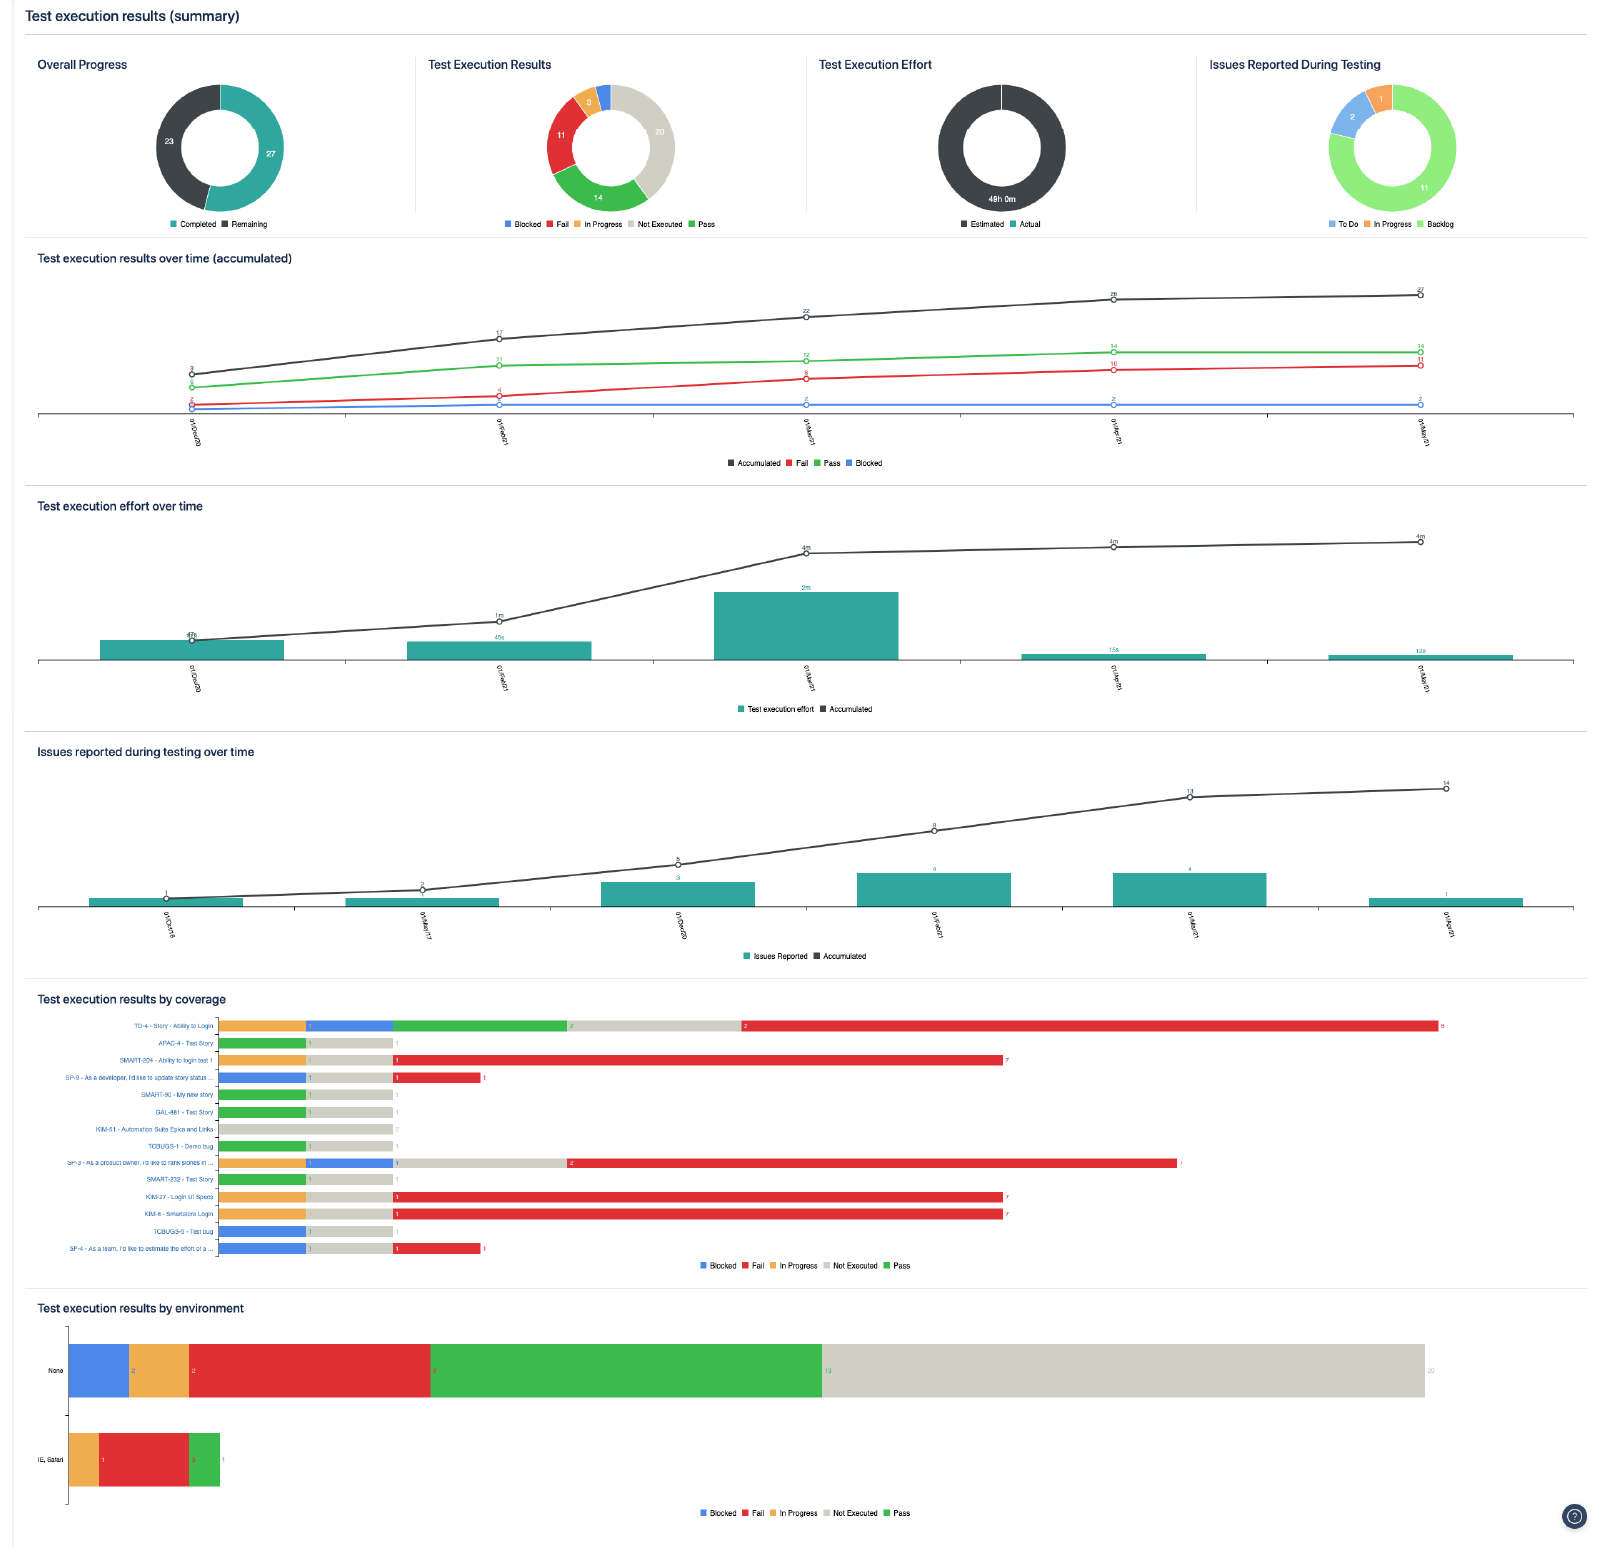
The test execution summary report provides a daily overview of everything that is in flight, from issues raised during testing to results by coverage. This is useful when you want to identify potential delays early during testing and make appropriate adjustments to ensure the project stays on track.
- Overall progress – see how many test executions were completed and how many are still outstanding
- Test execution results – see the ratio of how many executions passed, how many failed, and how many are yet to be executed
- Test execution effort – see the actual effort (time logged when executing a test) compared to the estimated time
- Issues reported during testing – see how many issues (a.k.a bugs) were raised during a specified time
- Test execution results over time (accumulated) – see your team’s progress over a period of time
- Test execution effort over time – see the actual effort (time logged when executing a test) against the estimated time
- Issues reported during testing over time – see a breakdown of how many issues occured over a given period (e.g. week or month)
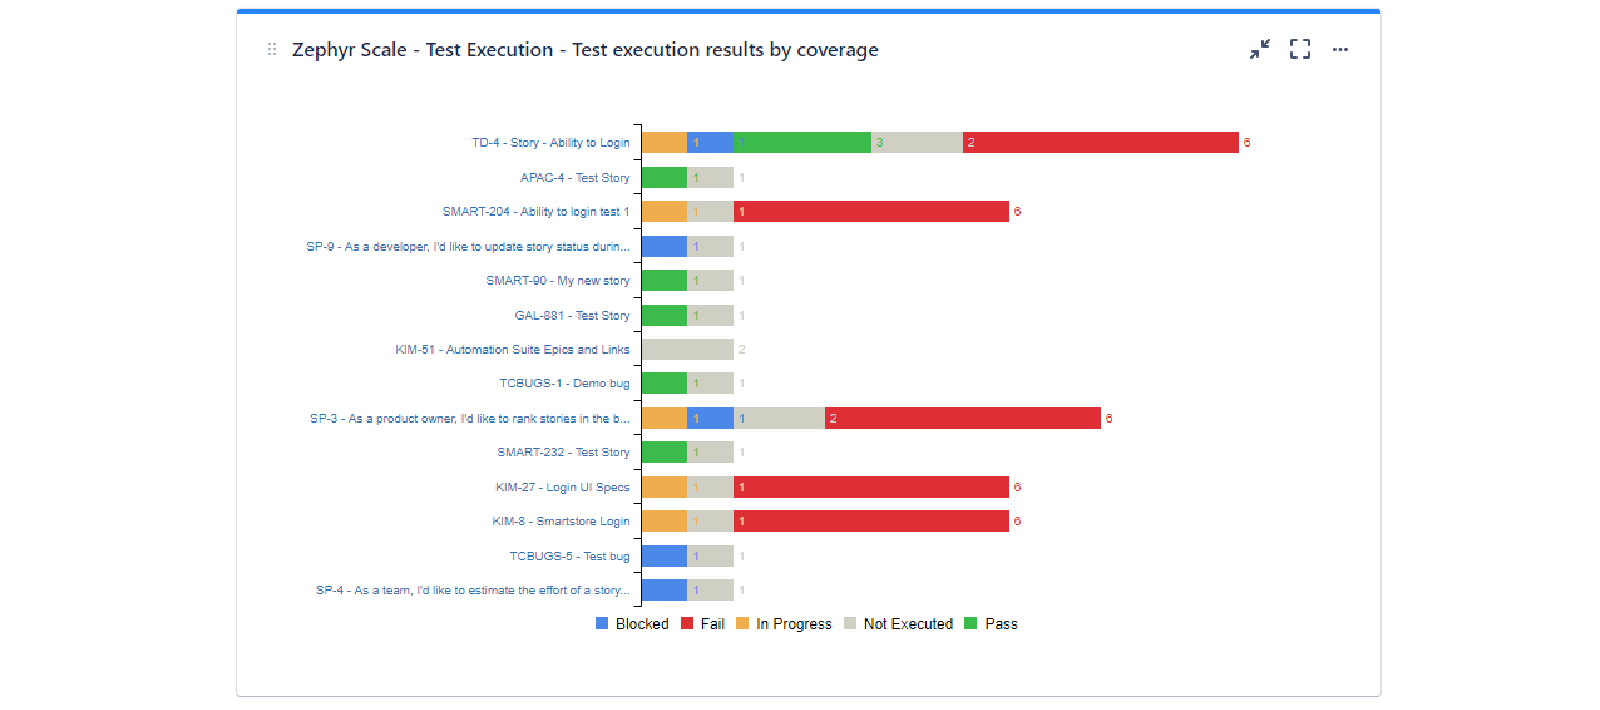
- Test execution results by coverage – provides a bar chart of test execution results grouped by coverage
- Test execution results by environment – provides a bar chart of test execution results grouped by environment
Step 4. Make use of built-in gadgets
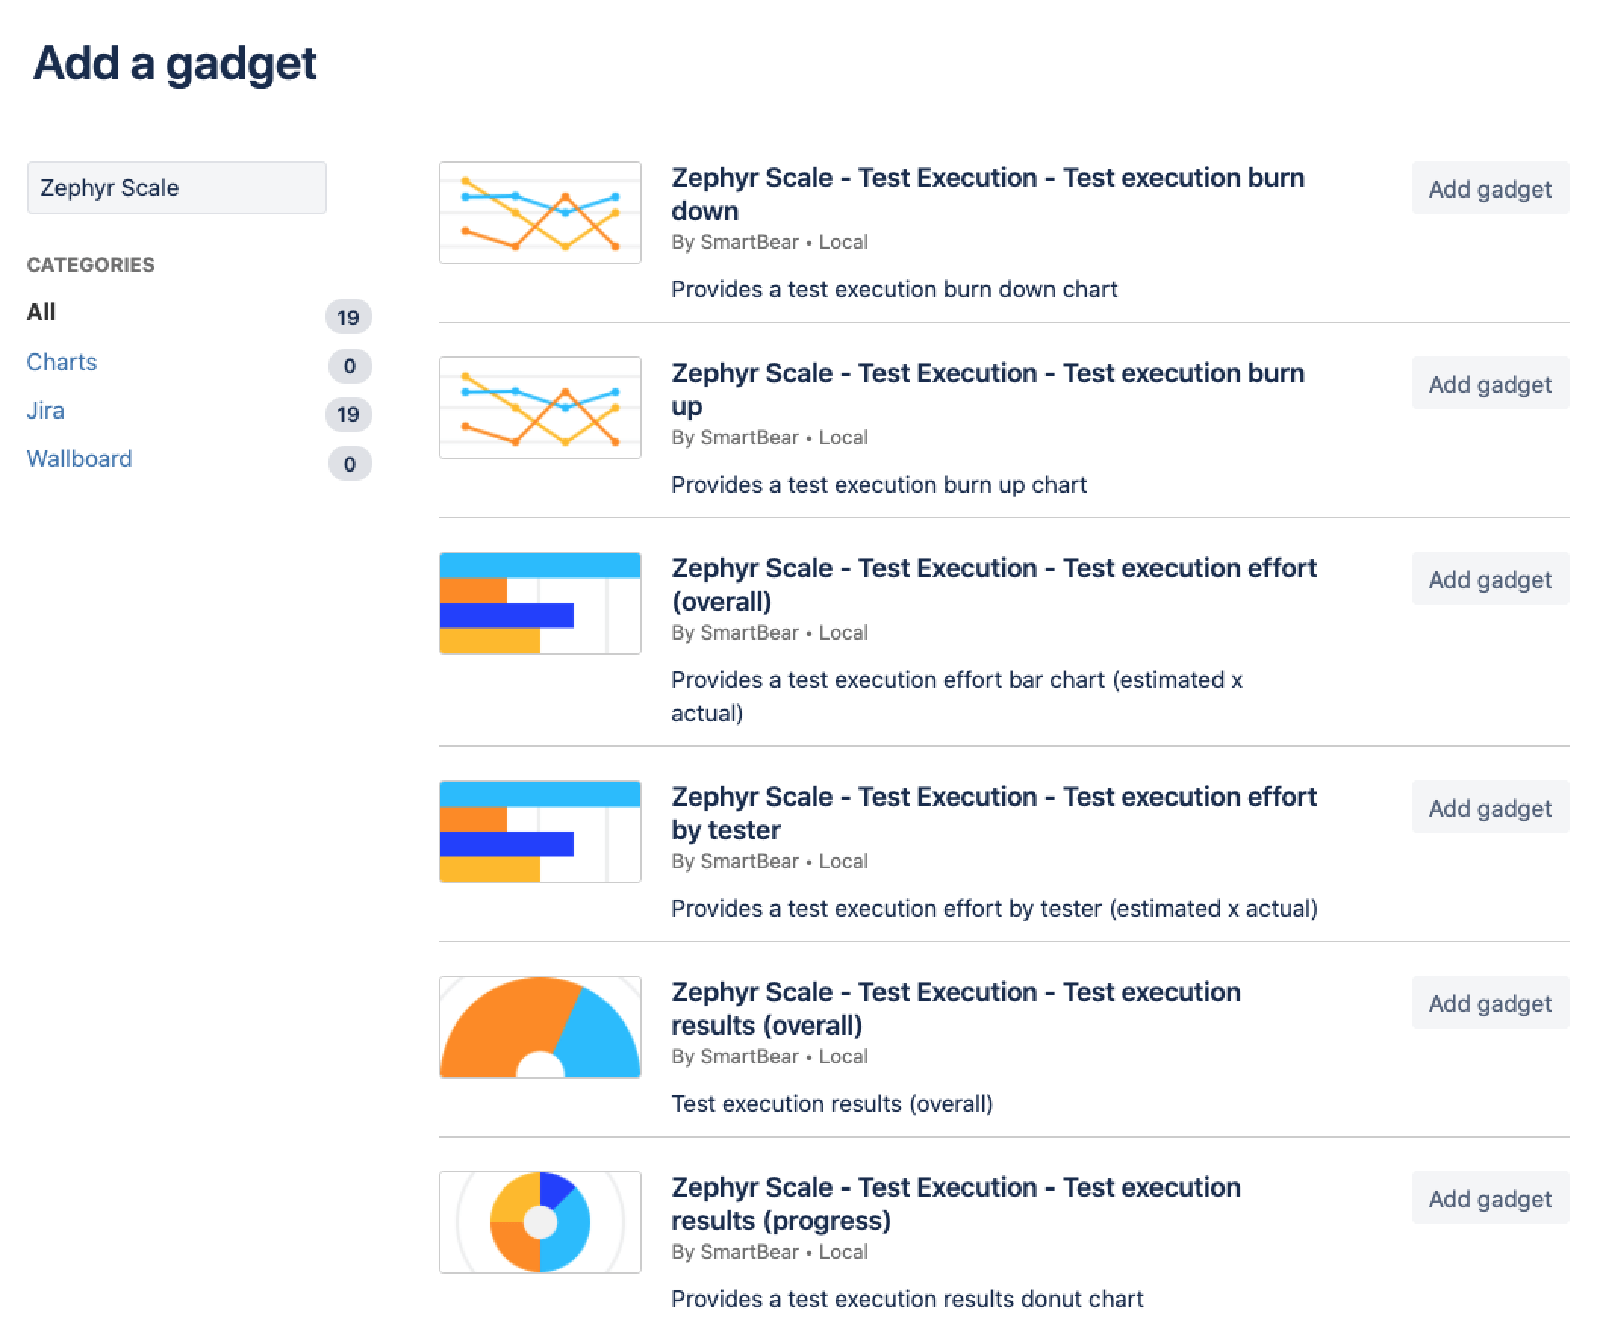
Jira dashboard gadgets are a great way to provide executives, stakeholders, or team members with daily, high-level updates on a team’s progress.
Zephyr Scale includes built-in gadgets that can be added directly to the Jira dashboard. Two of the popular gadgets are:
- Test execution results by coverage - provides quick access to test execution results by coverage
- Test execution results by test cycle - provides test execution results by test cycle
Learn how to use the built-in gadgets here.
Here are some tips:
- For easier data analysis and collaboration, use the Share function to provide the necessary gadgets to your colleagues
- Split the dashboards by category. For example, you can have the dashboard show coverage status, testing progress, or effort
Looking for more?
Zephyr Scale comes with a rich selection of built-in reports and Jira dashboard gadgets on test executions, traceability, and coverage. To learn more, check out the Reports and Analysis section in the documentation.
See more integrations for Atlassian Open DevOps.
Share this article
Next Topic
Recommended reading
Bookmark these resources to learn about types of DevOps teams, or for ongoing updates about DevOps at Atlassian.

DevOps community

DevOps learning path