Articles
Tutorials
Interactive Guides
Automatically create a Jira Software issue from a detected problem in Dynatrace

Rob Jahn
Technical Partner Manager and DevOps Evangelist at Dynatrace
This tutorial details how to automatically create a Jira issue based on a problem detected by Dynatrace. See our other tutorial, How to integrate Dynatrace and Jira for greater observability, to learn how to set up the Jira and Dynatrace integration.
For this use case, the “customer” backend service will be shut down, which will cause errors in the “frontend” service. These errors will then be detected by Dynatrace and Jira issues will automatically be created.
Time
15-minute read. Complete over 2-3 hours.
Audience
You have administrator projects permission for all projects. See Managing project permissions for more information.
You have administration permission for your Dynatrace environment. See Get started with Dynatrace for more information.
You have a basic knowledge of Linux commands.
Prerequisites
You have a Dynatrace environment -- Get a 15-day trial of Dynatrace.
A Linux host is required to run a Dynatrace provided sample application. Follow the installation instructions found in this README for requirements and instructions to install on a virtual machine.
This same Linux host needs to have the Dynatrace OneAgent installed.
You have a Jira Software account. Get started with Jira here.
Want to learn more?
For more detailed information on working with sprints in Jira, check out the sprints tutorial.
Have questions? Ask the Atlassian Community.
Overview
This tutorial depends on several components that interact with each other. In this tutorial, you will:
1. Configure Jira Automaton to create a Dynatrace problem card comment with the URL back to the Jira issue.
2. Configure Dynatrace to push problems to Jira.
3. Trigger a problem in the sample application and review how Dynatrace detects the problem and automatically creates a Jira issue.
4. Configure Jira issues queries within the Dynatrace Release page.
5. Clean up your environment.
This diagram shows the components for this tutorial and the basic interaction between them.
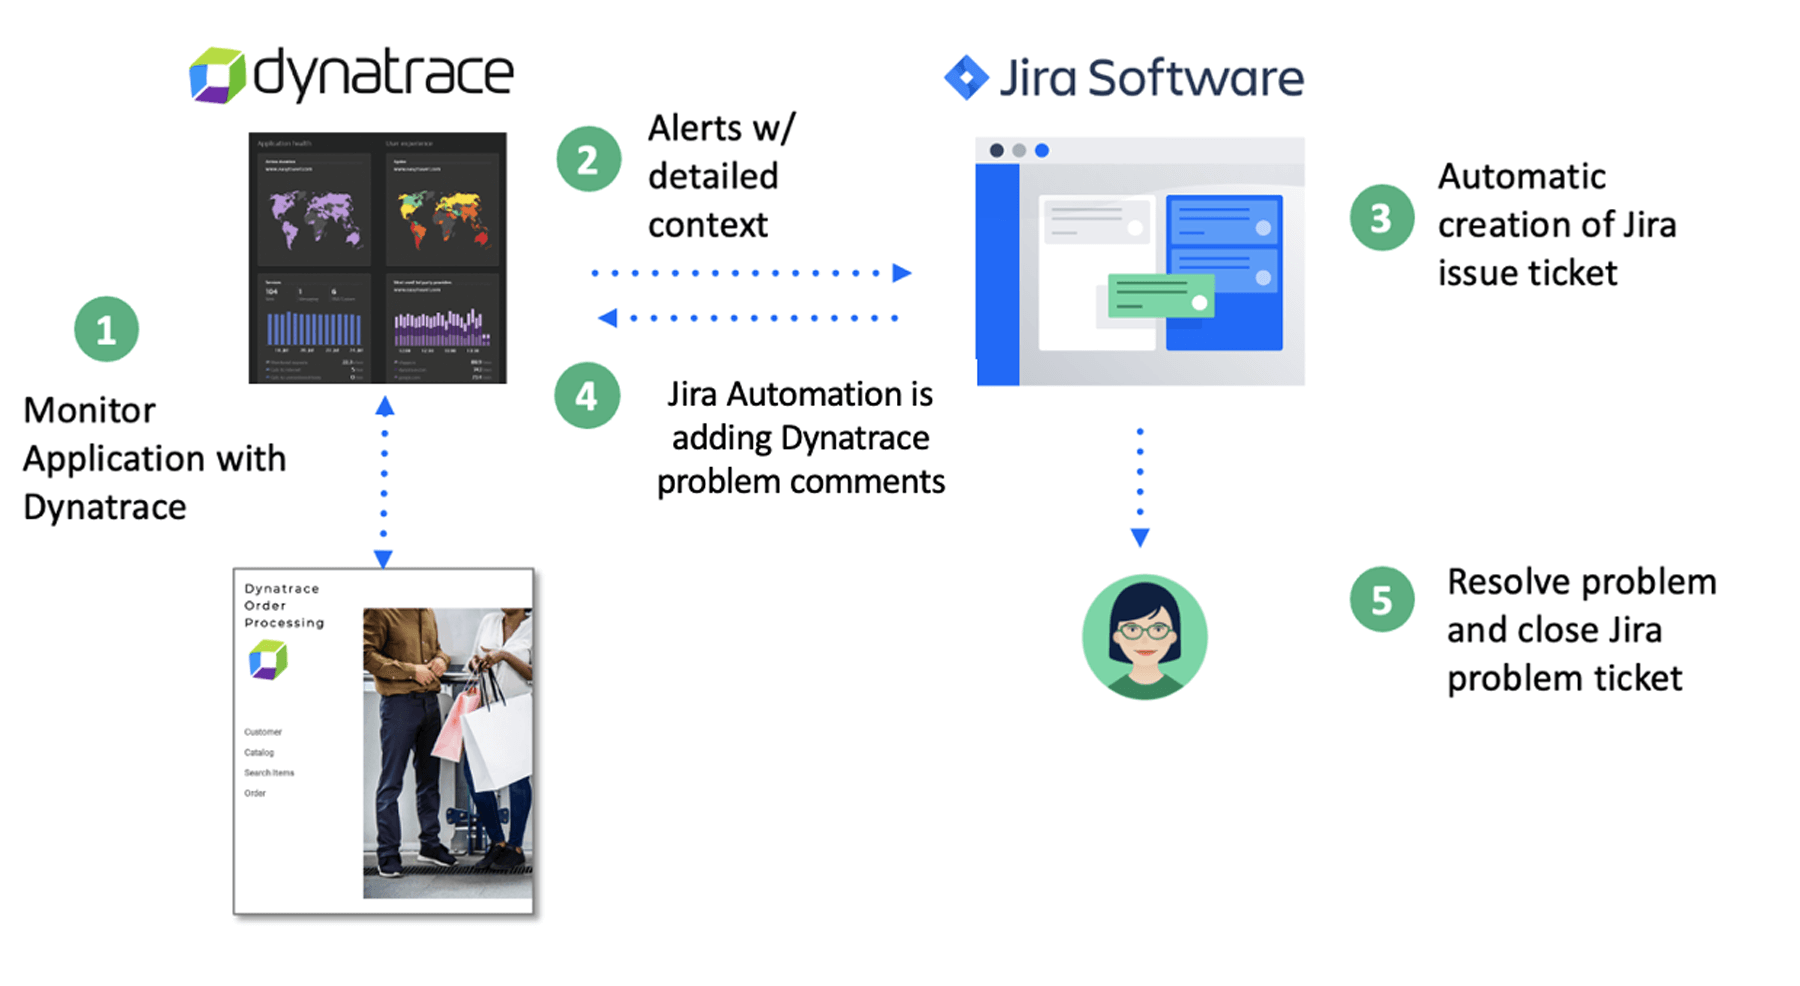
1. Monitor application with Dynatrace – For this tutorial, Dynatrace will collect metrics from a Dynatrace agent installed on the host that runs the sample application. All the data is centralized into the central Dynatrace tenant, which also provides the web interface for administration and AI-powered problem detection.
2. Problem notification with detailed context – Dynatrace’s AI Engine, Davis, uses high-fidelity metrics, traces, logs, and real user data mapped to a unified entity model. It uses Davis’ deterministic AI to reveal the precise root causes of problems. Davis not only locates the precise root cause, but it delivers valuable context instantly. You'll know whether a problem is the result of a resource bottleneck or deployment change, and even who's behind it. You can replay problems to fully understand why they happened and how to fix them.
3. Automatic creation of a Jira issue – The Dynatrace and Jira integration automatically create issues for all new problems auto-detected in your Dynatrace environments.
4. Jira automation updates Dynatrace – Jira automation is a “no-code” feature that allows for easy build rules in a few clicks. A web request to the Dynatrace API uses the Dynatrace problem ID to update the Dynatrace problem card comments.
5. Resolve problem and close Jira issue
Step 1: Stop the sample application and have Dynatrace detect an availability problem
On the Linux host running the sample application, navigate to the directory with the docker-compose.yaml file and run this command to stop the service:
sudo docker-compose -f docker-compose-services.yaml scale customer-service=0
This command can be used to verify it is not running:
sudo docker ps
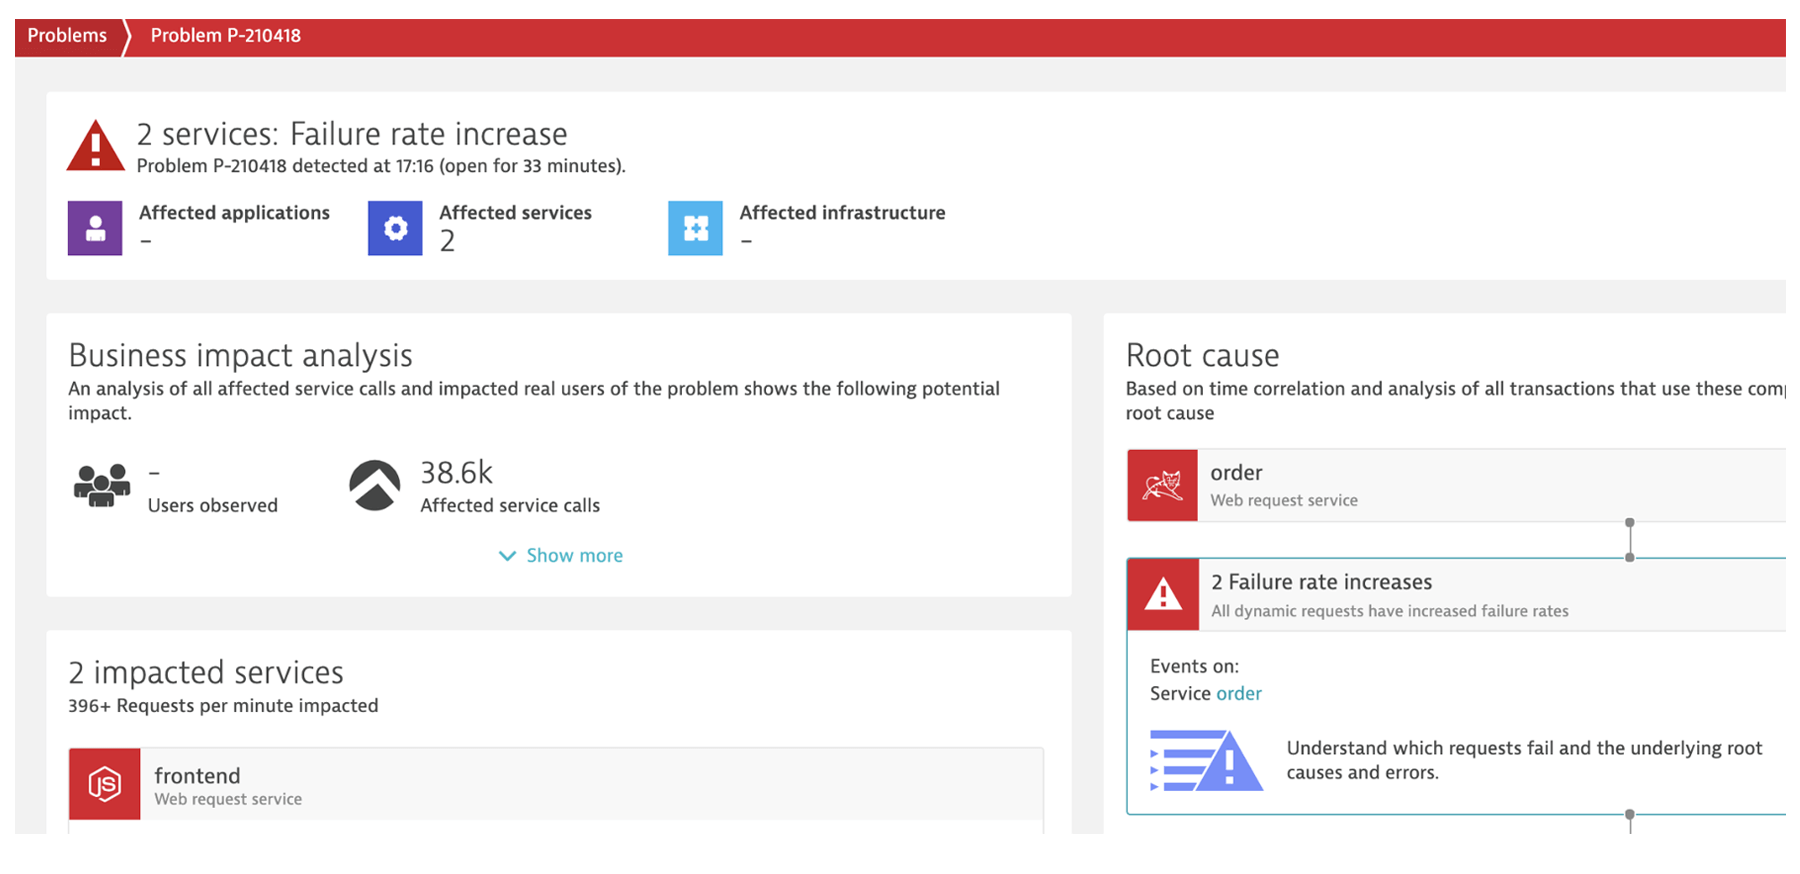
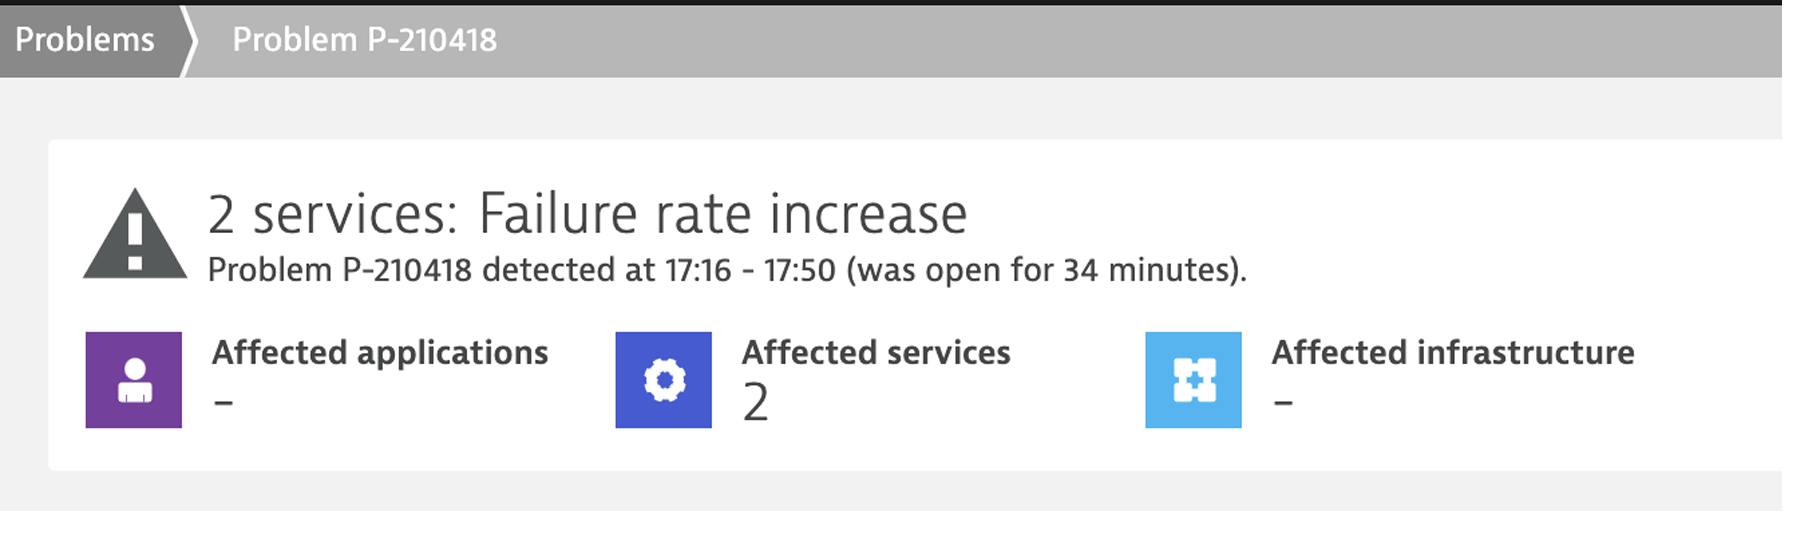
Step 2: Review the problem card in Dynatrace
After a few minutes, the problem will manifest and Dynatrace will create a problem. What is different about Dynatrace is that it is not an alert. Dynatrace uses deterministic AI that performs an automatic fault-tree analysis that factors metrics, logs, real user data, and events. The result is a problem card that shows the business impact, what applications and infrastructure components are impacted, a replayable history of the event, and the root cause of the issue.
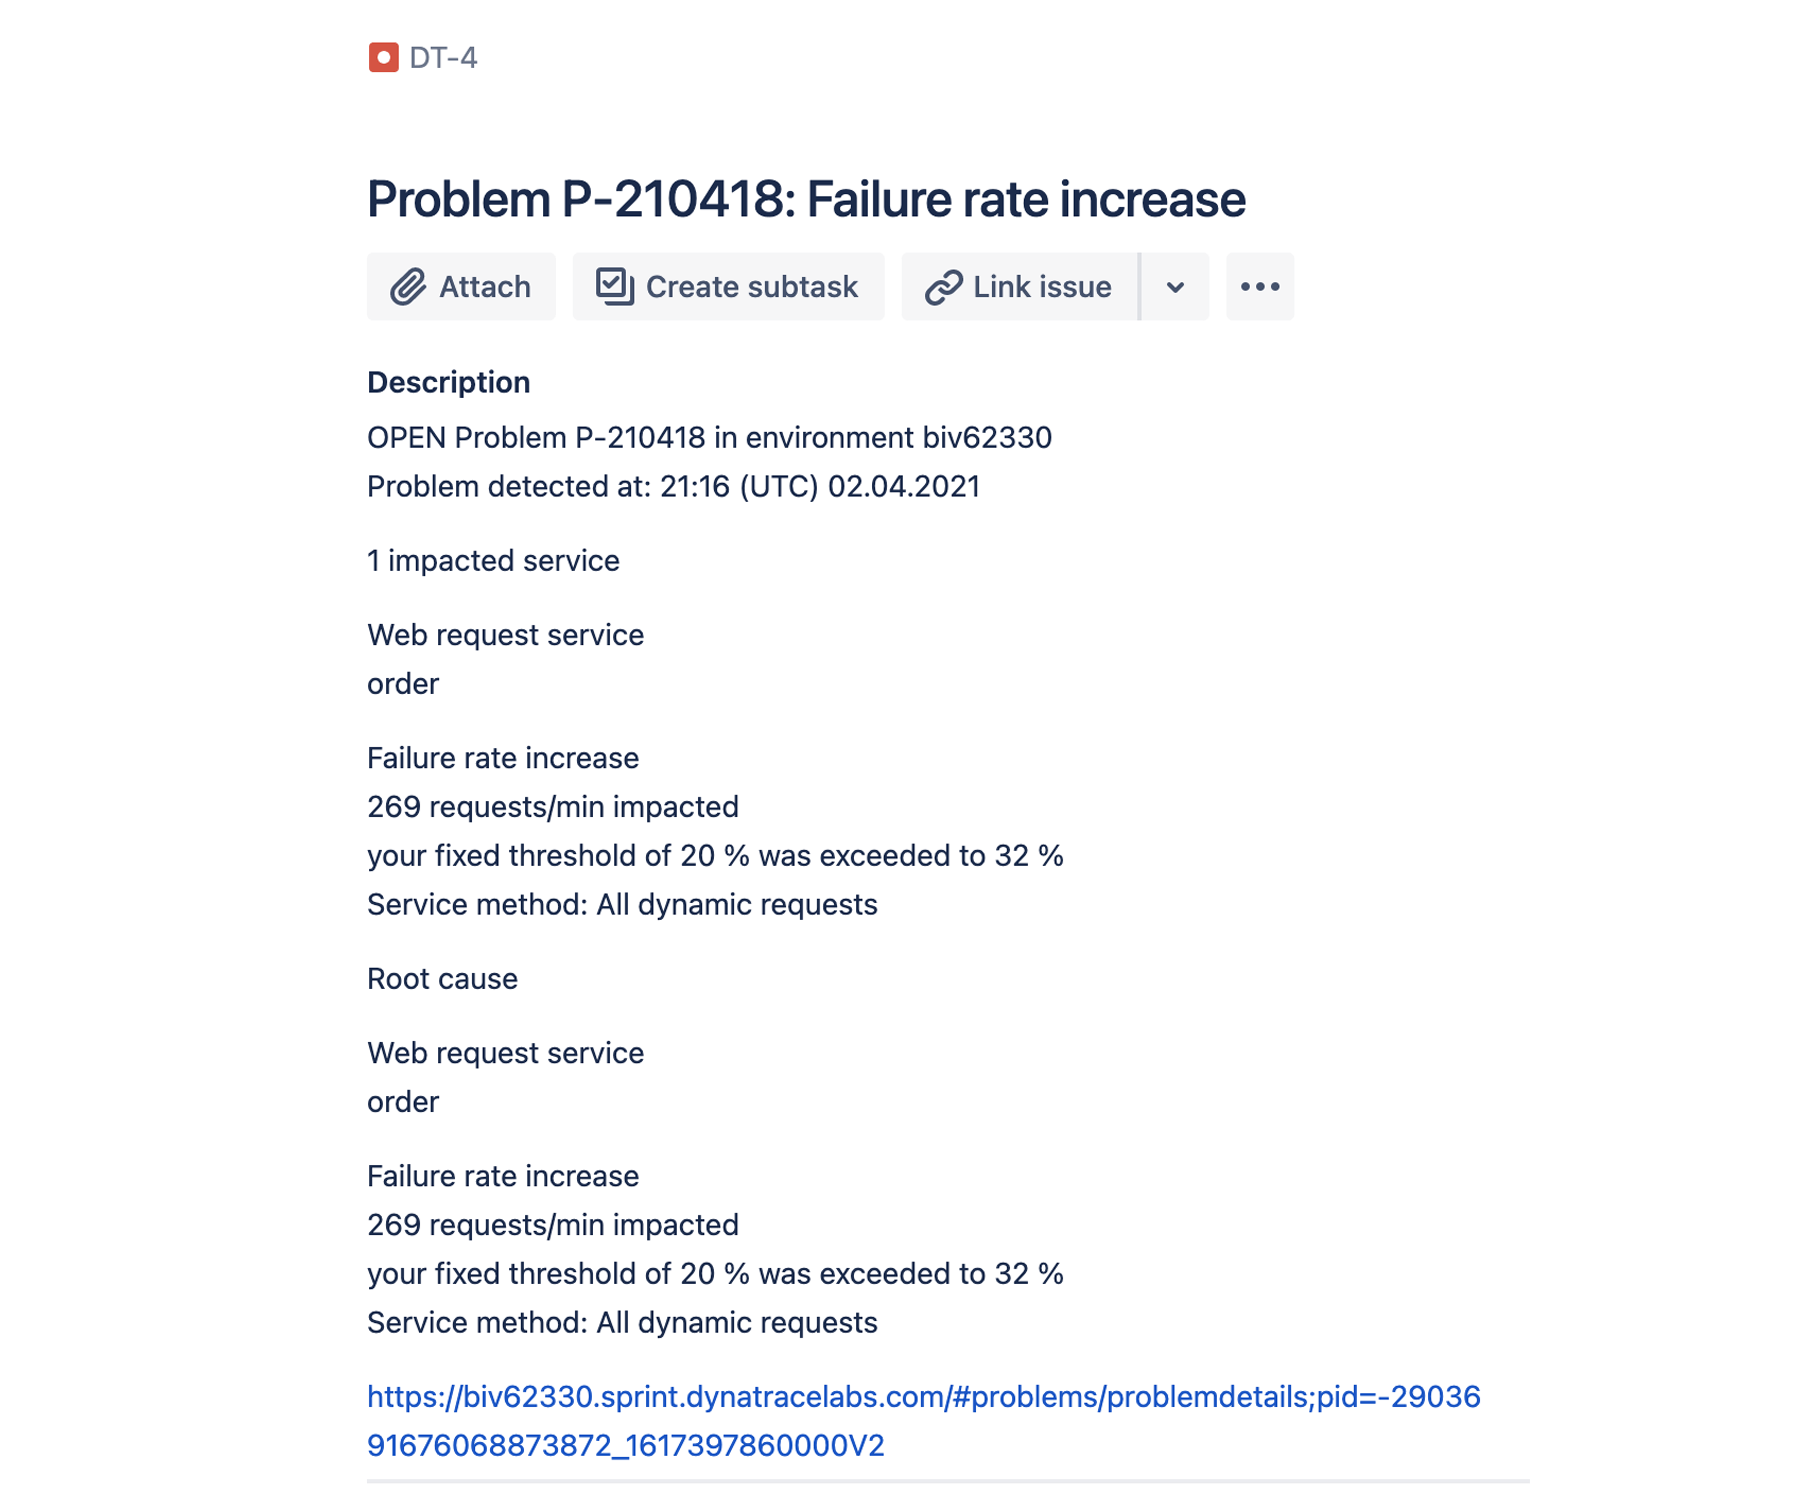
Step 3: Review the auto-generated Jira issue
Jira will reveal a new issue with problem details and a deep URL link back to the Dynatrace problem card.
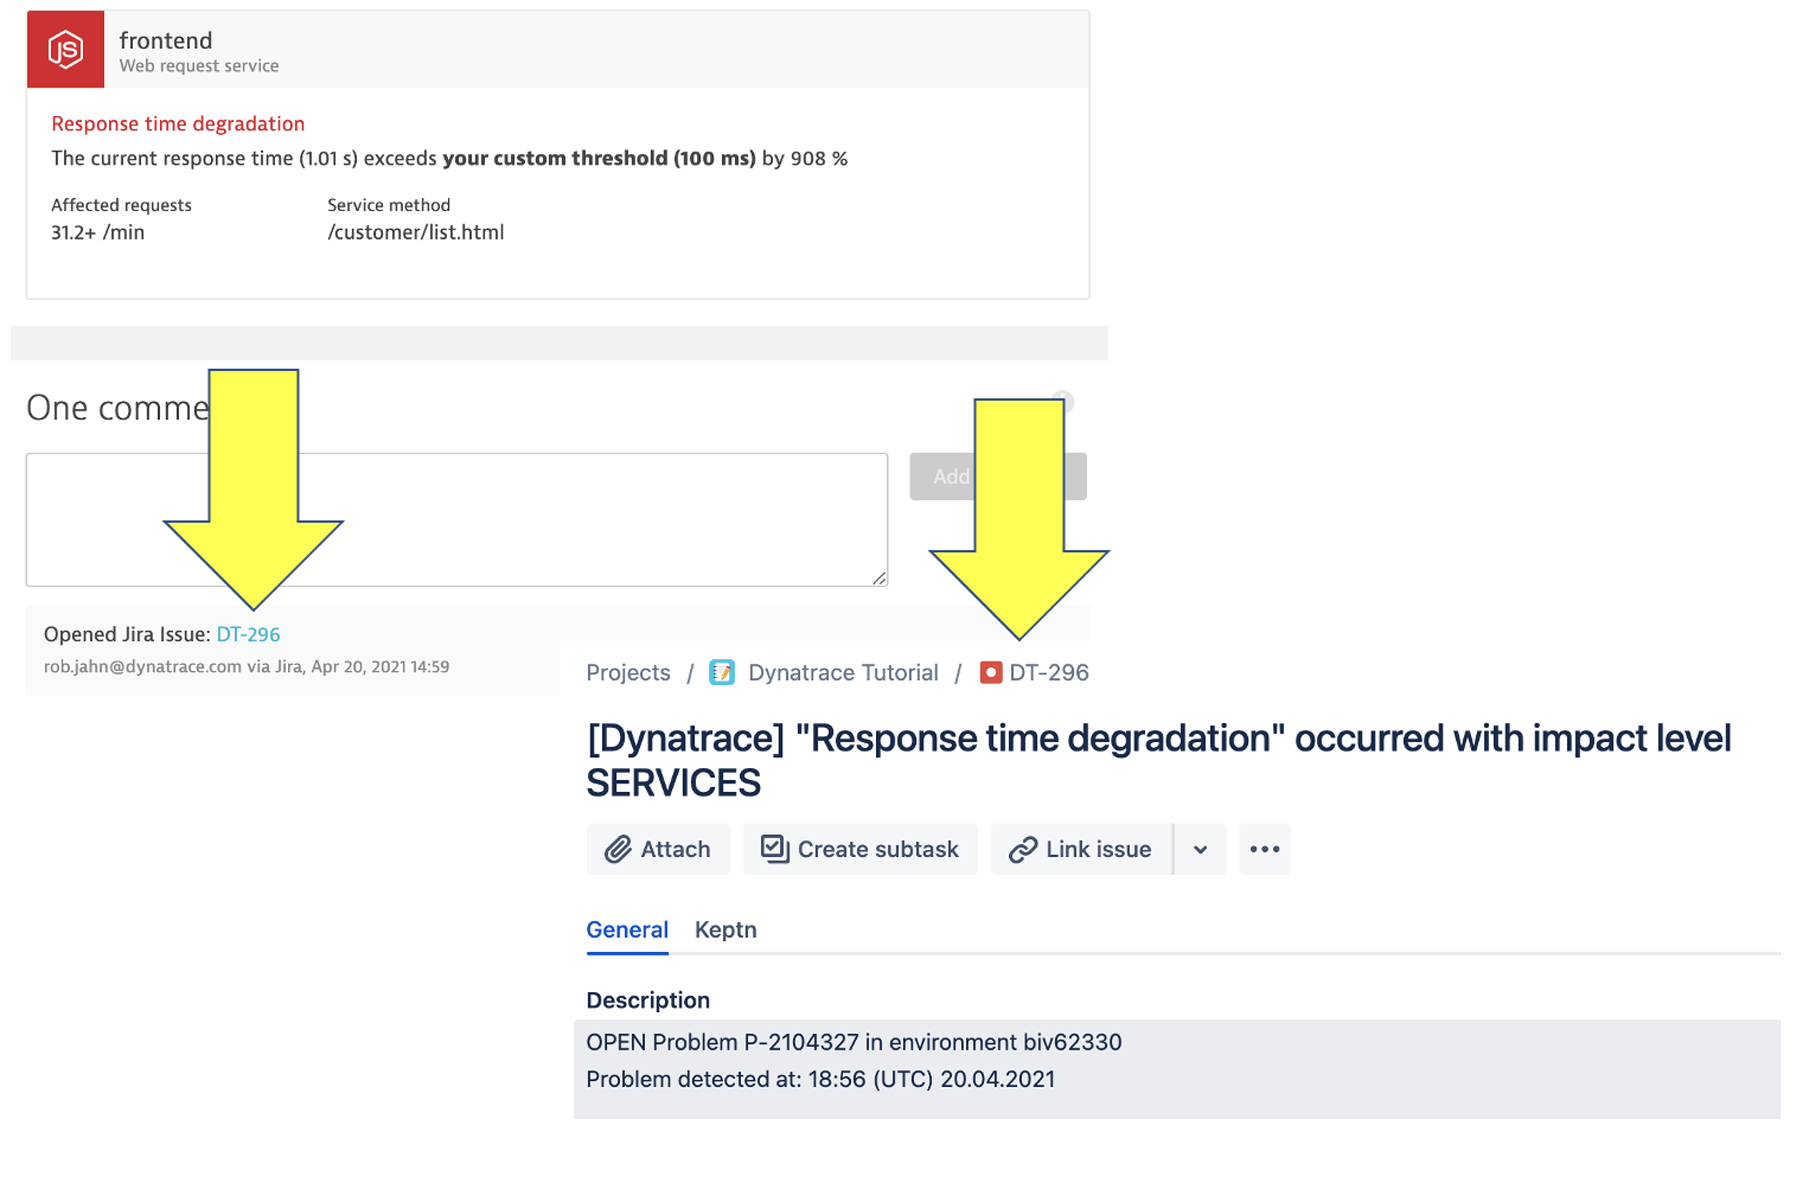
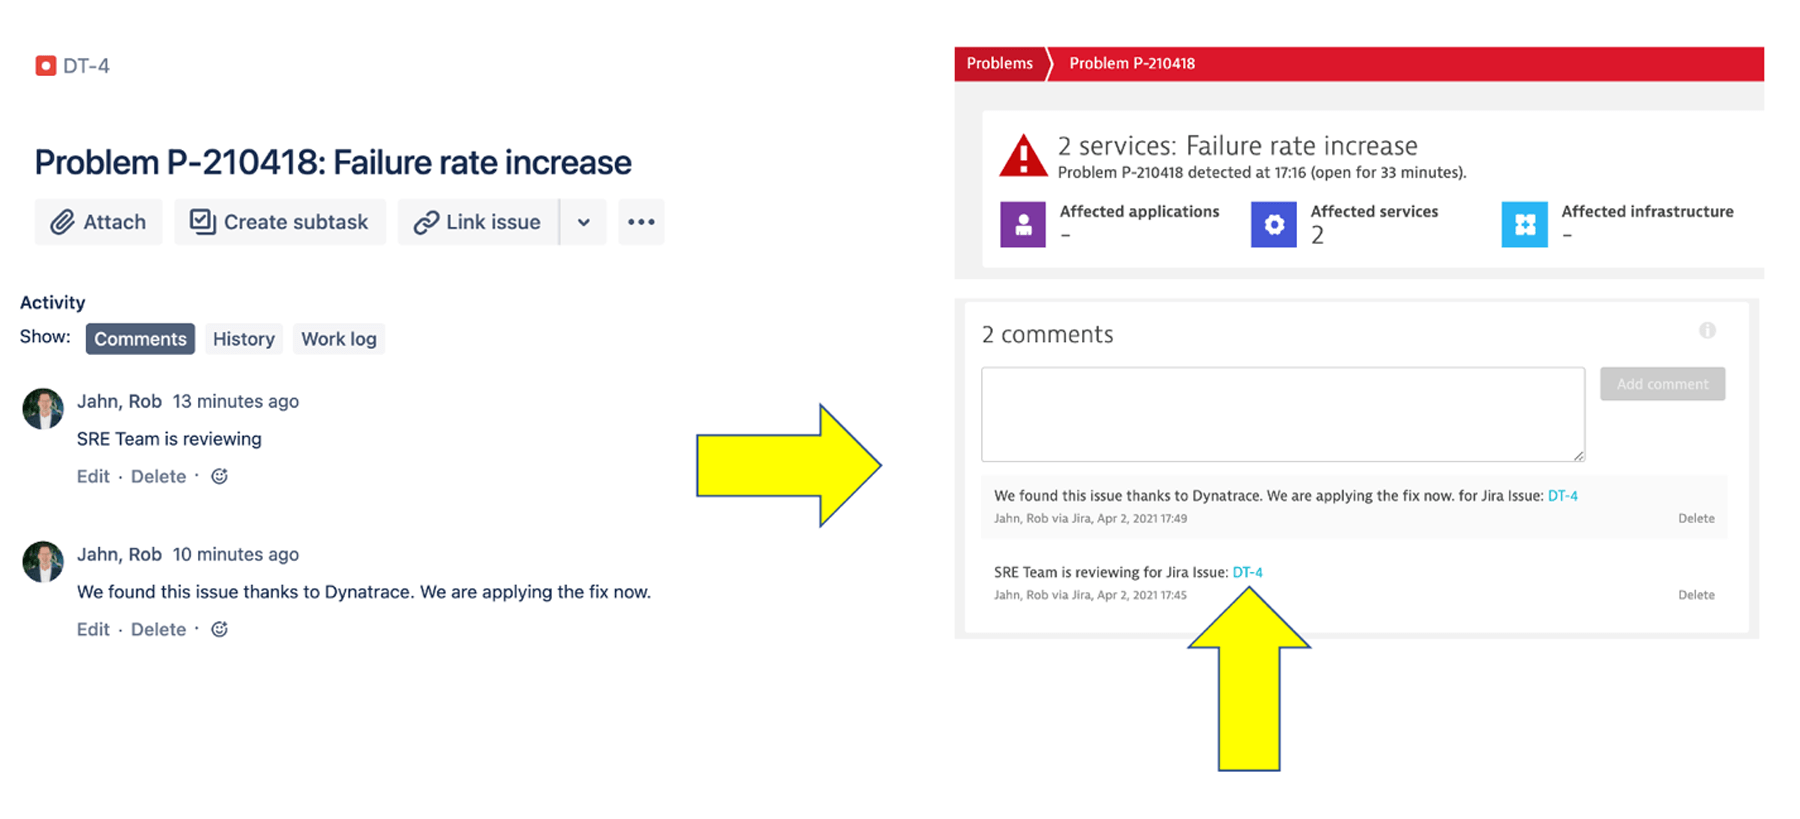
Step 4: View the Dynatrace comment
Once the Jira issue is created, click on the Dynatrace problem URL to open up the Dynatrace problem card. Scroll down to view the comment with the URL back to the Jira issue. This is made possible by the Jira automation Smart Tags added to the Dynatrace API call, which was made by the Jira automation rule.
** Pro Tip -- You could use the same concept to add any new Jira comments as Dynatrace comments. To do so, make a new Automation rule using the “When: Issue commented” trigger and use this as the webhook body:
{
"comment": "{{issue.comments.last.body}} - Jira Issue: [{{issue.key}}]({{issue.url}})", "user": "{{issue.comments.last.author.displayName}}", "context": "Jira" }
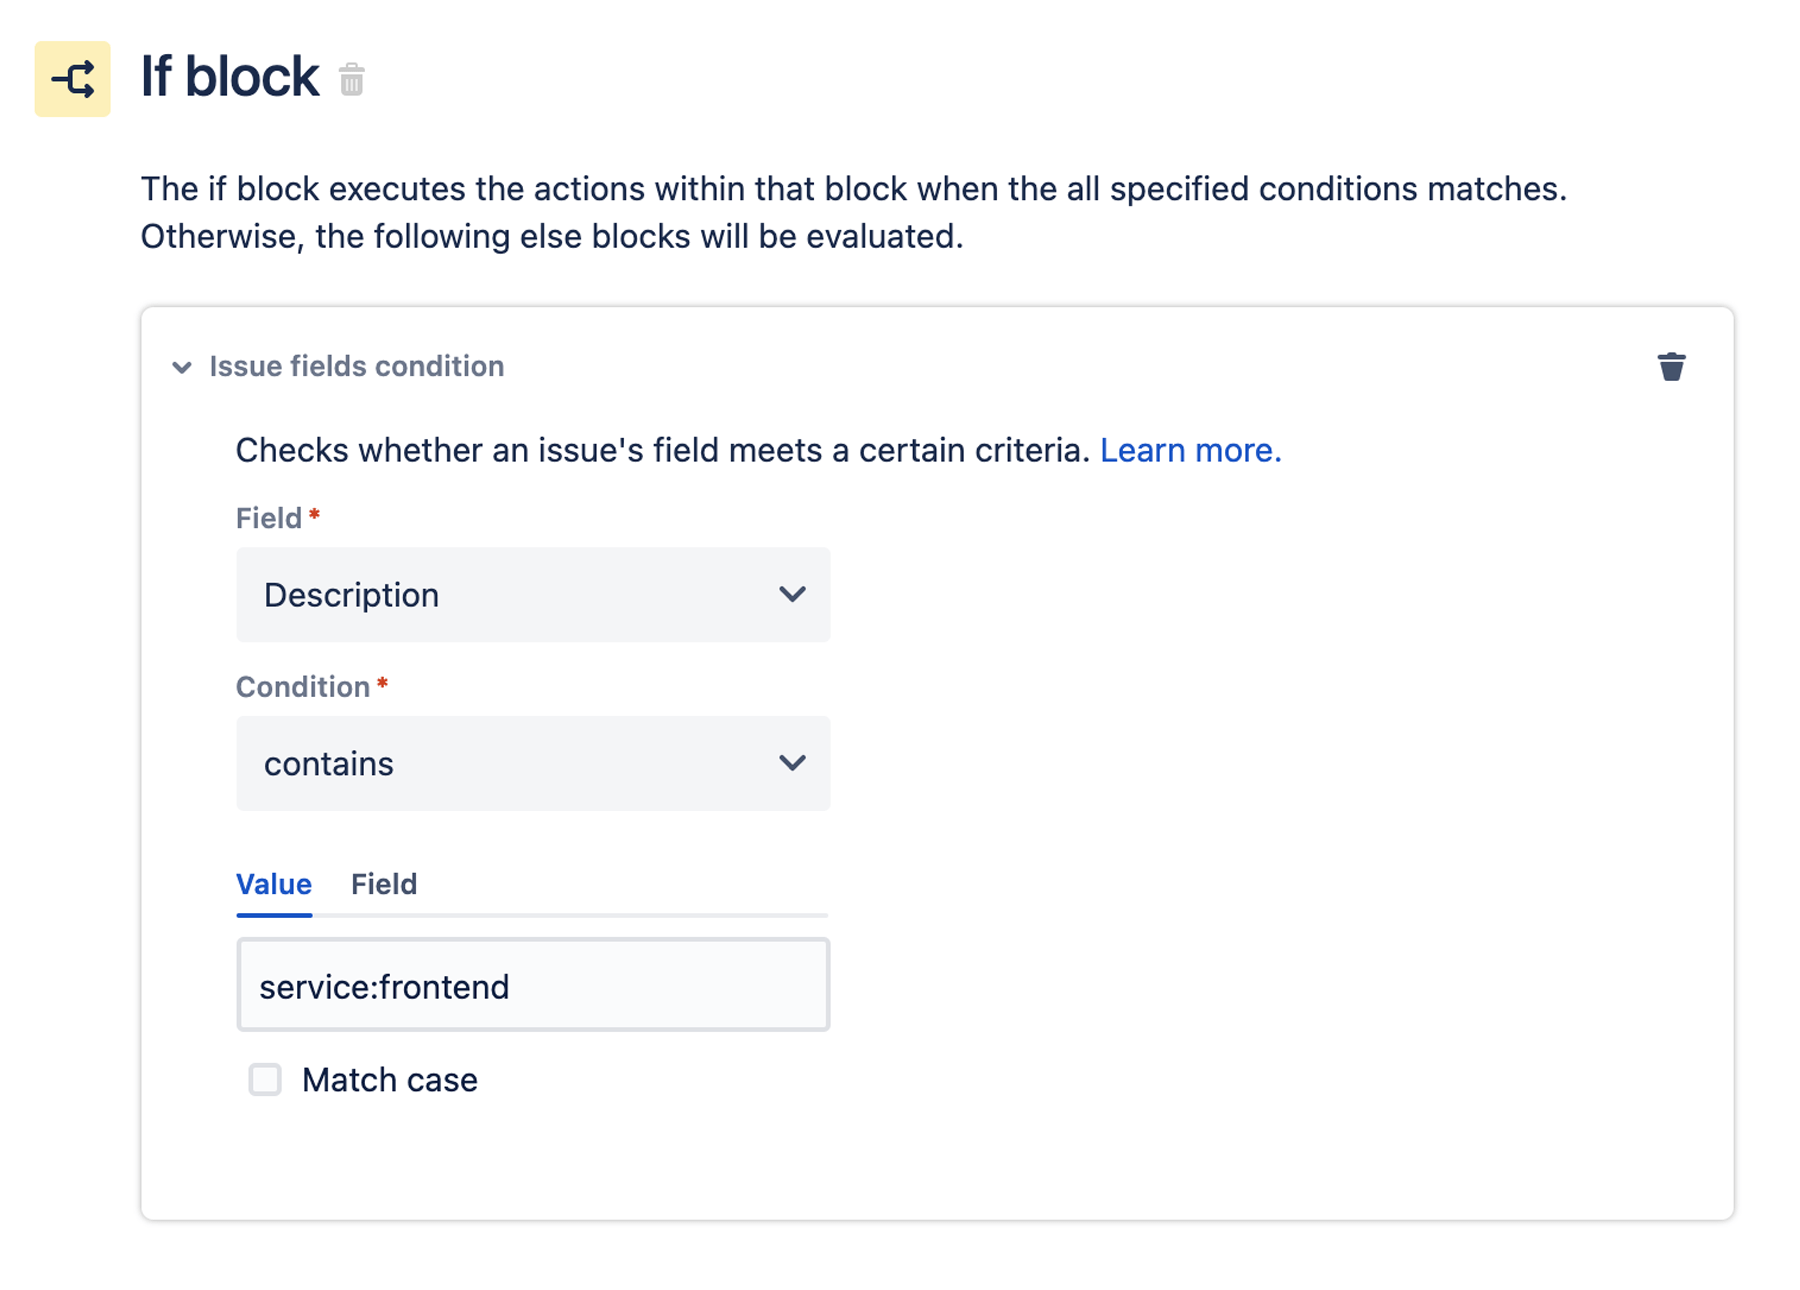
** Pro Tip -- Dynatrace problem notifications can be configured to pass additional information from Dynatrace to Jira including the Problem State, Impacted Entities, and Tags. This data can be further used in more sophisticated automation such as assigning the issue, setting priority, linking to a component, and populating custom Jira fields. The Jira automation “if block” for example can parse match a Dynatrace tag.
Step 5: Resolve the issue by restarting the sample application service
On the Linux Host running the sample application, navigate to the directory with the docker-compose.yaml file and run this command to restart the service:
sudo docker-compose -f docker-compose-services.yaml scale customer-service=1
This command can be used to verify it is now running:
sudo docker ps
Step 6: Review the application again in Dynatrace
Review the frontend service page and you will notice how the failures are gone.
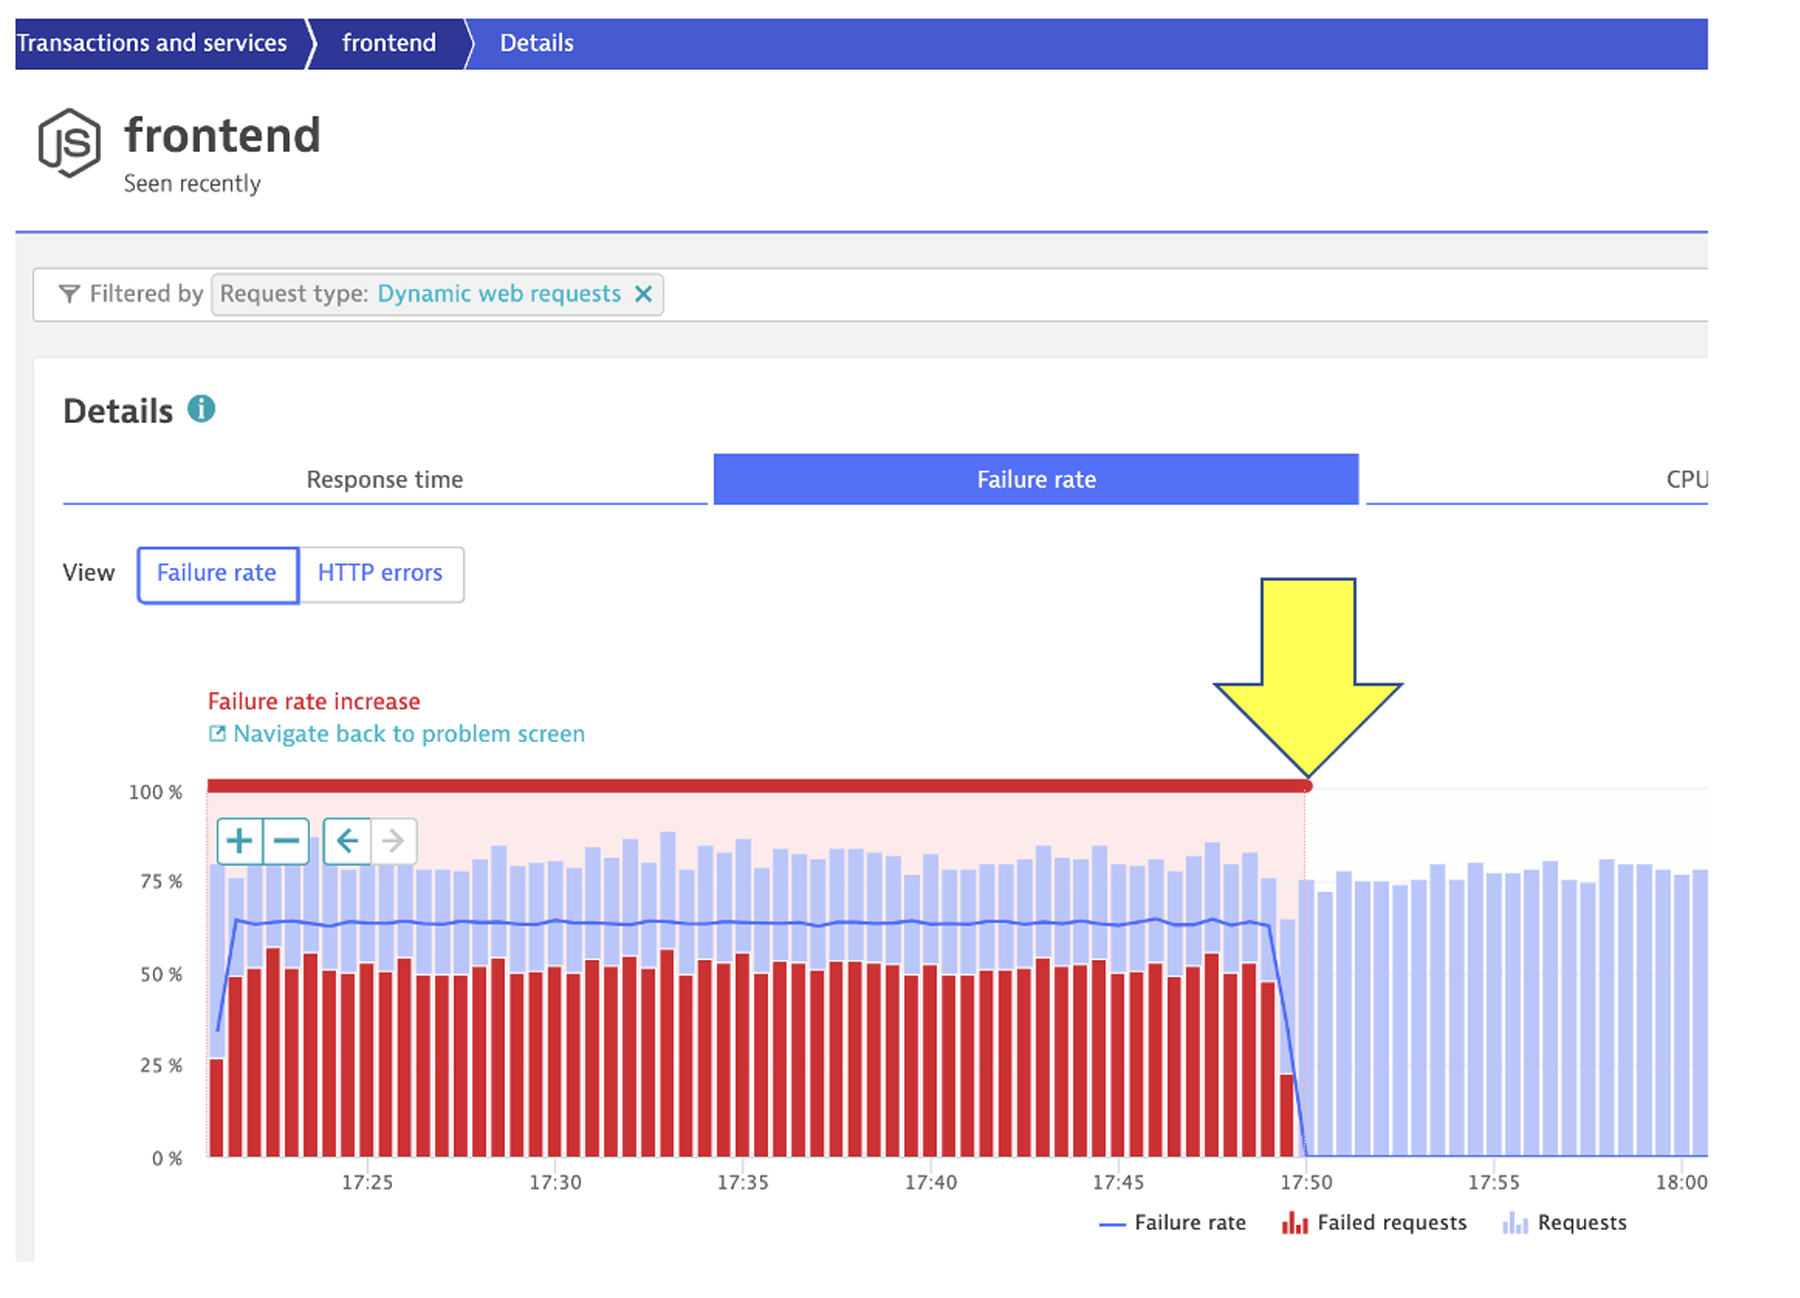
And the Dynatrace problem card was also automatically closed.
Try a few other problems
The Dynatrace Orders application has pre-built problems programmed as different versions. The application was programmed with a feature flag URL that can be used to change the version and thus the behavior of the application. Version 1 for the order and customer services has "normal" behavior, and the problem is enabled by setting the version to 2.
If you would like to try these, see the Dynatrace Orders Overview page.
Configure Jira issues queries within the Dynatrace release page
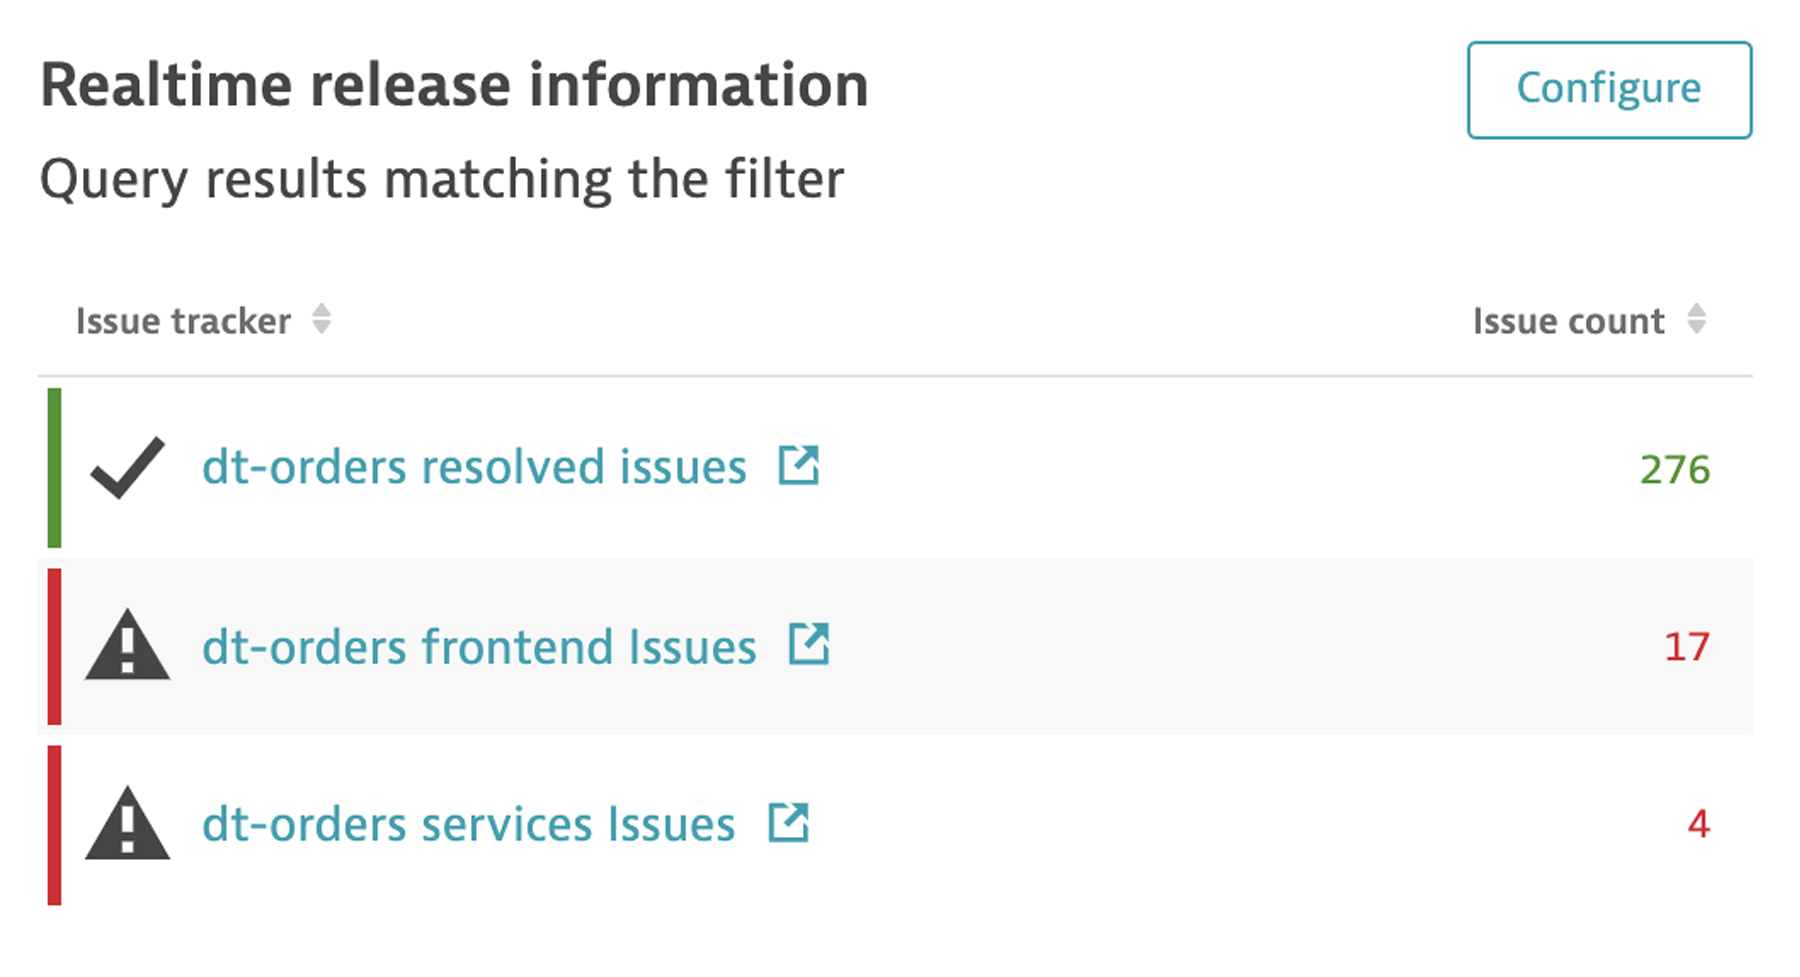
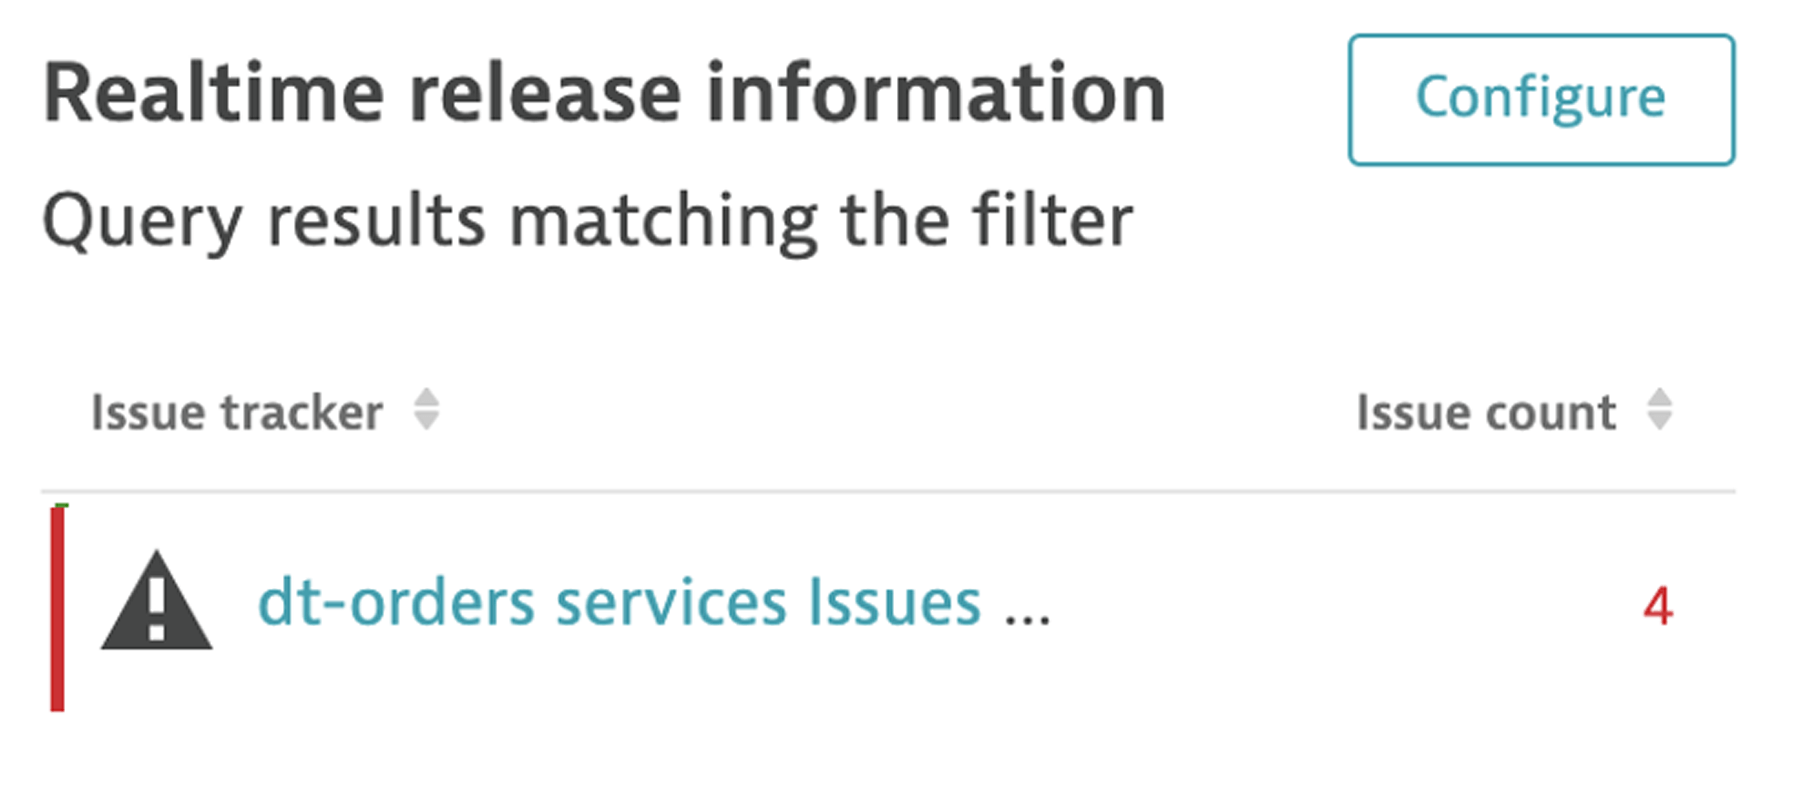
On the Releases page, Dynatrace shows issue tracker queries including issue statistics related to the monitored entities in the real-time inventory.
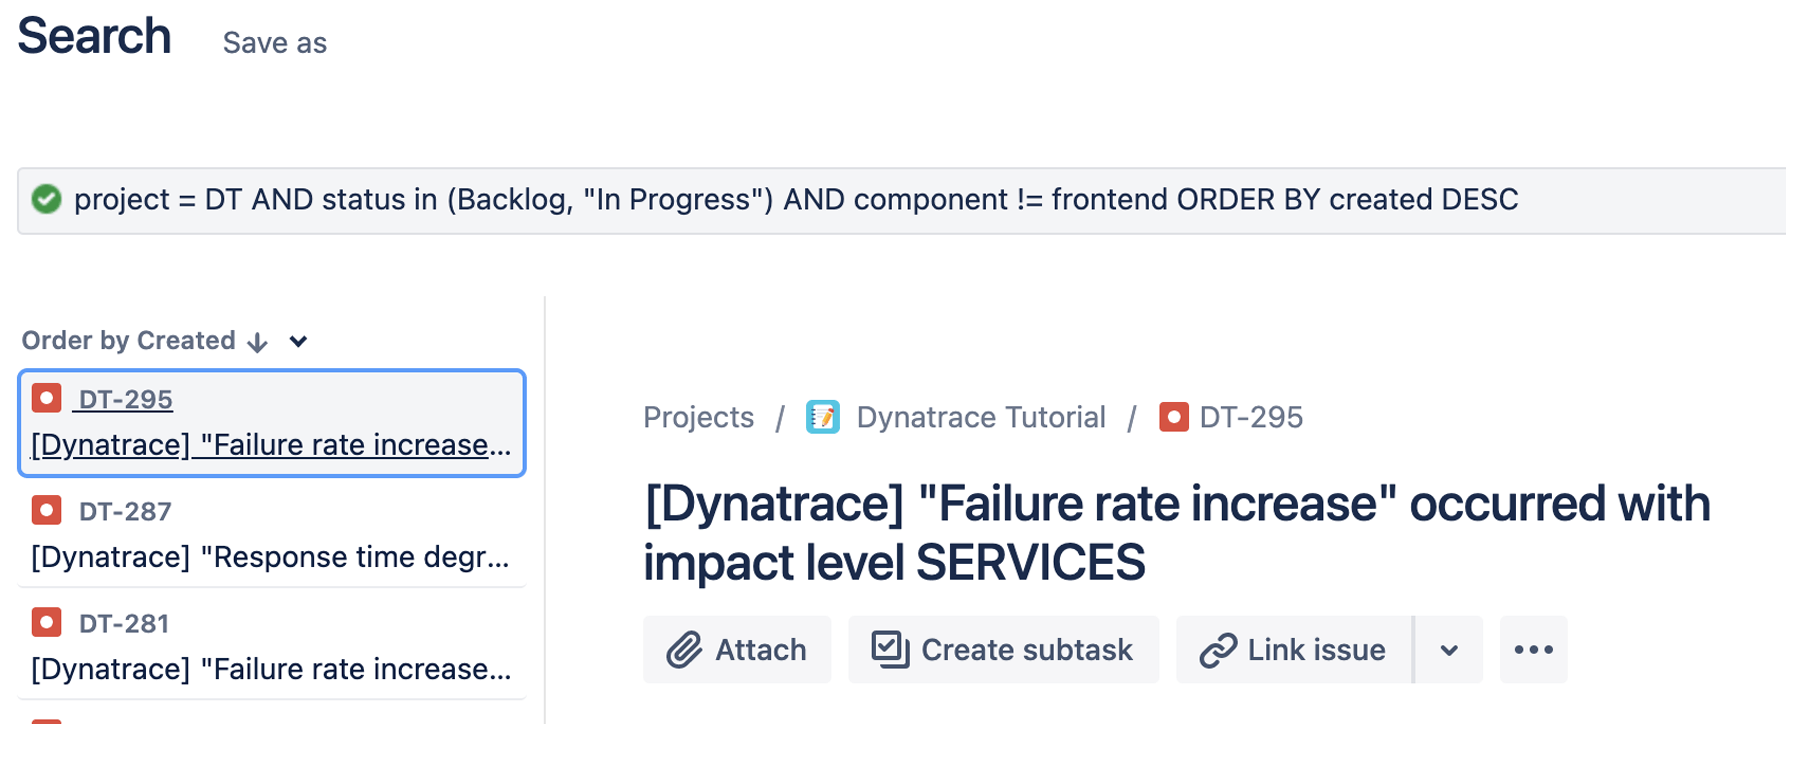
Step 1: Define your JQL
In Jira’s issue search, construct a Jira Query Language (JQL) expression, such as the one shown below.
project = DT AND status in (Backlog, "In Progress") AND component = frontend ORDER BY created DESC
Step 2: Create release issue tracker queries
1. Within Dynatrace, navigate to the Releases page using the left side menu.
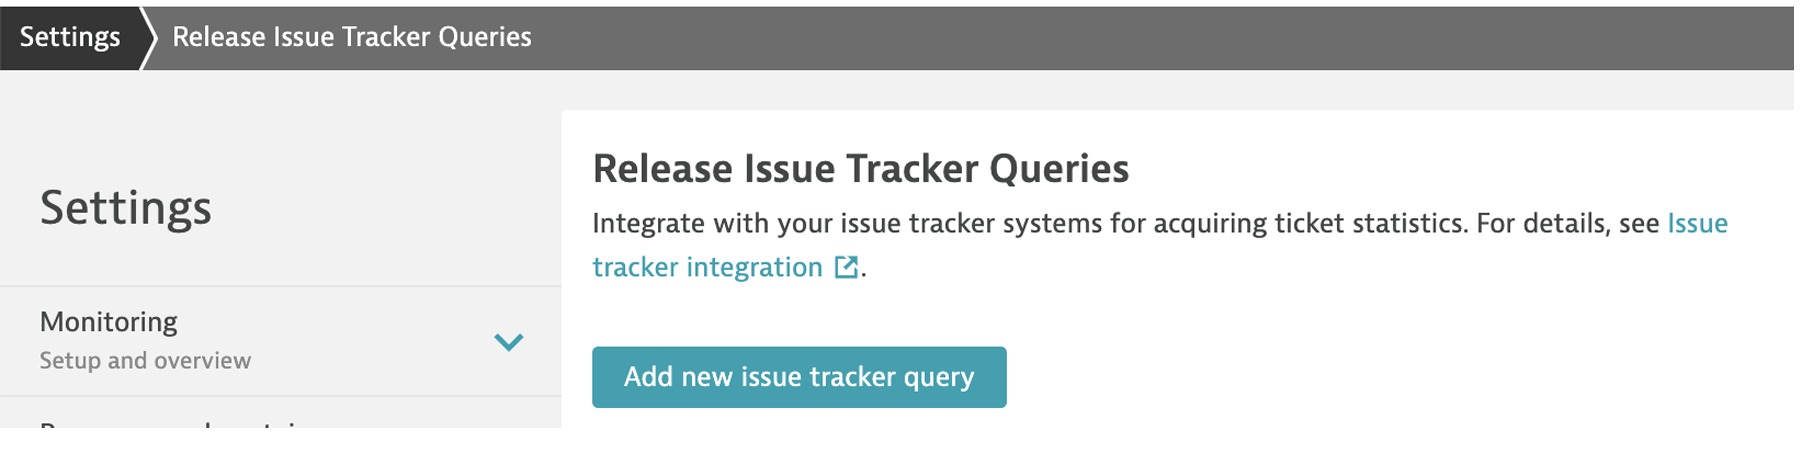
2. On the Releases page, click on the Configure button.
3. On the Release Issue Tracker Queries settings page, click the Add new issue tracker query button.
4. On the new query form, fill in the values as follows:
- Issue Label: dt-orders frontend Issues
- Issue query: project = DT AND status in (Backlog, "In Progress") AND component = frontend ORDER BY created DESC
- Issue Theme: Error
- Issue Tracker System: Jira
- URL Target: https://YOUR-COMPANY.atlassian.net
- User Name: Your Jira User ID like an email
- Password: leave blank
- Token: The Jira User Token you created earlier in this guide
5. Save the query.
Step 3: Review
1. Navigate back to the Releases page using the left side menu.
2. You should now see the new query with an issue count for any open issues.
3. If you click on the issue row, it will open Jira to review these queues.
Cleanup
1. If you are running an on-demand host for the sample application, terminate it.
2. To stop the sample application, go to the Linux Host running the sample application, navigate to the directory with the docker-compose.yaml file, and run this command to stop the application:
sudo docker-compose -f docker-compose-services.yaml down
Verify no containers are running with this command
sudo docker ps
3. In Jira, delete the project you created for this tutorial.
4. In Dynatrace, delete the API token and problem notification rule you added.
Learn more
Get the Dynatrace Problem Integration for Jira plugin on the Atlassian Marketplace.
Ask questions (and offer advice) on our Dynatrace Community.
Learn more about Dynatrace + Atlassian capabilities here.
Read more about Dynatrace + Atlassian (and how to work smarter, not harder) here.
See Atlassian, Dynatrace, and Keptn in action in this Dynatrace Performance Clinic.
See more integrations for Atlassian Open DevOps
See our other tutorial, How to integrate Dynatrace and Jira for greater observability, to learn how to set up the Jira and Dynatrace integration.
Share this article
Next Topic
Recommended reading
Bookmark these resources to learn about types of DevOps teams, or for ongoing updates about DevOps at Atlassian.

DevOps community

DevOps learning path