Try Compass for free
Improve your developer experience, catalog all services, and increase software health.
Articles
Tutorials
Interactive Guides
DevOps Monitoring
Increase awareness during each stage of the delivery pipeline

Krishna Sai
Head of Engineering, IT Solutions
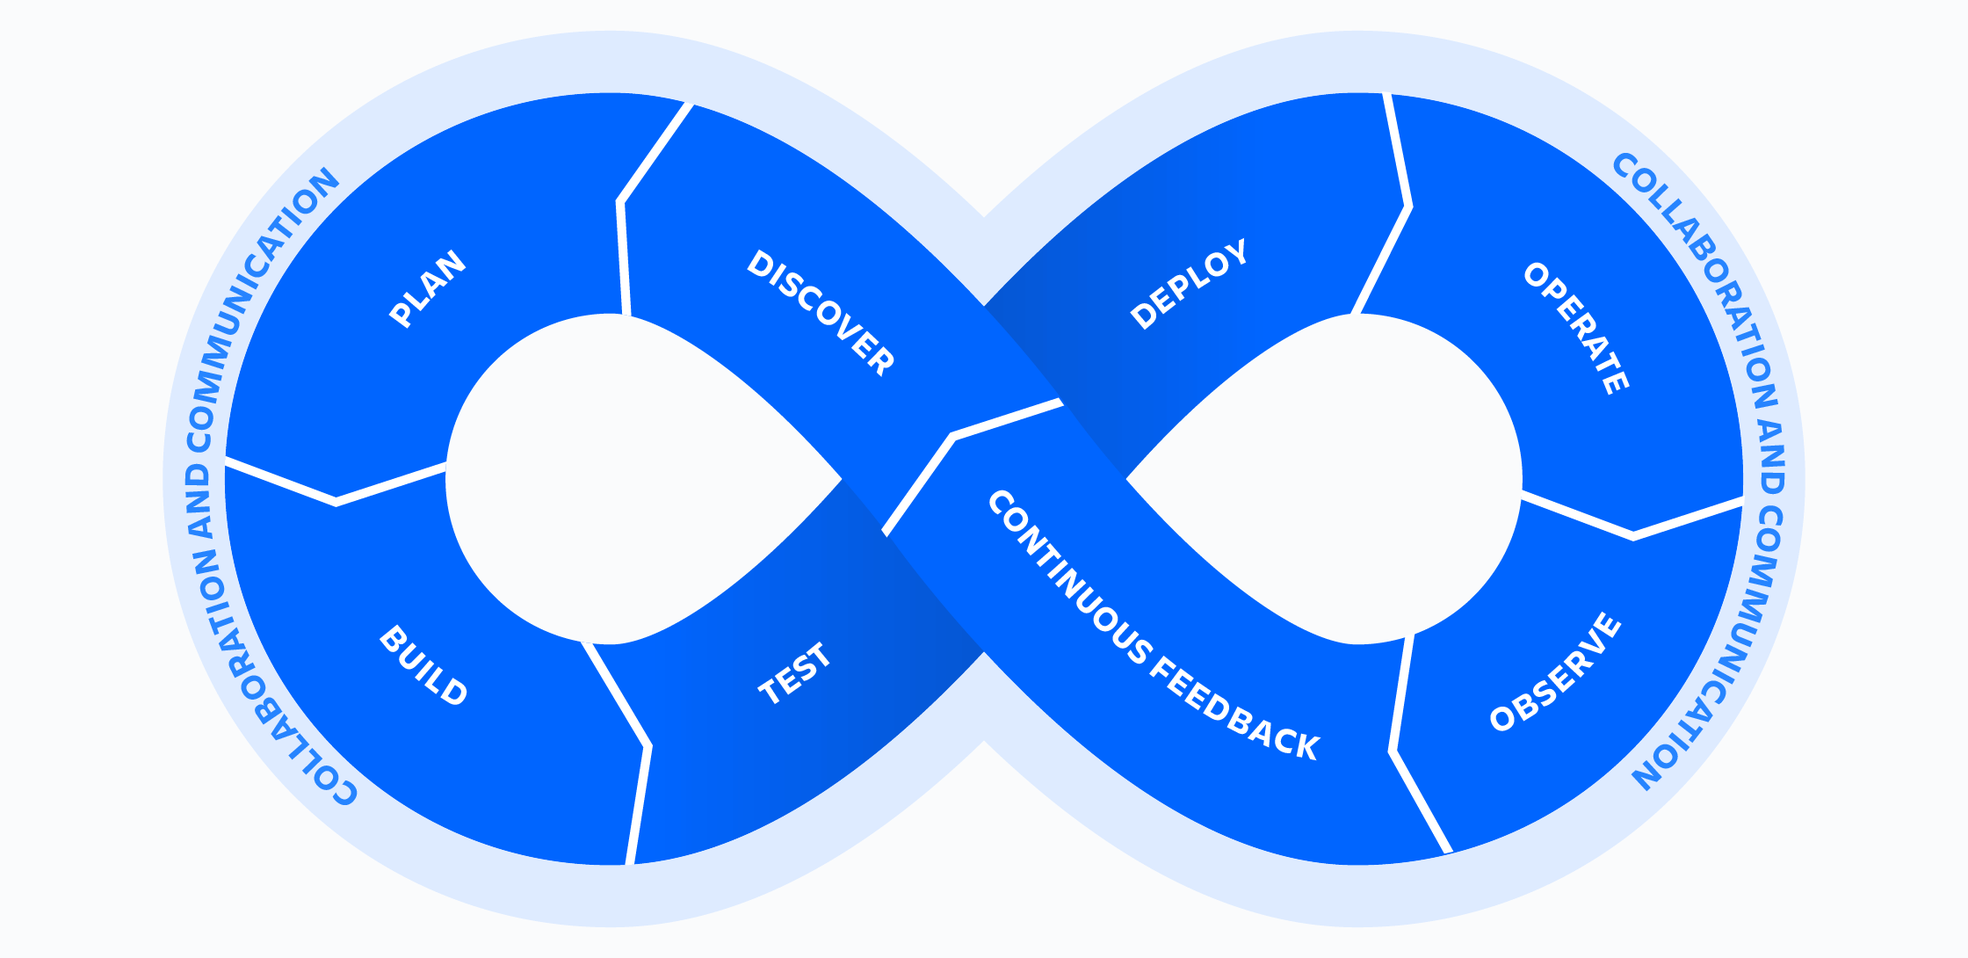
With DevOps, the expectation is to develop faster, test regularly, and release more frequently, all while improving quality and cutting costs. To help achieve this, DevOps monitoring tools provide automation and expanded measurement and visibility throughout the entire development lifecycle -- from planning, development, integration and testing, deployment, and operations.
The modern software development life cycle is faster than ever, with multiple development and testing stages happening simultaneously. This has spawned DevOps, a shift from siloed teams who perform development, testing, and operations functions into a unified team who performs all functions and embraces “you build it, you run it” (YBIYRI).
With frequent code changes now commonplace, development teams need DevOps monitoring, which provides a comprehensive and real-time view of the production environment.
What is DevOps Monitoring?

DevOps monitoring entails overseeing the entire development process from planning, development, integration and testing, deployment, and operations. It involves a complete and real-time view of the status of applications, services, and infrastructure in the production environment. Features such as real-time streaming, historical replay, and visualizations are critical components of application and service monitoring.
see solution
Streamline incident management and response
related material
Learn more about DevOps tools
DevOps monitoring allows teams to respond to any degradation in the customer experience, quickly and automatically. More importantly, it allows teams to “shift left” to earlier stages in development and minimize broken production changes. An example is better instrumentation of software to detect and respond to errors, both manually through on-call and also automatically whenever possible.
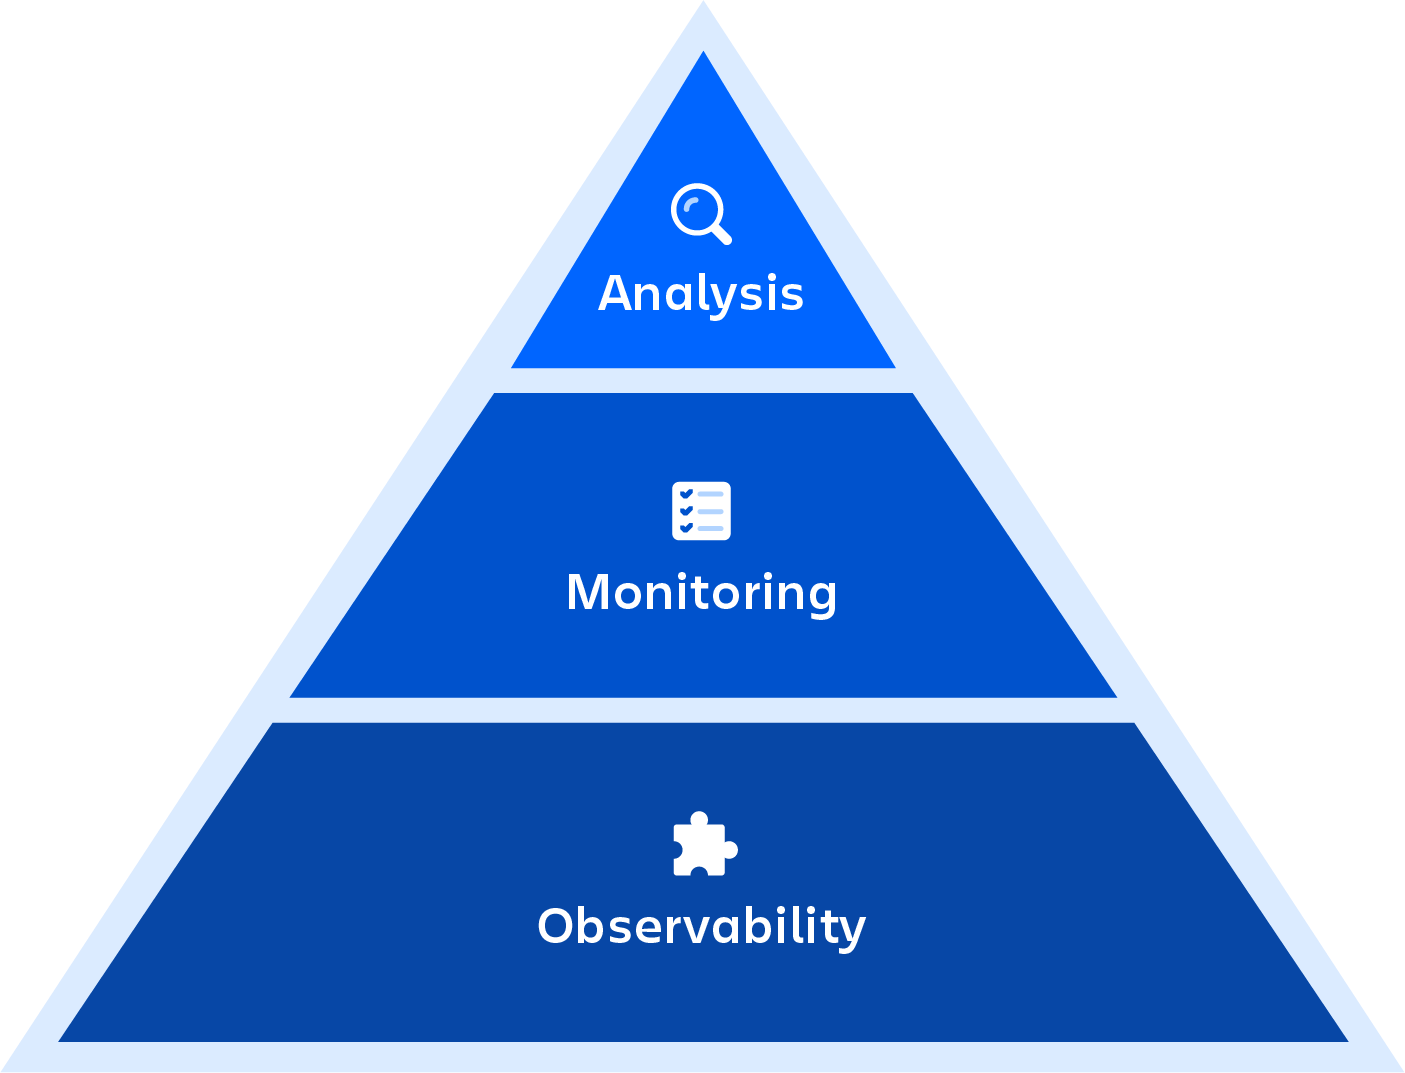
DevOps monitoring vs. observability
When you consider the left-hand side of the infinity loop as the product side and the right-hand side as the operation side, the product manager who pushes a new feature into production is interested in seeing how the project breaks up into tasks and user stories. The developer on the left side of the project needs to see how to move the feature into production including project tickets, users stories, and dependencies. If developers adhere to the DevOps principle of “you build it, you run it”, they are also interested in incident remediation.
Moving to the operations side of the life cycle, the site reliability engineer needs to understand the services that can be measured and monitored, so if there's a problem, it can be fixed. If you don’t have a DevOps toolchain that ties all these processes together, you have a messy, uncorrelated, chaotic environment. If you have a well-integrated toolchain, you can get better context into what is going on.

The importance of DevOps monitoring
A DevOps approach extends continuous monitoring into the staging, testing, even development environments. There are numerous reasons for this.
Frequent code changes demand visibility
The frequent code changes driven by continuous integration and deployment have increased the pace of change and made production environments increasingly complex. With microservices and micro front-ends entering modern cloud native environments, there are hundreds and sometimes thousands of different workloads operating in production, each with different operational requirements of scale, latency, redundancy, and security.
This has pushed the need for greater visibility. Teams need to not only detect and respond to a degraded customer experience, but do so in a time-critical manner.
Automated collaboration
DevOps implicitly requires unlocking greater collaboration between development, operations and business functions in teams. Yet collaboration can be stymied by a lack of integration between tools, which results in challenges of coordinating with different teams, which was a key takeaway from Atlassian’s DevOps survey.
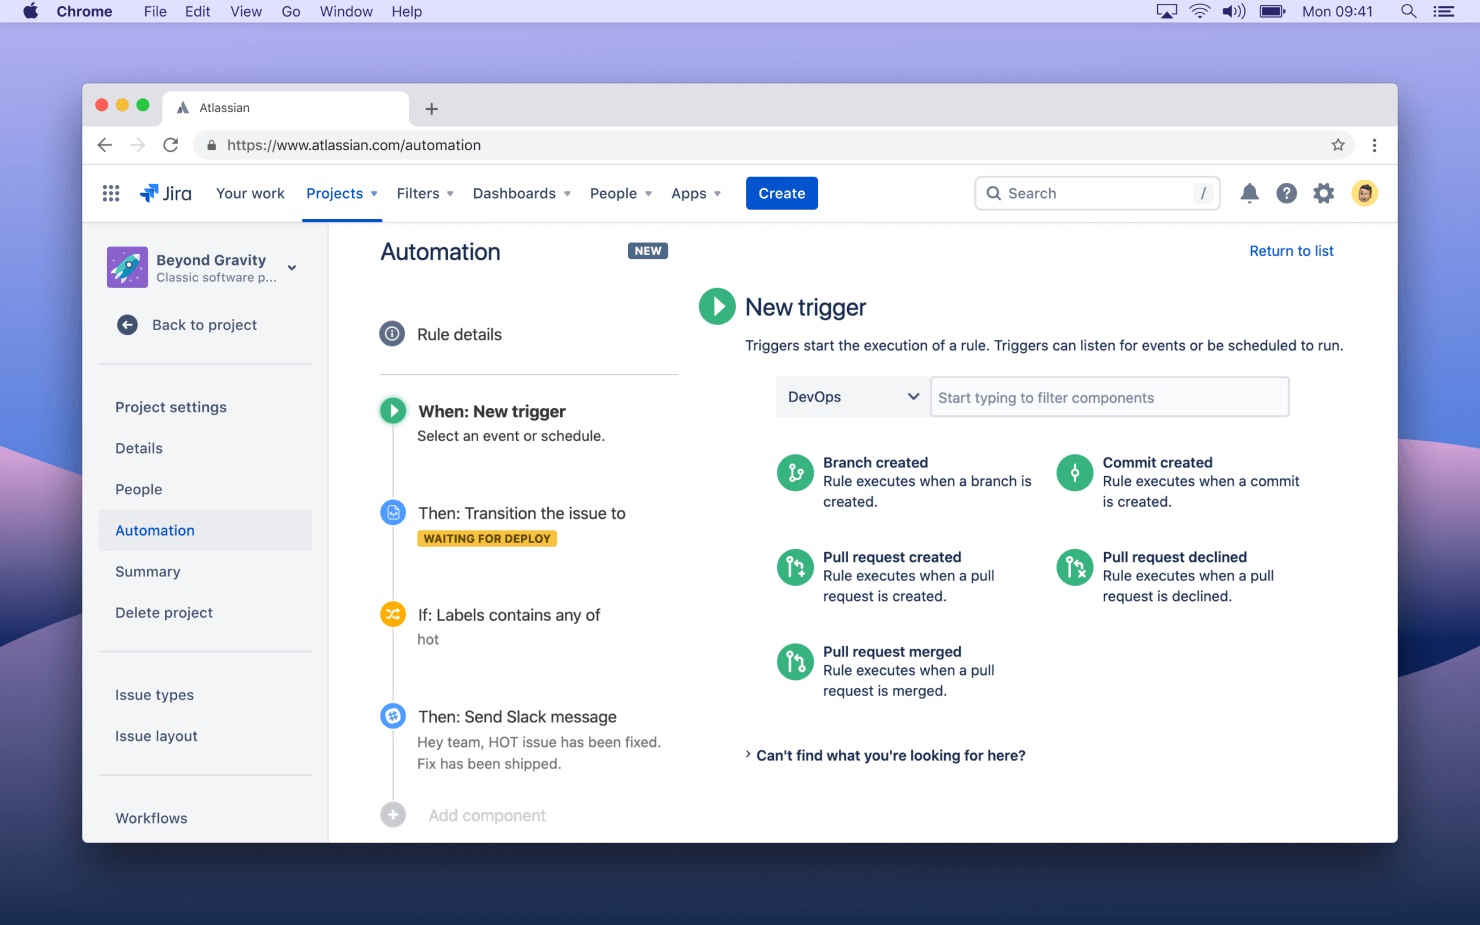
You can automate collaboration through such practices as getting a complete view of the dev pipeline inside the editor. Also, set automation rules that listen to commits or pull requests then update the status of related Jira issues and send messages to the team’s Slack channel. Plus, take advantage of insights that provide scanning, testing, and analysis reports.

Experimentation
The need to optimize products to respond to customer needs, driven by personalization and optimized conversion funnels, leads to constant experimentation. Production environments can run hundreds of experiments and feature flags, which makes it challenging for monitoring systems to communicate the cause of a degraded experience.
The increasing requirements for always-on services and applications, as well as stringent SLA commitments, can add vulnerability to applications. Development teams need to ensure they define service-level objectives (SLOs) and service-level indicators (SLI) that are monitored and acted on.
Change management
Since most production outages are caused by changes, change management is essential, especially for mission-critical applications, such as those in the financial and healthcare industries. Risks associated with changes need to be determined and approval flows need to be automated based on the risk of the change.
Dealing with these complexities requires a comprehensive understanding and monitoring strategy. This entails defining and embracing monitoring practices and having a set of rich, flexible, and advanced monitoring tools that are critical to the development processes.
Dependent system monitoring
Distributed systems have become more common, often composed of many smaller, cross-company services. Teams now need to not only monitor the systems they build, but monitor and manage the performance and availability of dependent systems. Amazon Web Services (AWS) offers more than 175 products and services including computing, storage, networking, database, analytics, deployment, management, mobile, and developer tools. If you build your application on AWS, you need to ensure you pick the right service for the needs of your application. You also need instrumentation and strategies to trace errors in a distributed manner and handle failures of dependent systems.
Key capabilities of DevOps monitoring
In keeping with the DevOps tradition, developing and implementing a monitoring strategy also requires attention to core practices and a set of tools.
Shift-left testing
Shift-left testing that is performed earlier in the life cycle helps to increase quality, shorten test cycles, and reduce errors. For DevOps teams, it is important to extend shift-left testing practices to monitor the health of pre-production environments. This ensures that monitoring is implemented early and often, in order to maintain continuity through production and the quality of monitoring alerts are preserved. Testing and monitoring should work together, with early monitoring helping to assess the behavior of the application through key user journeys and transactions. This also helps to identify performance and availability deviations before production deployment.
Alert and incident management
In a cloud-native world incidents are as much a fact of life as bugs in code. These incidents include hardware and network failures, misconfiguration, resource exhaustion, data inconsistencies, and software bugs. DevOps teams should embrace incidents and have high-quality monitors in place to respond to them.
Some of the best practices to help with this are:
- Build a culture of collaboration, where monitoring is used during development along with feature/functionality and automated tests
- During development, build appropriate, high-quality alerts in the code that minimize mean time to detect (MTTD) and mean time to isolate (MTTI)
- Build monitors to ensure dependent services operate as expected
- Allocate time to build required dashboards and train team members to use them
- Plan “war games” for the service to ensure monitors operate as expected and catch missing monitors
- During sprints, plan to close actions from previous incident reviews, especially actions related to building missing monitors and automation
- Build detectors for security (upgrades/patches/rolling credentials)
- Cultivate a “measure and monitor everything” mindset with automation determining the response to detected alerts
DevOps monitoring tools
Complementing a set of healthy monitoring practices are advanced tools that align with the DevOps/YBIYRI culture. This requires attention to identifying and implementing monitoring tools, in addition to the well understood developer tools of code repositories, IDEs, debuggers, defect tracking, continuous integration tools and deployment tools.
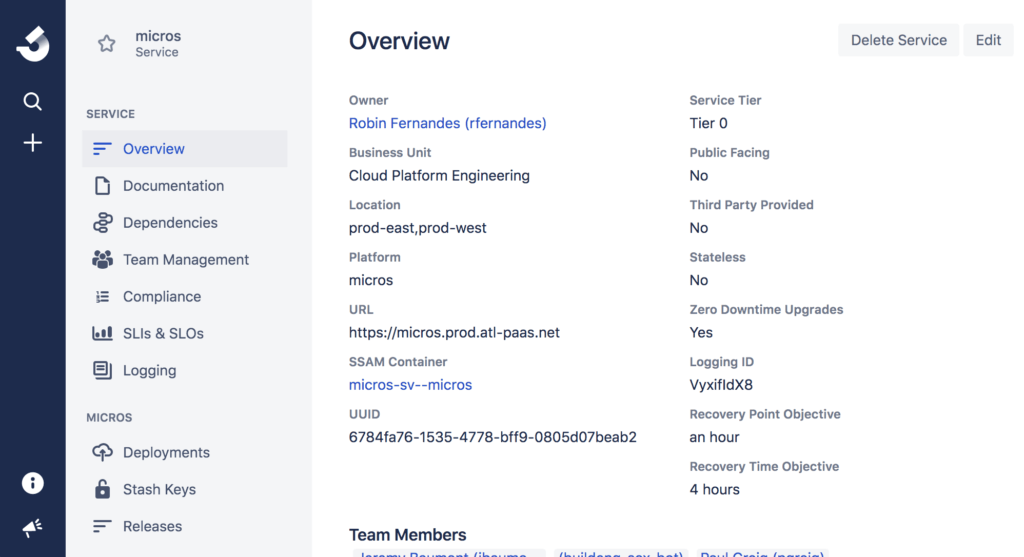
A single pane of glass provides a comprehensive view of the various applications, services, and infrastructure dependencies, not only in production but also in staging. This gives the ability to provision, ingest, tag, view, and analyze the health of complex distributed environments. For example, Atlassian’s internal PaaS tool Micros includes a tool called microscope that provides all the information about services in a concise, discoverable manner.

Application performance monitoring is essential to ensure that the application-specific performance indicators such as time to load a page, latencies of downstream services, or transitions are monitored in addition to basis system metrics such as CPU and memory utilization. Tools such as SignalFX and NewRelic are great for observing metrics data in real time.
Implement different types of monitors including for errors, transactions, synthetic, heartbeats, alarms, infrastructure, capacity, and security during development. Be sure that every member is trained in these areas. These monitors are often application-specific and need to be implemented based on the requirements of each application. For example, our Opsgenie development team implements synthetic monitors that create an alert or incident and check if the alert flow is executed as expected (i.e if integrations, routing, and policies work correctly). We also implement synthetic monitors for infrastructure dependencies that verify the functionality of various AWS services periodically.
An alert and incident management system that seamlessly integrates with your team’s tools (log management, crash reporting, etc.) so it naturally fits into your team’s development and operational rhythm. The tool should send important alerts delivered to your preferred notification channel(s) with the lowest latencies. It should also include the ability to group alerts to filter numerous alerts, especially when several alerts are generated from a single error or failure. At Atlassian, we not only offer Opsgenie as a product that provides these capabilities to our customers, but also use it internally to ensure that we have a robust, flexible, and reliable alert and incident management system integrated with our development practices.
In conclusion...
While embracing DevOps, it is important to ensure that monitoring shifts left in addition to testing, and the practices and tools are put in place to deliver the promise of delivering changes fast into production with high quality.
For more information, check out these additional resources from Atlassian on DevOps, incident management, and change management.
Share this article
Next Topic
Recommended reading
Bookmark these resources to learn about types of DevOps teams, or for ongoing updates about DevOps at Atlassian.

DevOps community

DevOps learning path
