Atlassian Analytics Overview
Visualize data across your Atlassian toolchain for holistic insights.

Atlassian Analytics for Cloud Enterprise
Atlassian Analytics is available for Cloud Enterprise customers of Jira, Jira Service Management, or Confluence.

Want access to Atlassian Analytics?

Already on Cloud Enterprise?
Why use Atlassian Analytics?
Speed up decision-making at all levels across your DevOps, Agile, IT service management, and business teams with Jira, Jira Service Management (including Assets and operations data), Jira Align, and Confluence data in Atlassian Analytics.
Screenshot of value stream flow metrics
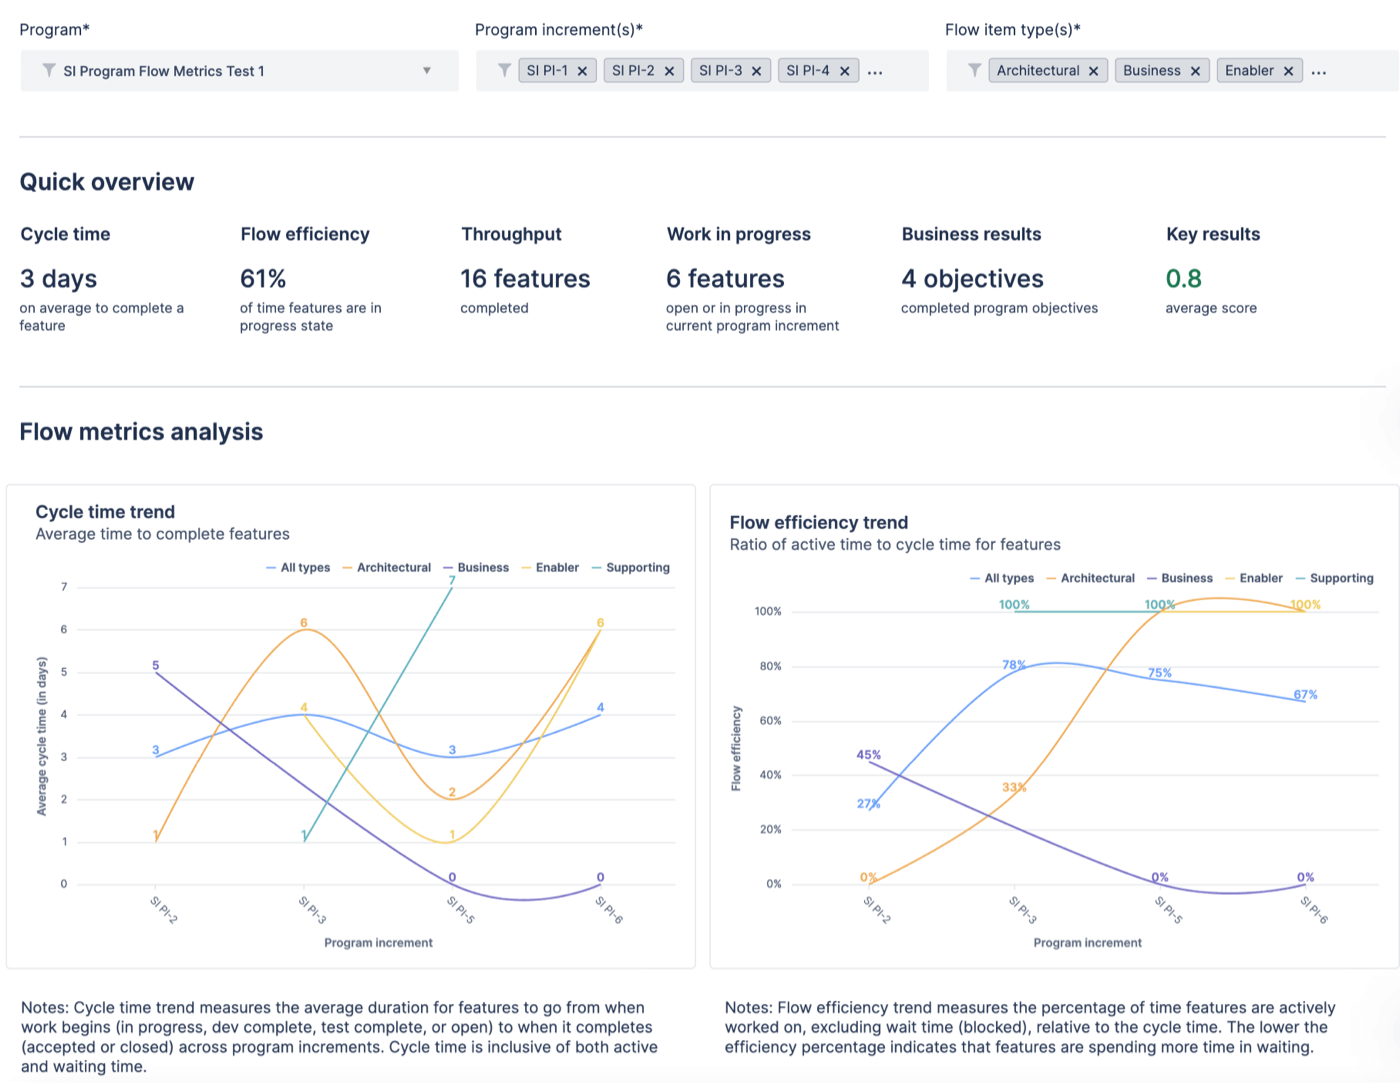
Scaled Agile teams
Analyze program and portfolio metrics that measure organizational effectiveness.
- Use the Flow Metrics dashboards to track OKR pacing and continuously refine your strategy
- Directly access Jira Align program-level data using the Atlassian ecosystem, meaning no more clunky API connections
- Analyze portfolio budget and spend metrics to make critical prioritization, trade-off, and funding decisions
-
Monitor the health and status of epics to track At Risk and On Track project areas
DevOps
Understand how your development cycle is delivering value to your customers.
- Understand the net flow of work and the team’s focus on committed work items
- Measure the ratio of defects and bugs to the total work items completed in a given time period
- Track lead time, cycle time, and the distribution of work completed with Flow Analytics
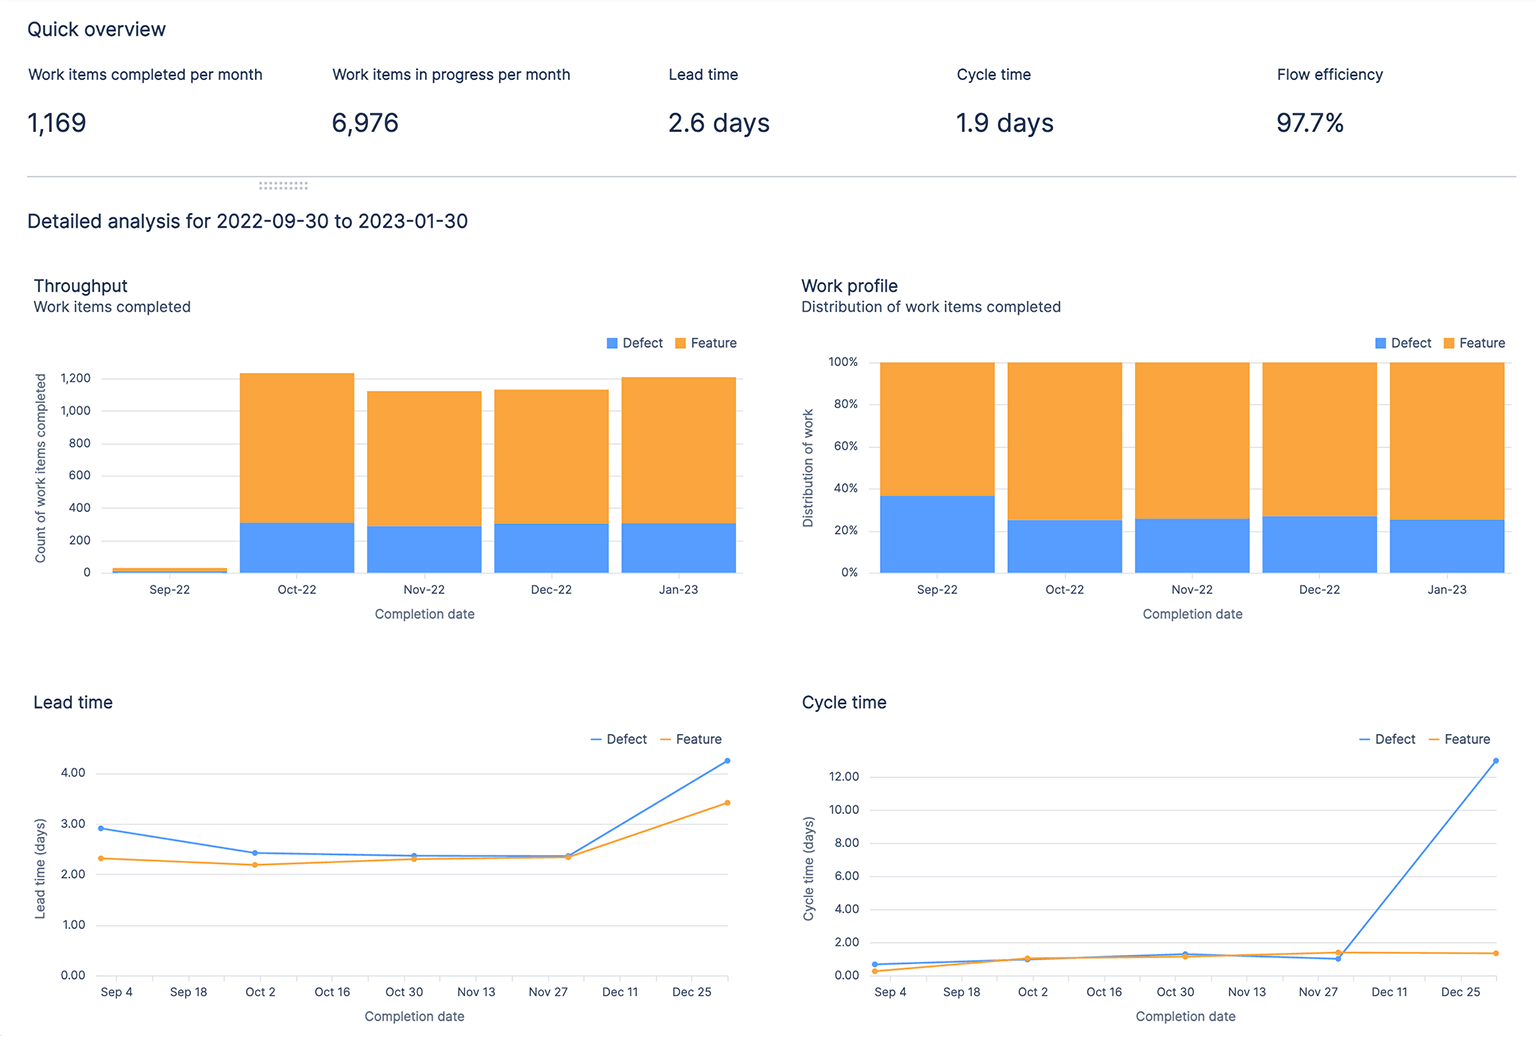
Screenshot of a flow analytics dashboard
Proactively identify potential blockers across projects in your development cycle.
- View the impact of work at the project and organization level
- Monitor work and project status by age, assignee, and priority
- Easily track risks, status, priority, and time-to-resolution
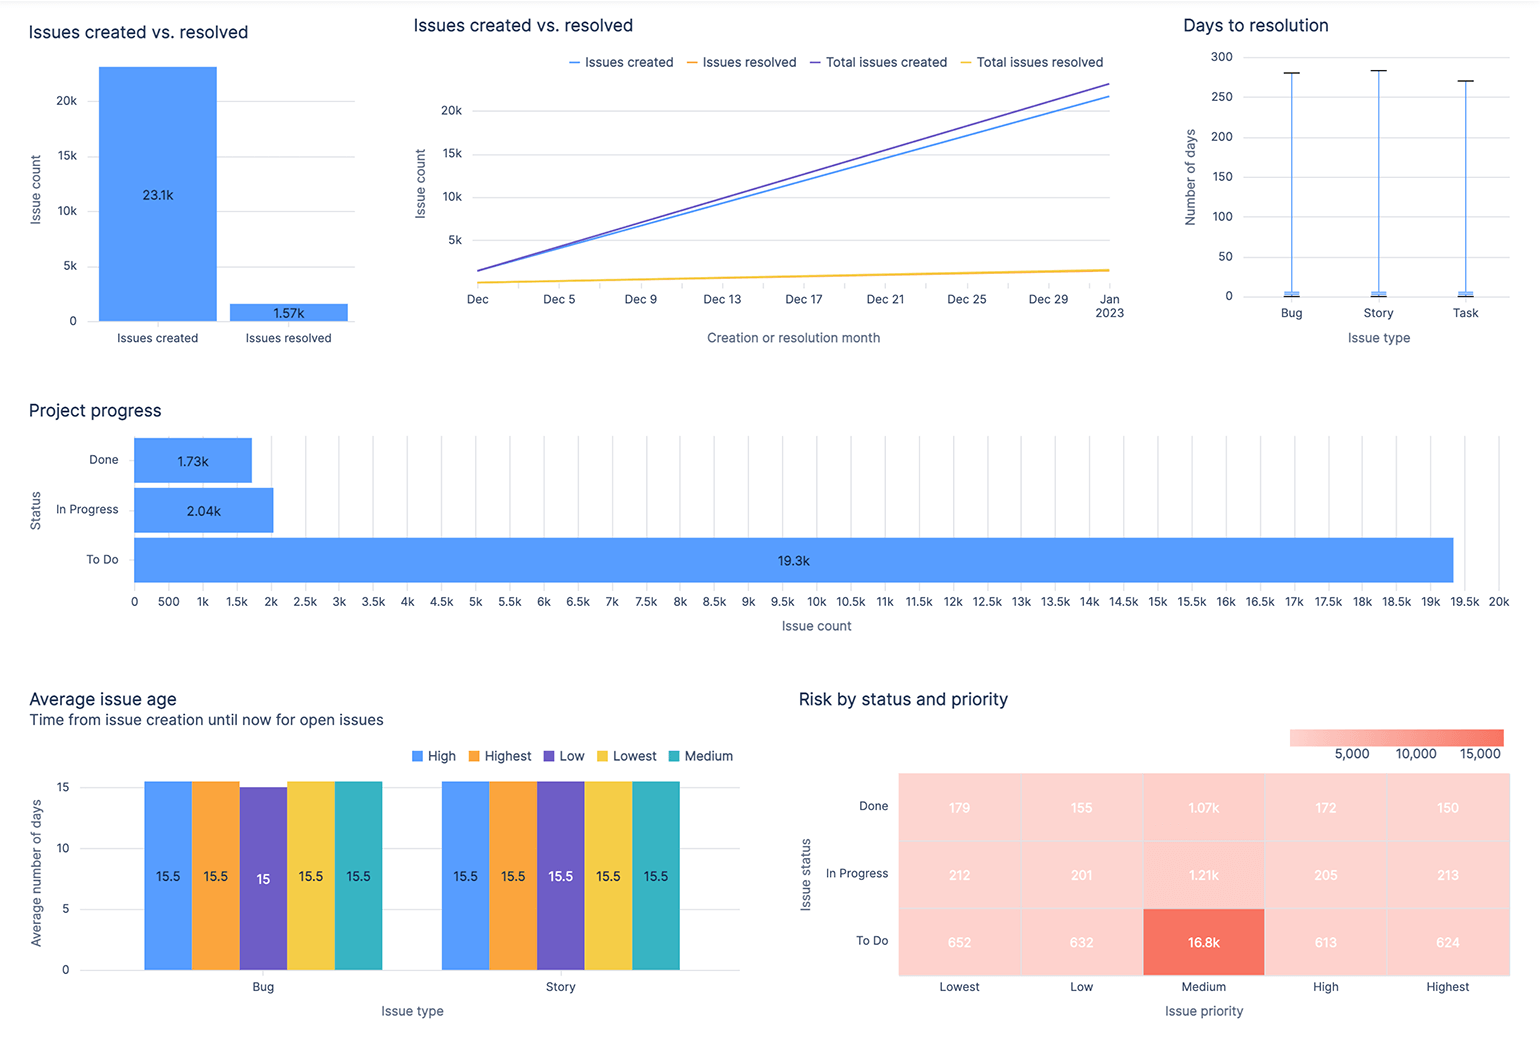
Screenshot of a Jira project overview dashboard
IT Service Management
Monitor and alleviate service blockers that are impacting time-to-value for your customers. Track key metrics across change, incident, and request management.
- Track open requests, agent workload, adherence to SLAs, and customer satisfaction
- Understand trends in incident creation, responses, and resolution timelines
- Monitor trends in change request resolution over time across different change request risks, types, and services
- Analyze objects in your asset and configuration management system, their related work items and projects, as well as time spent on them
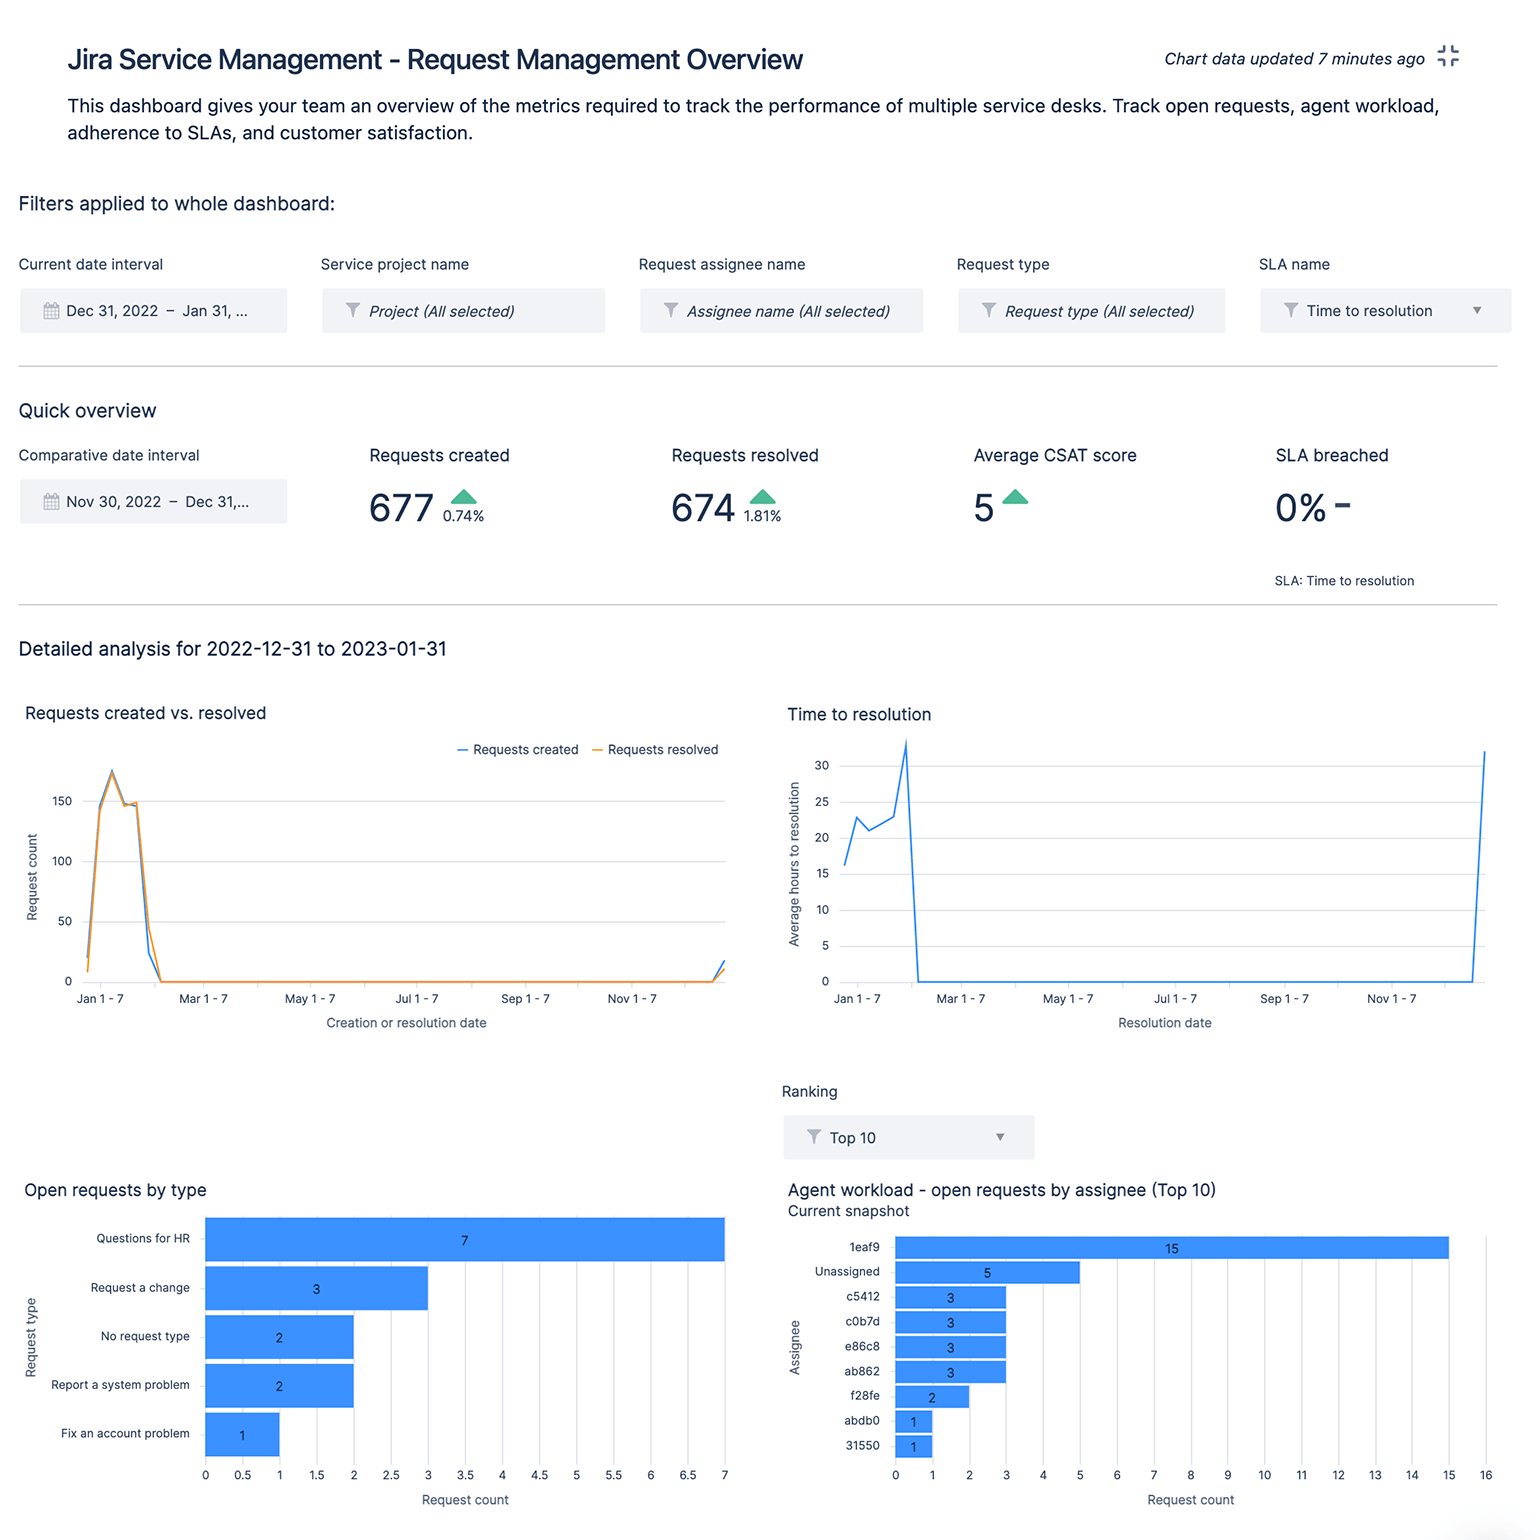
Screenshot of a request management dashboard
Marketing, HR, and revenue teams
Analyze how teams are creating and managing content across Confluence sites. Track key metrics to understand the flow and usage of spaces, pages, and more.
-
Get an aggregate view of total spaces, pages, blog posts and comments
-
Understand adoption across your content by measuring metrics by space type
-
Track status and freshness of your content by which pages have been updated recently and what their status is
-
Gain insight into what topics teams are creating content for by drilling down into the top labels across your Confluence site
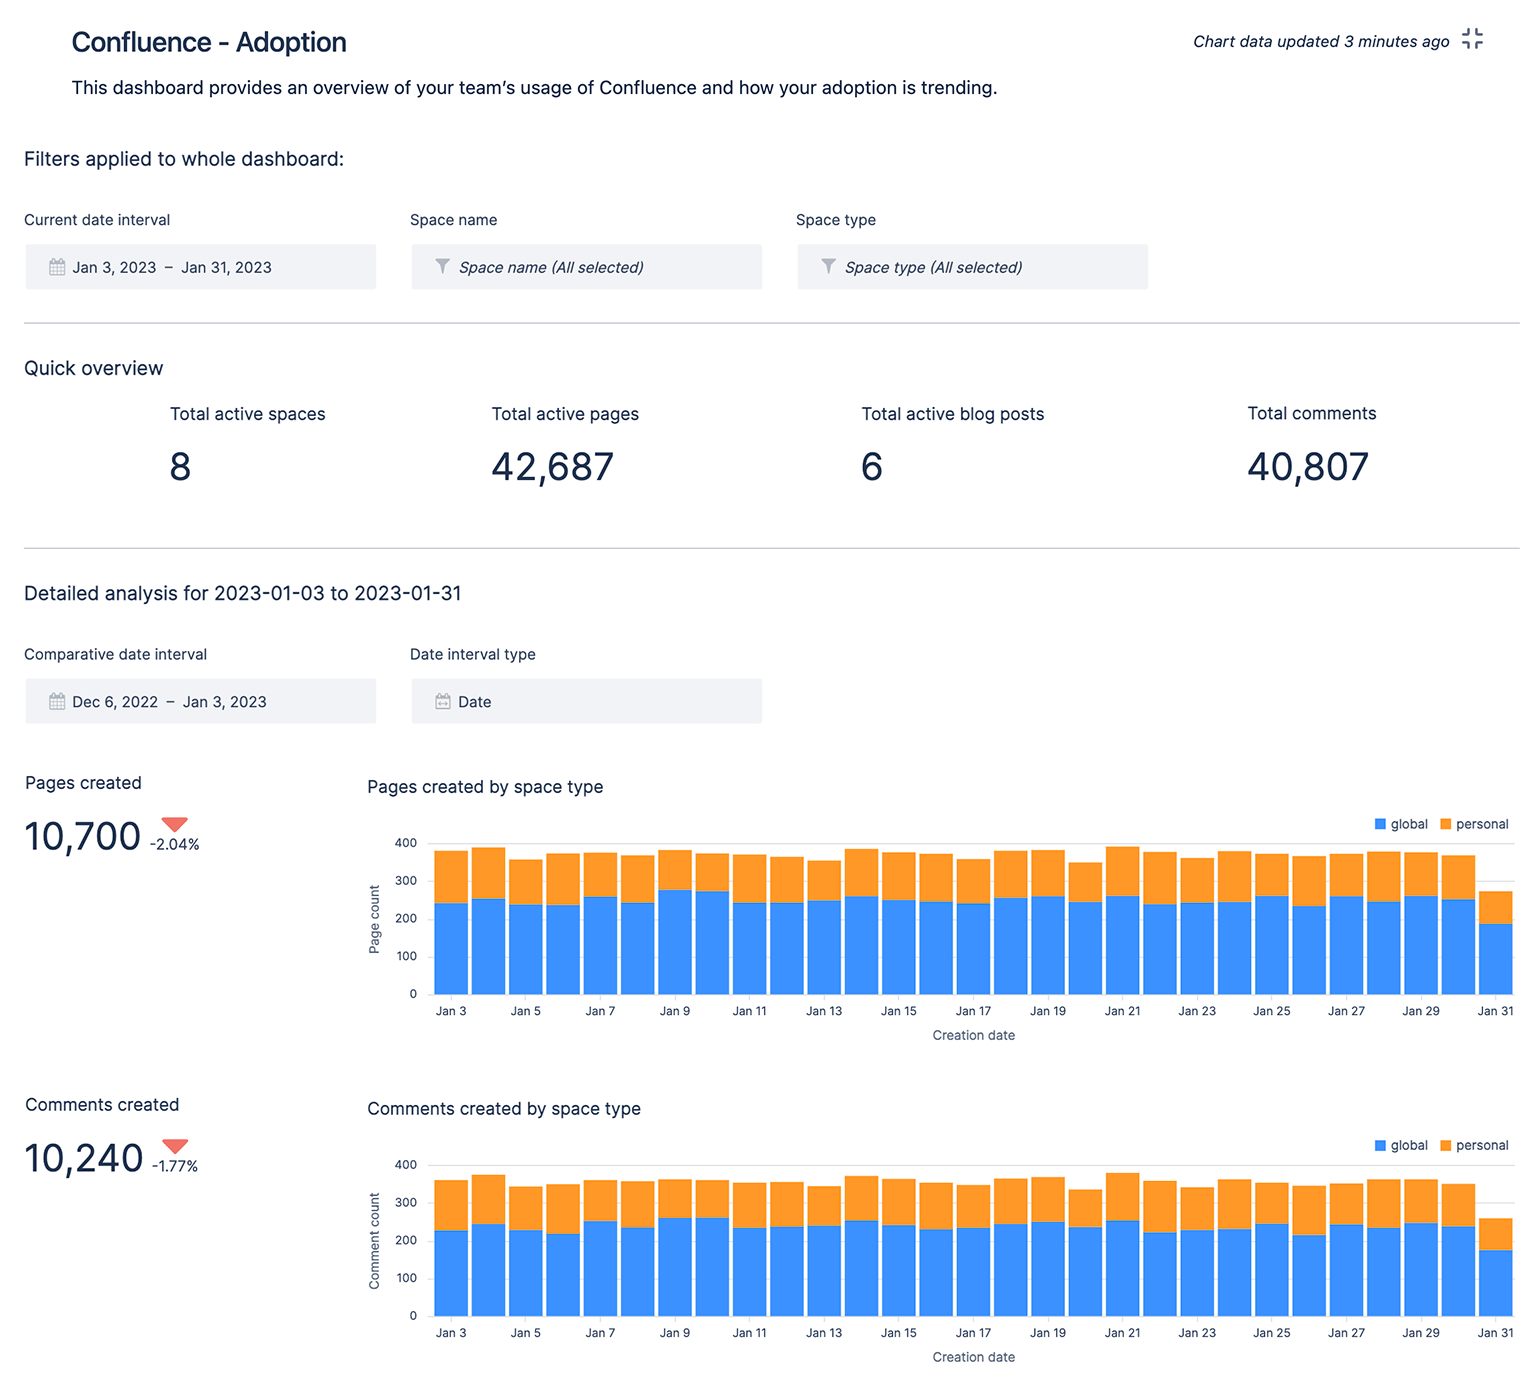
Screenshot of a Confluence adoption dashboard
How Atlassian Analytics works
Select your data sources
Atlassian Analytics seamlessly connects to the Atlassian Data Lake and lets you configure which products and instances you want to pull data from.
Select to include or exclude Jira projects, Confluence spaces, Assets, or operations data.
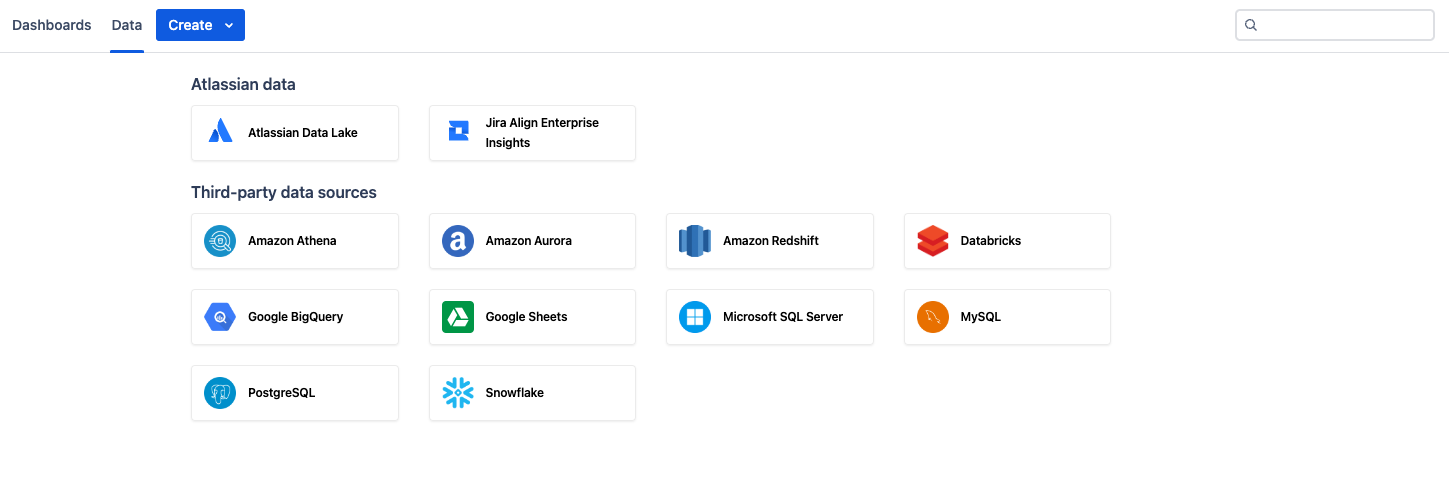
Data connections
Start with pre-built templates
You can access a number of template dashboards and charts as soon as you create a connection to one of your product instances. These templates are designed to address the common needs of business and technical teams.
- Drill down to get insights on specific project timelines and bottlenecks
- Comment and share with key stakeholders to drive action
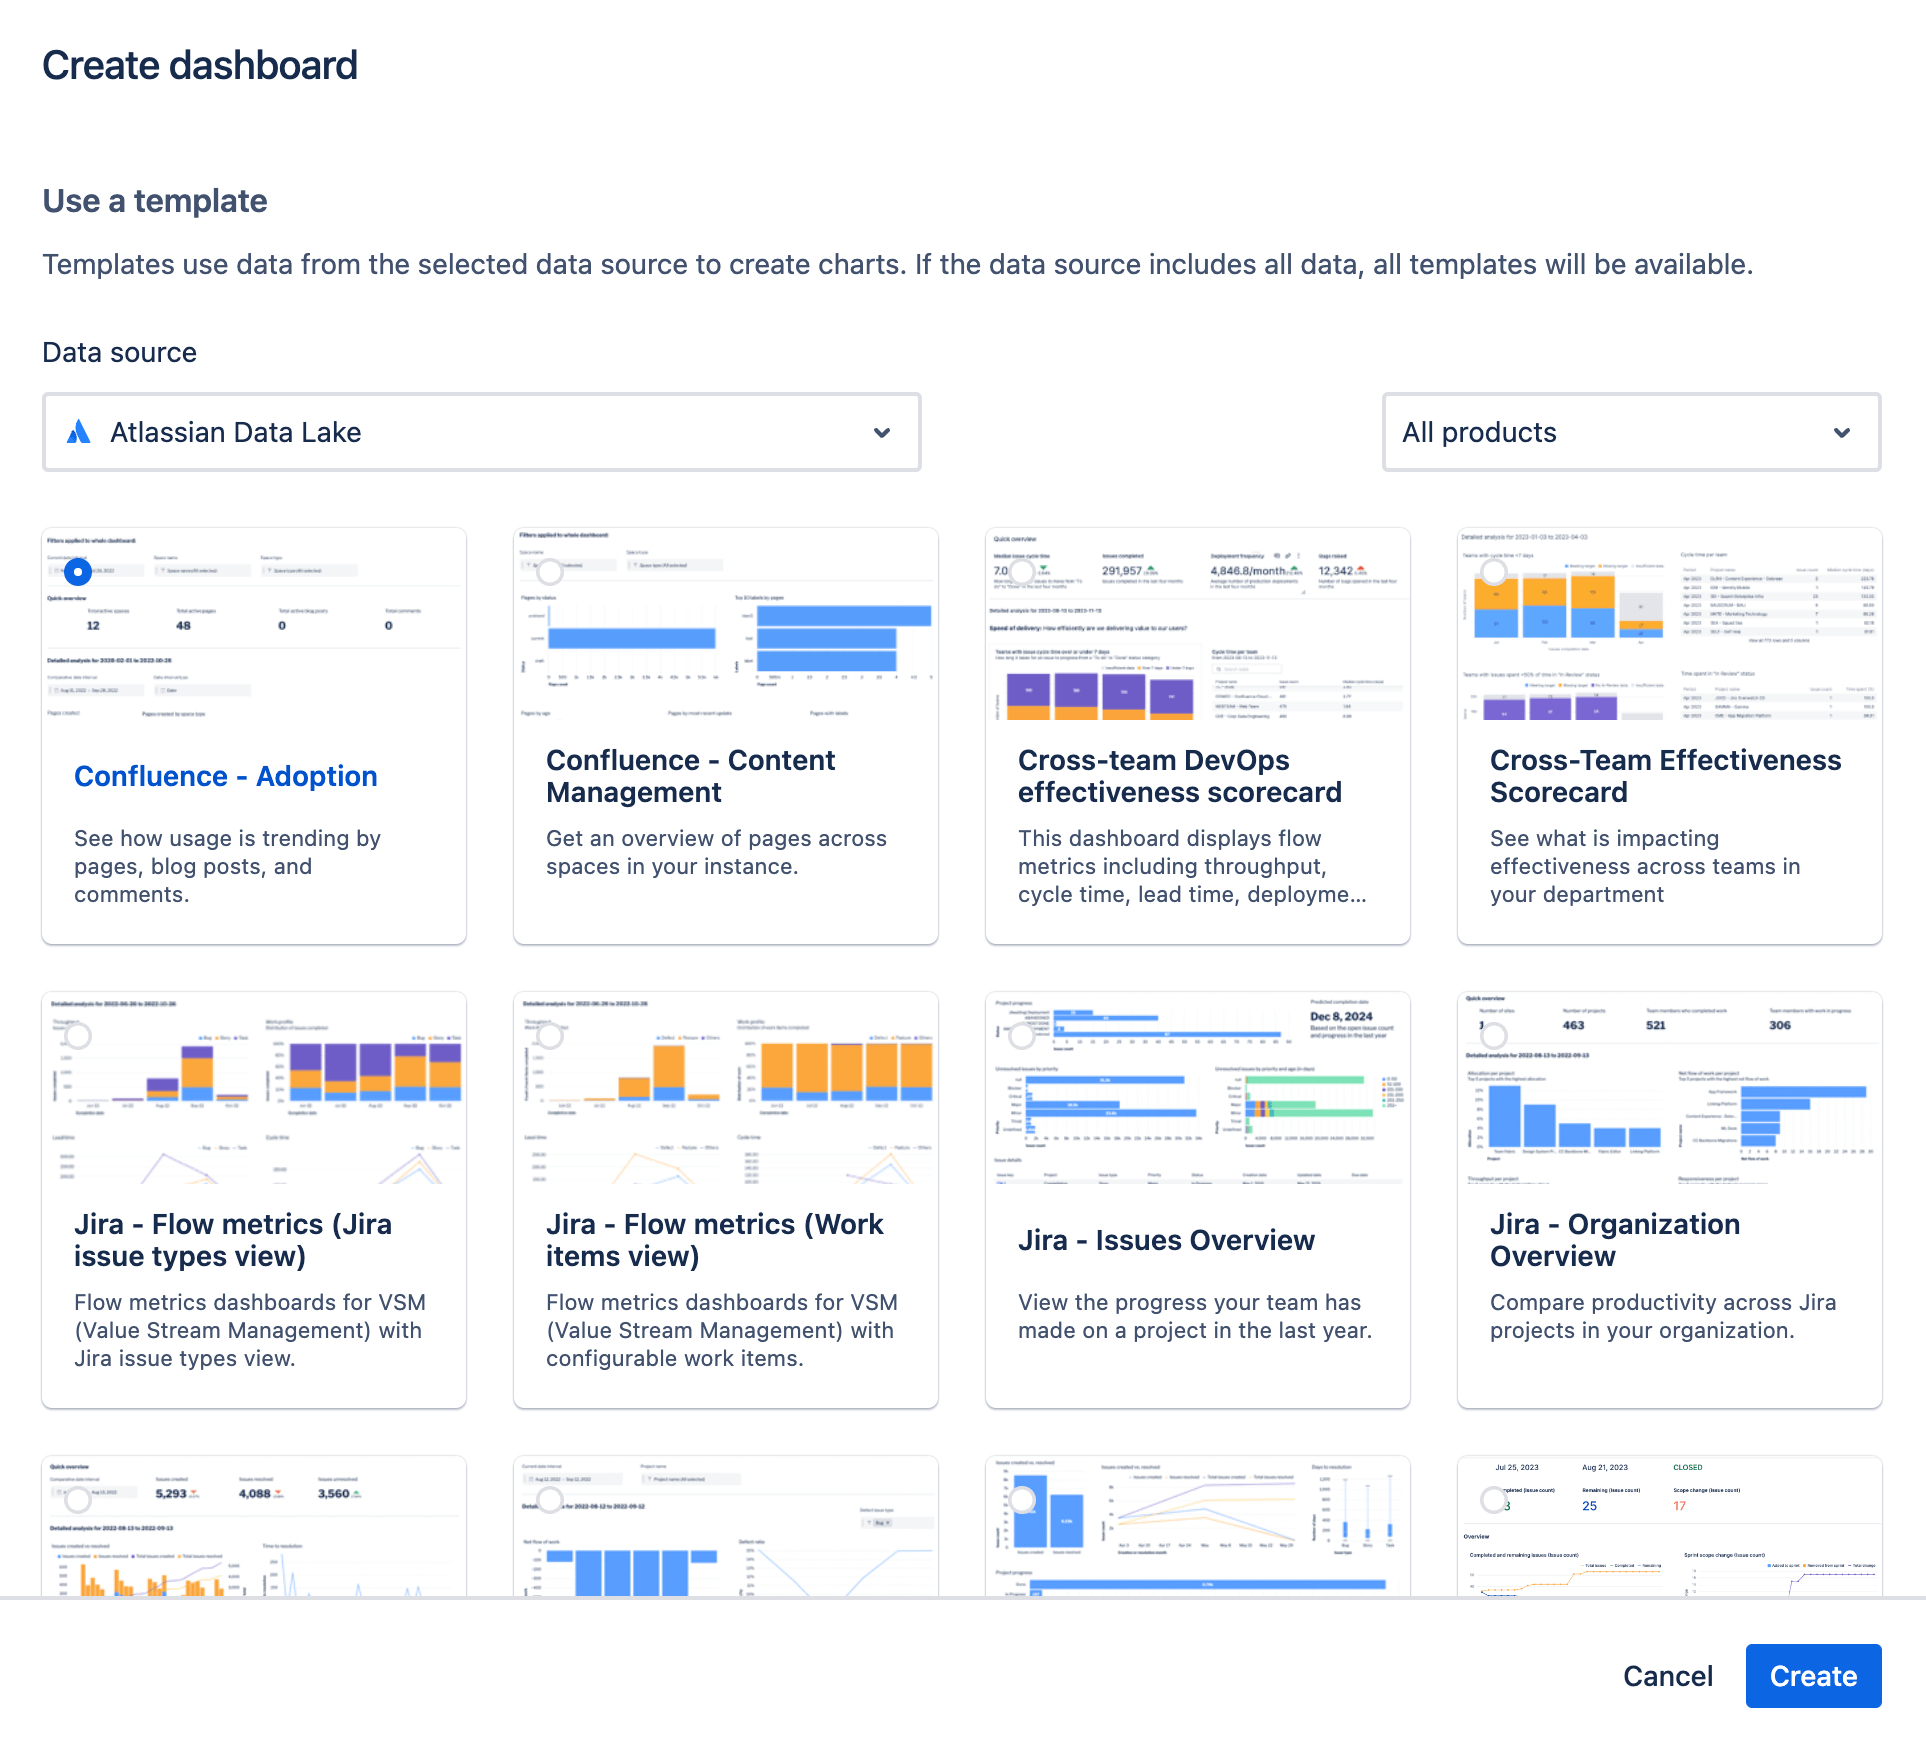
Screenshot of template dashboards available in Atlassian Analytics
Run SQL your way
Build custom views across products or instances with the ability to run SQL queries directly against the Atlassian Data Lake. Users who may not be familiar with SQL can use visual query mode - a no-code way to build custom charts and dashboards.
Spin up new charts by adding columns and filters, with intuitive joins between your data sets. Switch over to written SQL if you want to peek under the hood and adjust your queries.
An animated screen showing how to use visual and written SQLs.
Explore multiple visualization options
Choose charts and diagrams that work best for your visualization needs. Atlassian Analytics will recommend a chart type based on the shape of your queried and transformed data.
An animated screen shows chart visualization options.
Comment, download, and embed
Atlassian Analytics dashboards and charts are collaborative by nature. Users can comment on charts and tag their team with questions. Dashboards and charts can also be shared using Smart Links into Confluence pages and Jira work items to share analysis with even more teams.
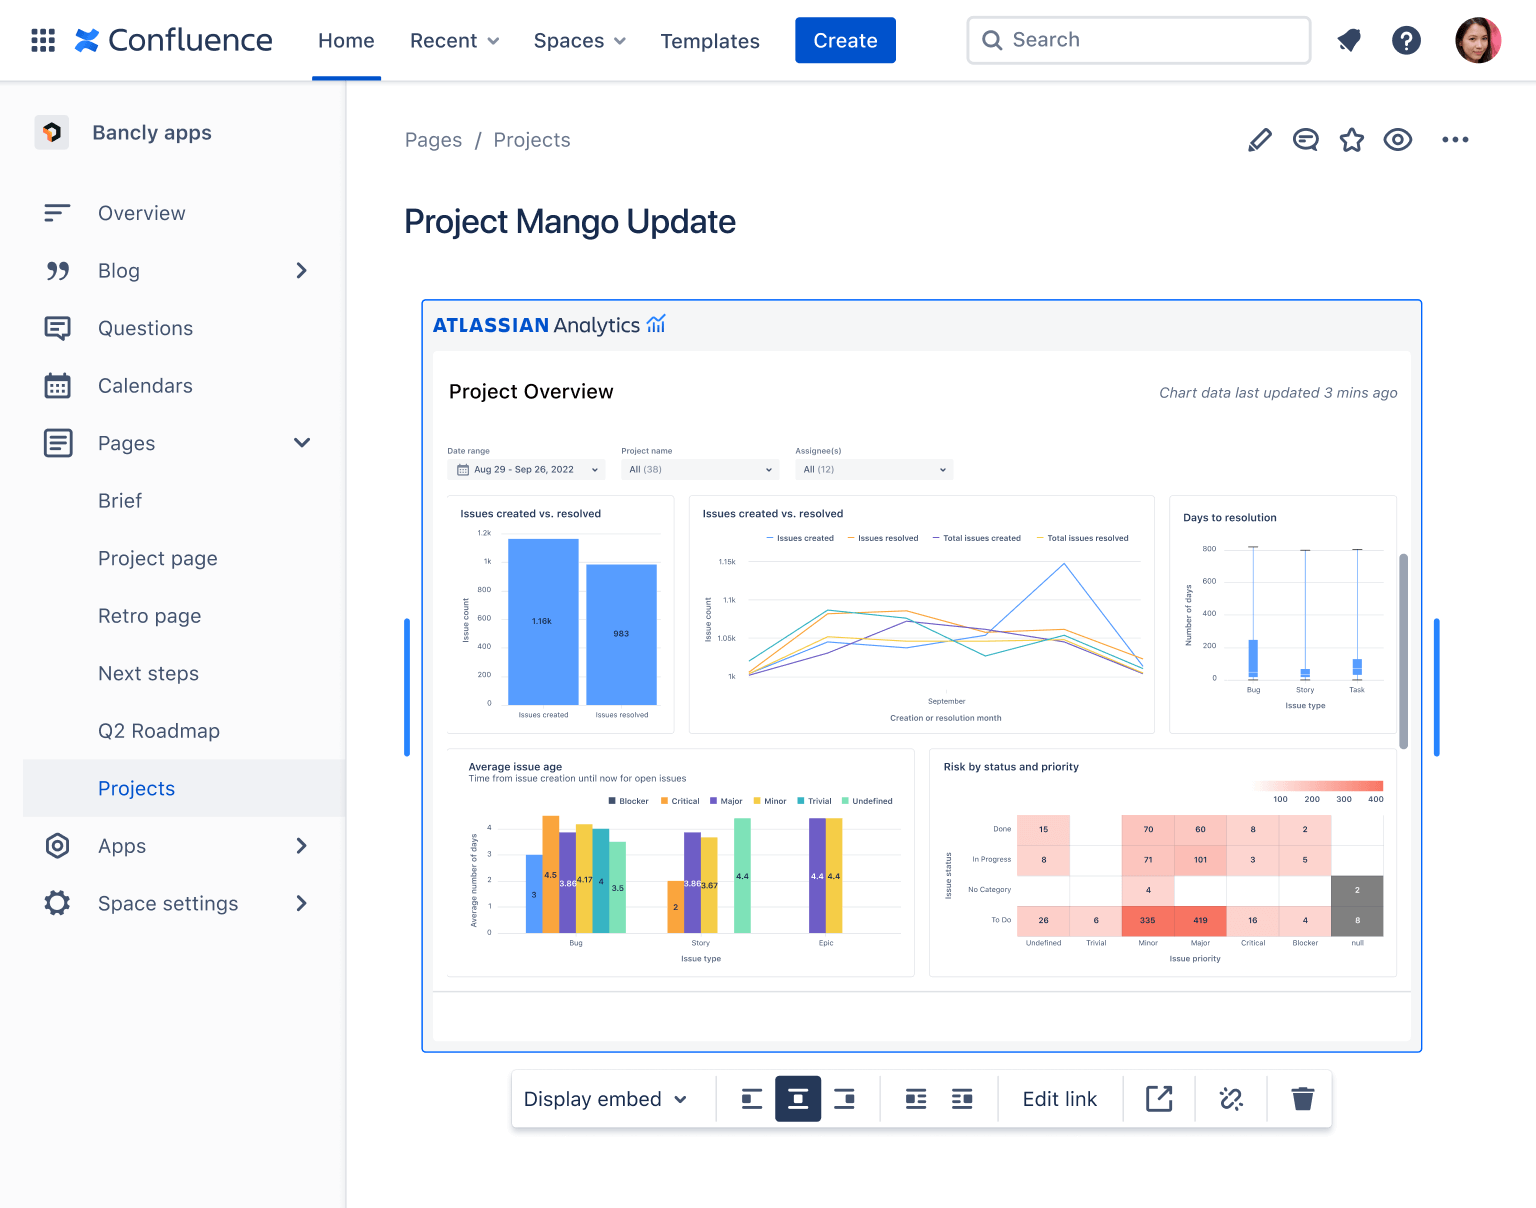
A dashboard embedded via a Smart Link into a Confluence page
Atlassian Data Lake
Learn more about including data from your Atlassian products in a single, queryable system - enriched and ready for analysis.
Ready to get started or just have questions?
Discuss Cloud Enterprise plans for access to Atlassian Analytics