Developer Experience Survey
Understand precisely what’s holding your developers back and which improvements would yield the highest value for the team.

PREP TIME
90m
Run TIME
45m
Persons
3+
5-second summary
- Select your vital signs.
- Run a developer experience survey and analyze data.
- Discuss the results and document an action plan to improve developer experience.
WHAT YOU WILL NEED
- Survey tool
- Digital collaboration tool
- Whiteboard
- Post-its
PLAY resources
How to create an effective developer experience survey
Understand precisely what’s holding your developers back and which improvements would yield the highest value for the team.
What is a developer experience survey?
Developer experience is how developers feel about, think about, and value their work. Unlike other quantitative metrics that measure the systems enabling developer productivity, experience can only be measured by asking people qualitative questions about their feelings. Surveys are an effective way to gather sentiment data about the developer experience.
At Atlassian, we believe the most effective approach to measuring developer productivity is to use a combination of quantitative and qualitative data. This combination gives us a more contextual understanding of the friction faced by developers.
Why run the developer experience survey play?
Asking developers how satisfied they are with their ability to be productive within their codebases, the tools they use, and the overall software development lifecycle (SDLC) provides tremendous insights and acts as a means to measure overall progress in improving the day-to-day life of the developer.
You can use this data to identify bottlenecks and prioritize improvements to the developer experience.
When should you run a developer experience survey play?
We recommend running the Developer Experience Survey Play at least twice each year if you are happy with your success metrics but need to maintain a pulse on vital signs, or quarterly if you are actively working on improving your developer experience.
5 benefits of a developer experience survey play
- Surveys allow us to measure things that are otherwise unmeasurable.
- Survey data provides missing context for quantitative vital signs.
- Running the survey on a semi-annual or quarterly basis enables you to track improvements over time.
- Surveys provide an opportunity for input directly from each engineer making them feel heard.
- Creating rituals around the survey provides an opportunity for teams to discuss the developer experience at least 4 times a year (culture impact).
1. Select your vital signs
Est. time: 30 MIN
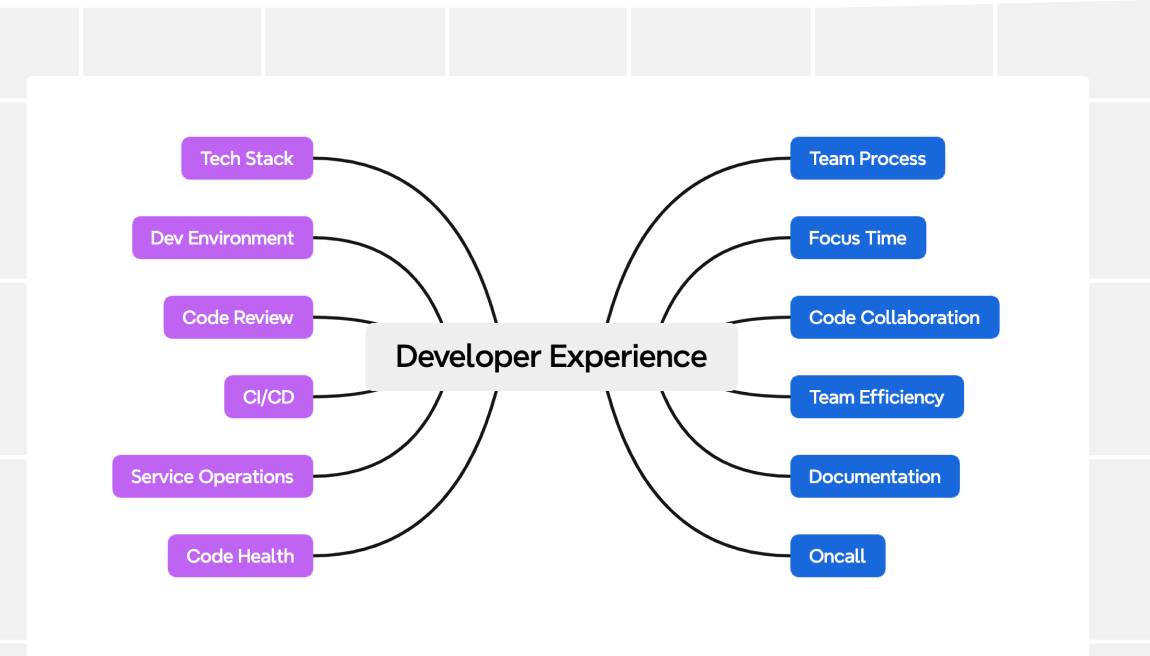
To truly understand your team’s developer experience, you need to ask the right questions. At Atlassian, we focus our questions on key vital signs that help us uncover pain points within the developer experience. Vital signs are data points that act as engineering health indicators. Much like your body’s vital signs, they can quickly identify problems in the system.
Vital signs are a crucial component of this entire Play, so before you begin, come to an agreement with your team about which vital signs are important to your operations. We recommend including six to eight vital signs in your own organization-specific survey.
Incorporate our vital signs into your organization-specific survey, or use ours for inspiration and create your own. If a vital sign doesn’t apply, you can remove it from the survey in step two. When in doubt about a vital sign’s relevance, we suggest leaving it in until you’ve run the Play at least once.
2. Run developer experience survey
Est. time: 60 MIN
After you’ve chosen or created vital signs that apply to the developers on your team, develop relevant survey questions that capture the experience across the SDLC. Spend time upfront on survey design, and consider conducting usability testing to ensure the questions are capturing the intended signals.
You may also want to capture additional dimensions, such as area of work (e.g., platform or product), skillset (e.g., frontend or backend), tenure, role level, location, and other demographics. These attributes can be used to slice the data to analyze trends across different cohorts.
You will need to prepare your developers for the survey by communicating with them about the purpose of the survey and how you plan to follow up with survey results. Plan for how you will drive awareness and participation.
Next, invite all of your devs to complete your survey. Set a clear deadline - we recommend at least a week. At Atlassian, we run our survey at the beginning of the last month in each quarter, with the survey period lasting two weeks.
Tip: Driving Survey Participation
As engineering teams can have vastly different engineering practices and tooling, capturing the diversity and variability between teams is important. This is only possible with high levels of participation. We recommend using a mixture of communication techniques, such as Slack (bot messaging) and team communication through managers or leaders. Setting a clear participation goal (we strive for 80%+ at Atlassian) and showing progress during the survey duration enables everyone to drive participation.

3. Analyze survey data and share results with team
Est. time: 30 min
To analyze survey data effectively, begin by organizing the collected responses into a structured format. Next, clean the data by checking for any inconsistencies or missing values, which may skew the results.
Once the data is prepared, employ descriptive statistics to summarize key findings, such as means, medians, and modes, which provide insights into central tendencies. Visual representations, such as charts and graphs, can help illustrate trends and patterns. For deeper analysis, consider using inferential statistics to draw conclusions about the larger population based on the sample data. For example, at Atlassian, we create:
- Trend data (you will need to run the survey a few times to gather this data, but it is invaluable to understand how you are improving or regressing)
- Heat maps (compare demographics and teams to find opportunities for collaboration with peer teams or focus areas where your team has a significant delta to peers)
- Impact data (to help understand what drives the sentiment around your vital signs)
Theme analysis (if you choose to include a free-text response question, use AI to find the key themes and add context to your sentiment question)
Finally, interpret the results in the context of the survey's objectives, highlighting significant findings and any potential implications.
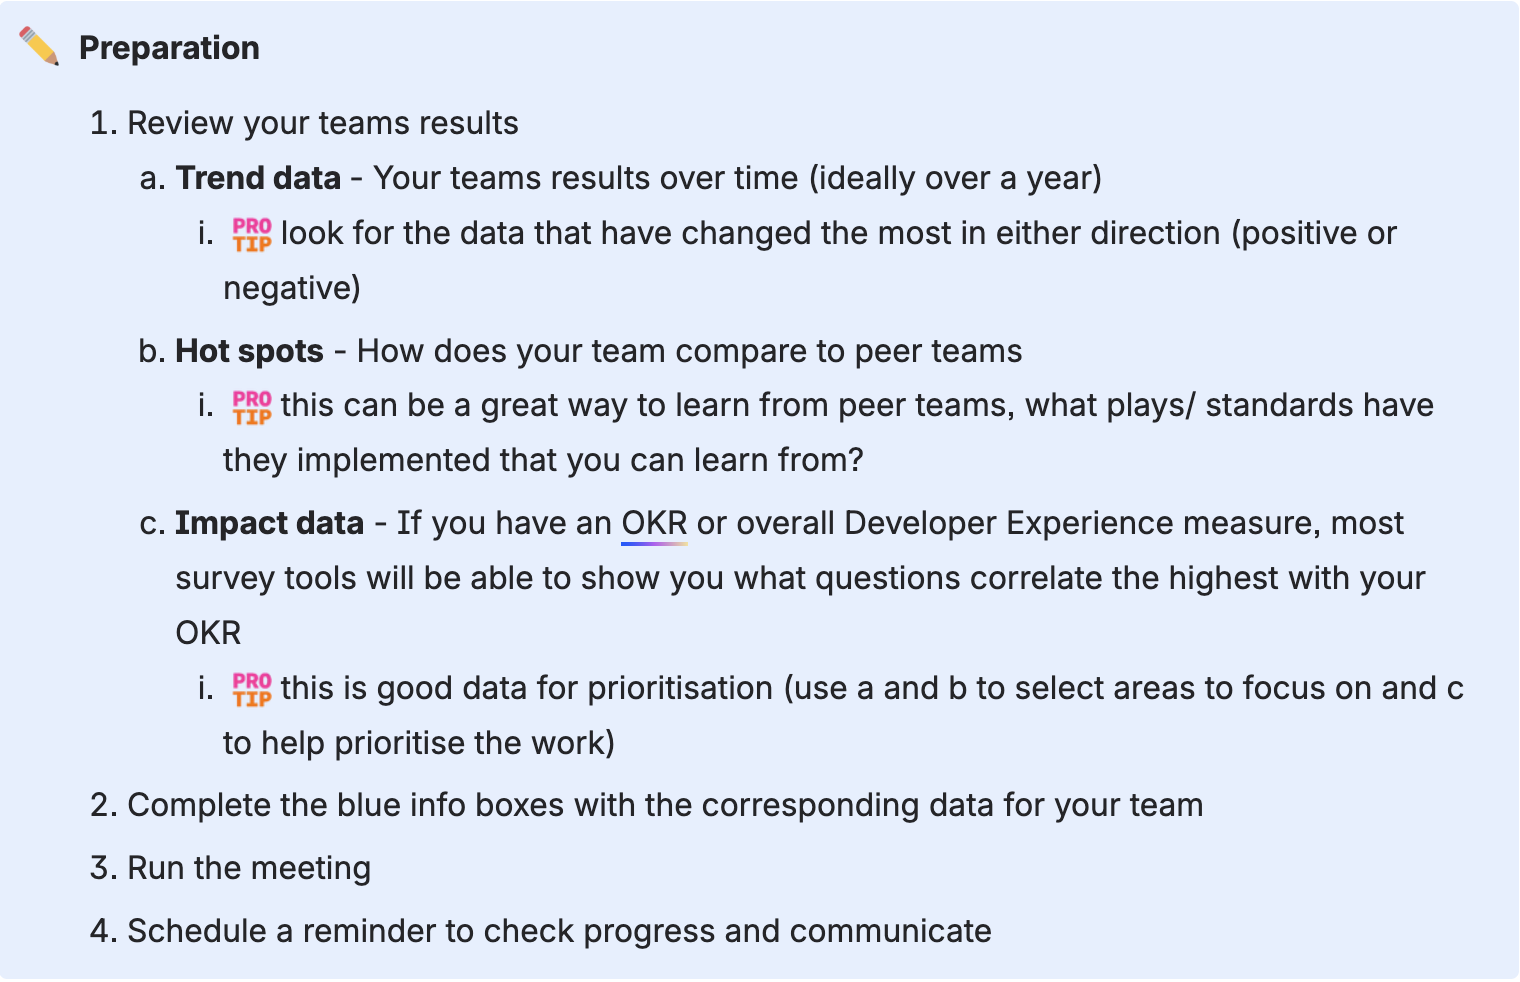
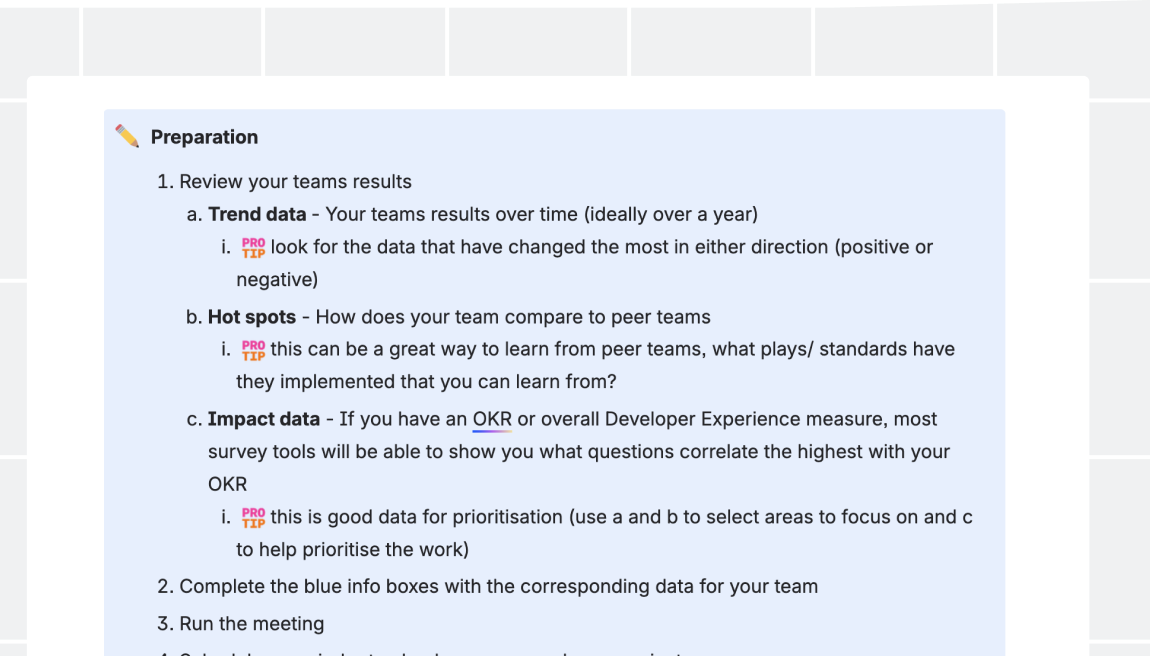
4. Discuss results and document an action plan to improve developer experience
Est. time: 15 min
Finally, brainstorm solutions after discussing survey results and identifying the top three most pressing opportunities for improvement. At Atlassian, engineering leaders hold team conversations to collaborate on creating action plans.
Follow-through matters; sharing results with an action plan is an important way for the team to demonstrate to developers that their voice matters and can lead to change, which in turn can ensure high survey completion rates going forward. The survey provides devs with a way to contribute, helping them feel more invested in developer experience outcomes, which in turn often leads to better follow-through and more consistent results.
Tip: Driving Survey Participation
Keeping your survey up-to-date is essential for measuring signals affecting Developer Experience. Reviewing free-text comments for emerging themes and conducting interviews every 3 to 6 months can be a good way to identify gaps in your survey.
Warning: If a vital sign gap is found, review how adding a question may impact the longitudinal data collected by your survey; survey design is crucial.
Follow-up
We recommend scheduling and running the developer experience survey at least twice per year if you are in a healthy state, or quarterly if you are actively prioritizing work to improve the developer experience.
Variations
Other variations can include:
- Optional add-on questions that expand upon or deep dive into vital signs to gather more granular signals in a particular hotspot.
- Shorter, more frequent surveys comprised of a minimal question subset to maintain a constant pulse on sentiment between survey periods.

Still have questions?
Start a conversation with other Atlassian Team Playbook users, get support, or provide feedback.
Other plays you may like

Goal-setting
OKRs
Define what objectives to achieve and track progress with measurable key results.

Decision-making
DACI Decision Making Framework
Assign clear roles to ensure effective collaboration and accountability during the decision-making process.

Decision-making
Tradeoffs
Define and prioritize your project variables.

Goal-setting
Modeling Strategic Focus Areas
Build and align on your organization’s strategic focus areas.
Stay up to date
Get the latest Plays and work life advice when you sign up for our newsletter.
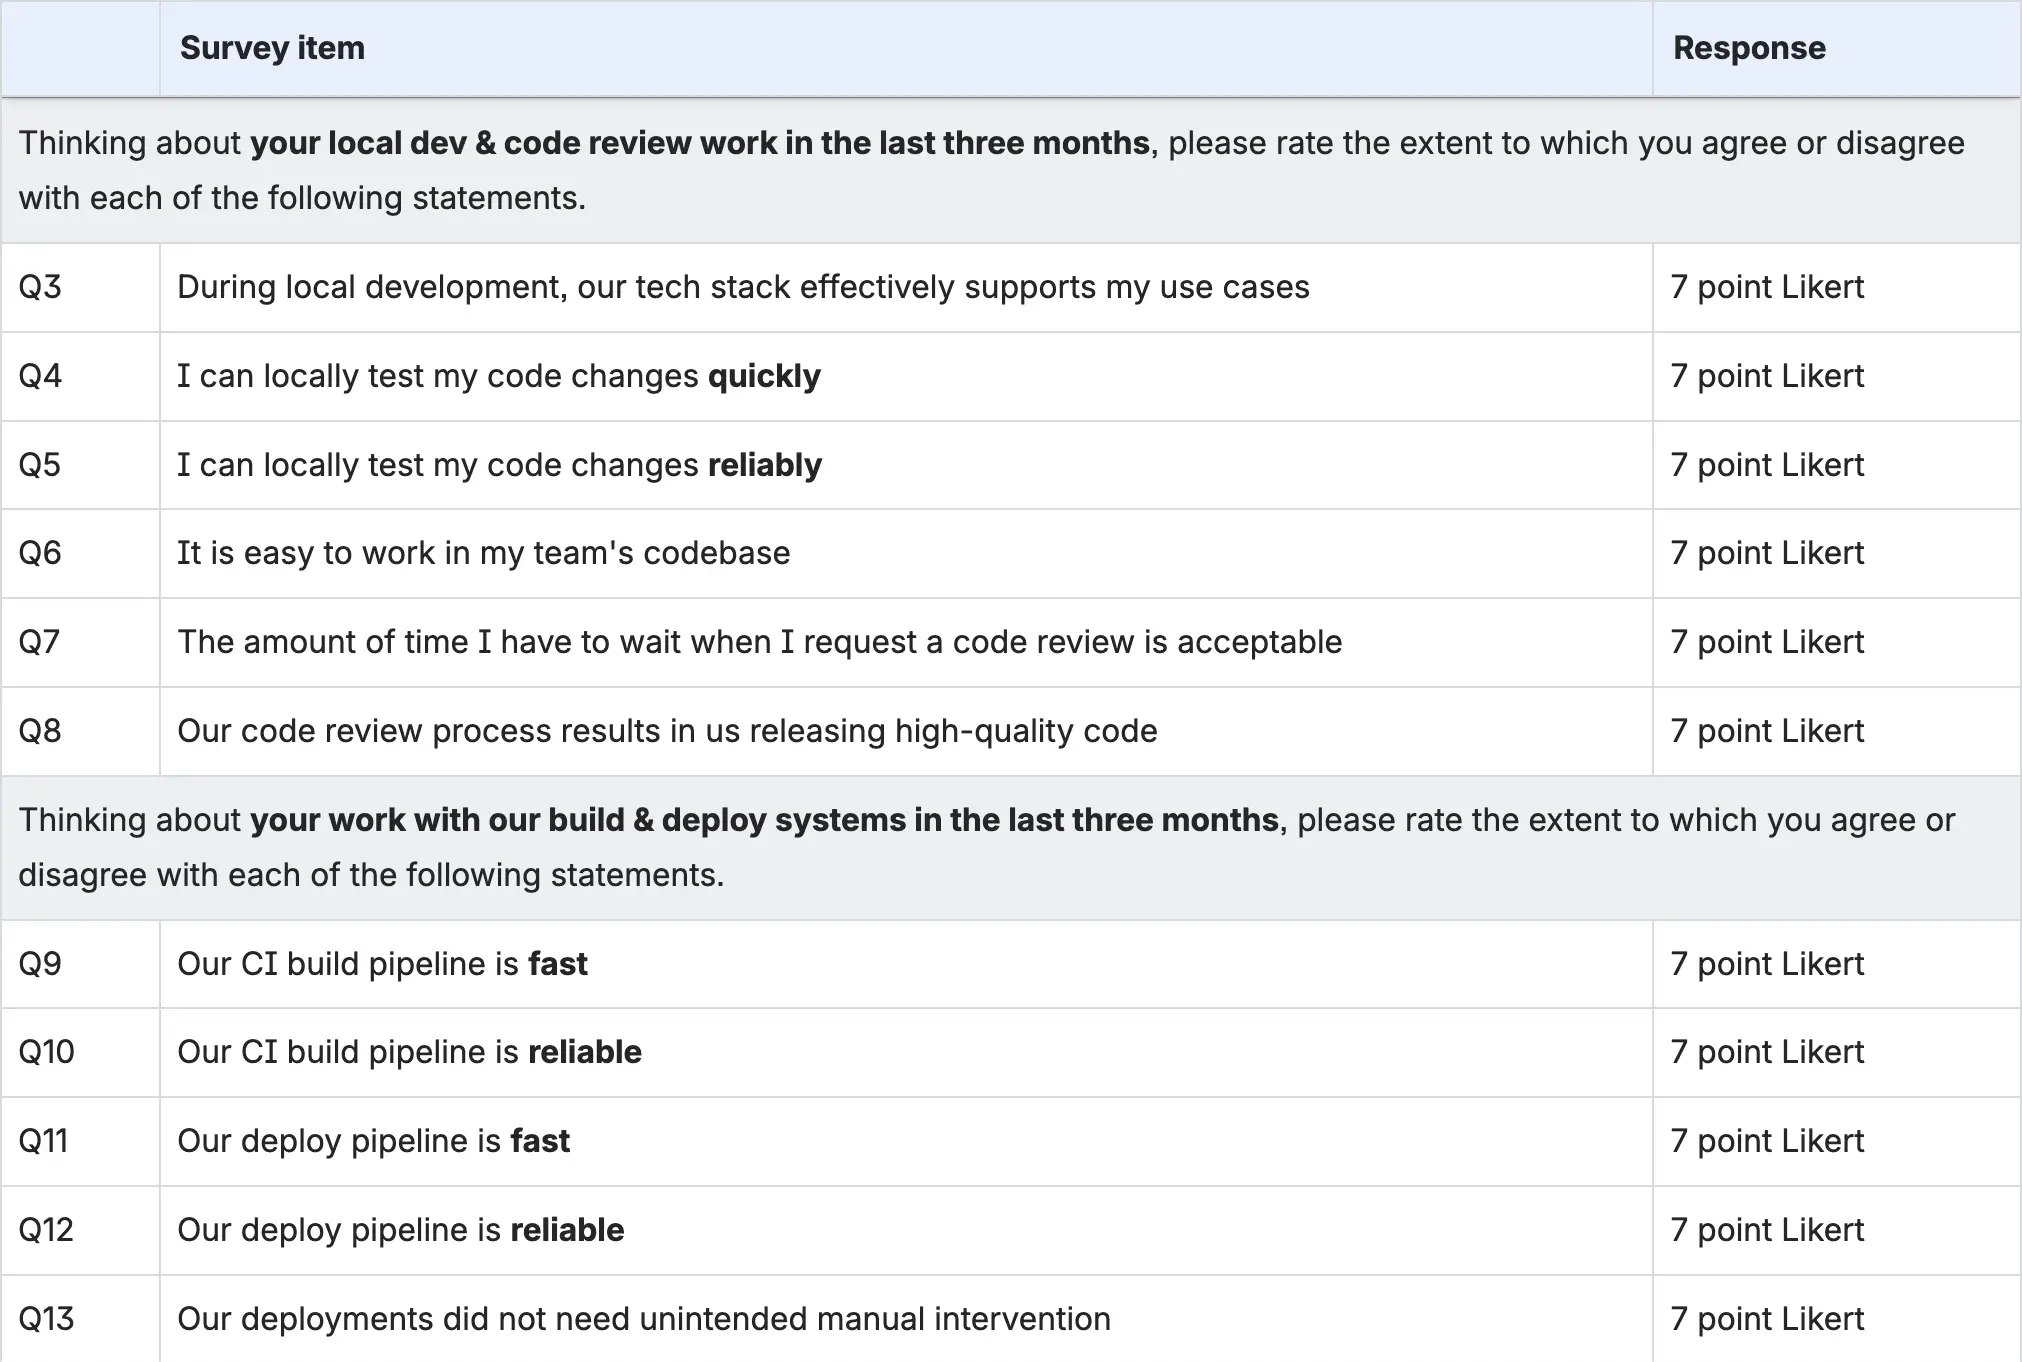
Here are the vital signs that Atlassian uses to measure developer experience:
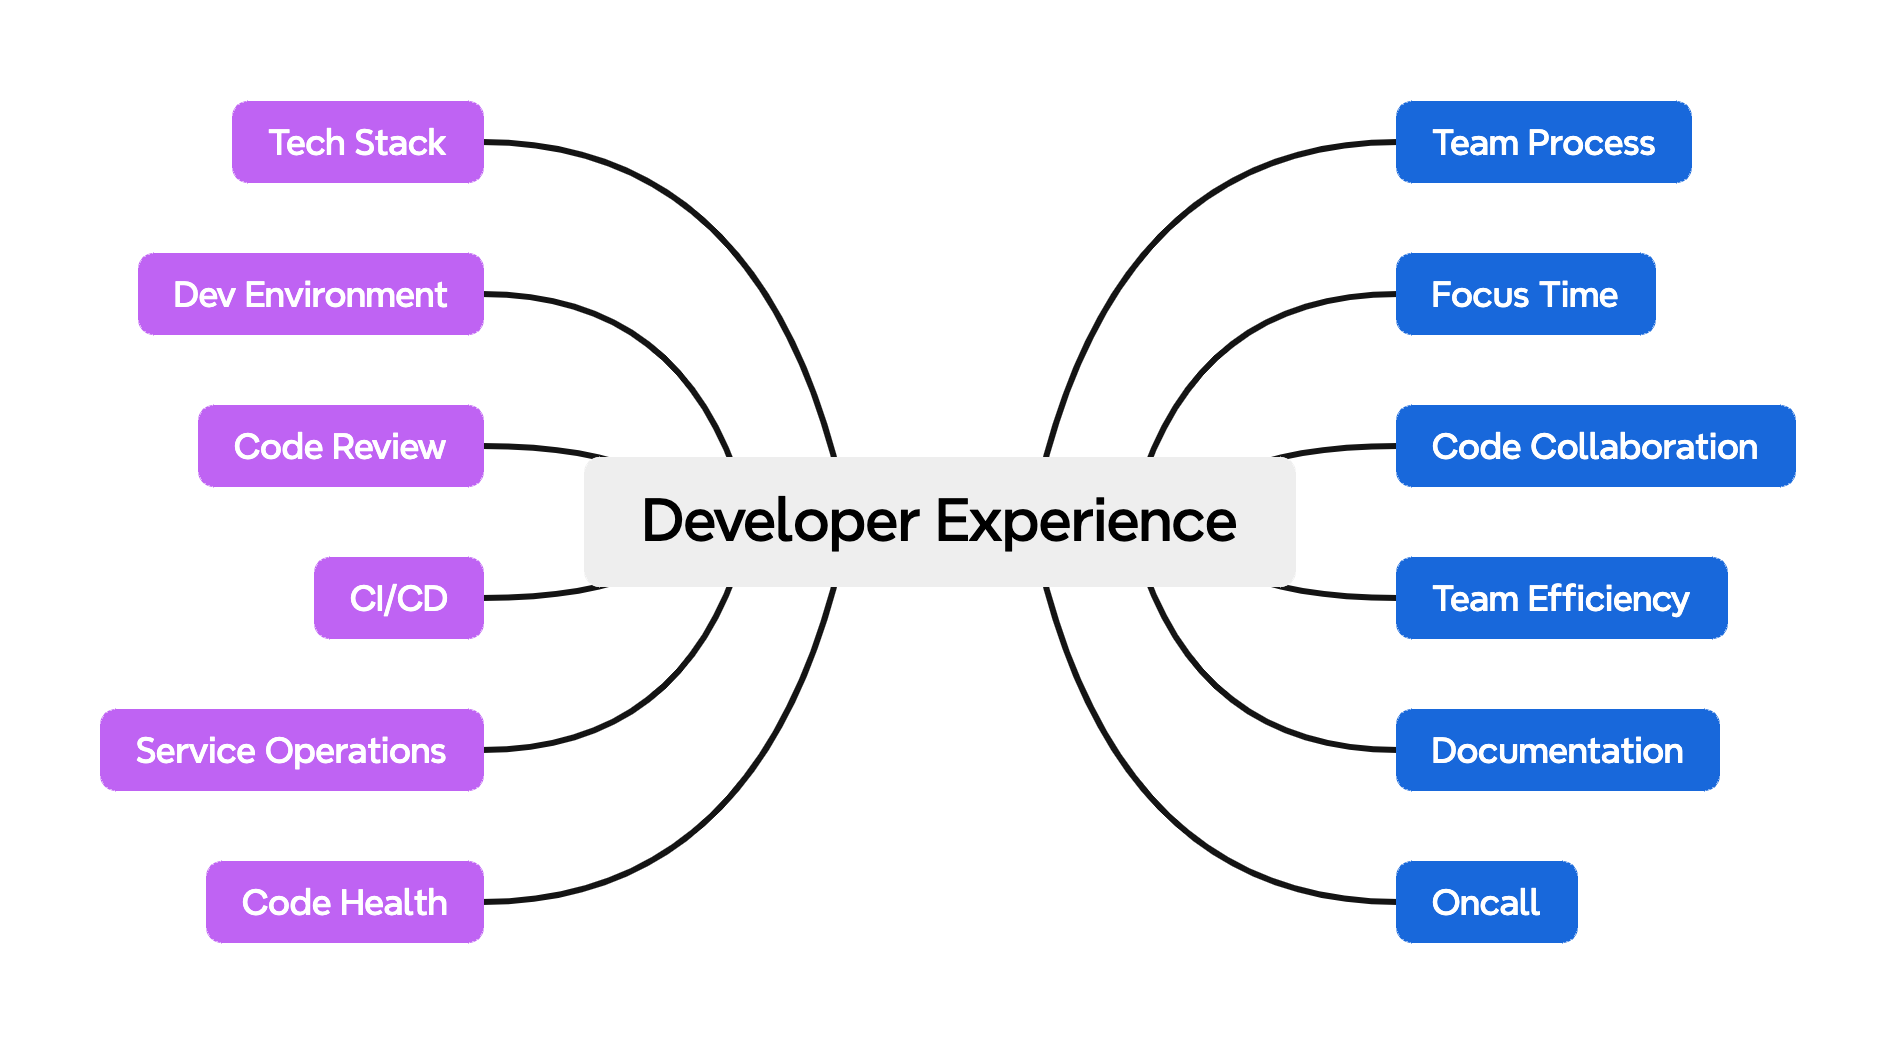
The following survey is based on Atlassian’s vital signs. If you choose to include different vital signs, you’ll need to adjust your survey questions.