What is code coverage?
In this article, you'll learn how to get started with code coverage, find the right tool, and how to calculate it.

Sten Pittet
Contributing Writer
Code coverage is a metric that can help you understand how much of your source is tested. It's a very useful metric that can help you assess the quality of your test suite, and we will see here how you can get started with your projects.
How Code Coverage is Calculated
Code coverage tools will use one or more criteria to determine how your code was exercised or not during the execution of your test suite. The common metrics that you might see mentioned in your coverage reports include:
- Function coverage: how many of the functions defined have been called.
- Statement coverage: how many of the statements in the program have been executed.
- Branches coverage: how many of the branches of the control structures (if statements for instance) have been executed.
- Condition coverage: how many of the boolean sub-expressions have been tested for a true and a false value.
- Line coverage: how many of lines of source code have been tested.
These metrics are usually represented as the number of items actually tested, the items found in your code, and a coverage percentage (items tested / items found).
These metrics are related, but distinct. In the trivial script below, we have a Javascript function checking whether or not an argument is a multiple of 10. We'll use that function later to check whether or not 100 is a multiple of 10. It'll help understand the difference between the function coverage and branch coverage.
See solution
Build and operate software with Open DevOps
Related material
Automated testing for DevOps
coverage-tutorial.js
function isMultipleOf10(x) { if (x % 10 == 0) return true; else return false; } console.log(isMultipleOf10(100));
We can use the coverage tool istanbul to see how much of our code is executed when we run this script. After running the coverage tool we get a coverage report showing our coverage metrics. We can see that while our Function Coverage is 100%, our Branch Coverage is only 50%. We can also see that the isntanbul code coverage tool isn't calculating a Condition Coverage metric.
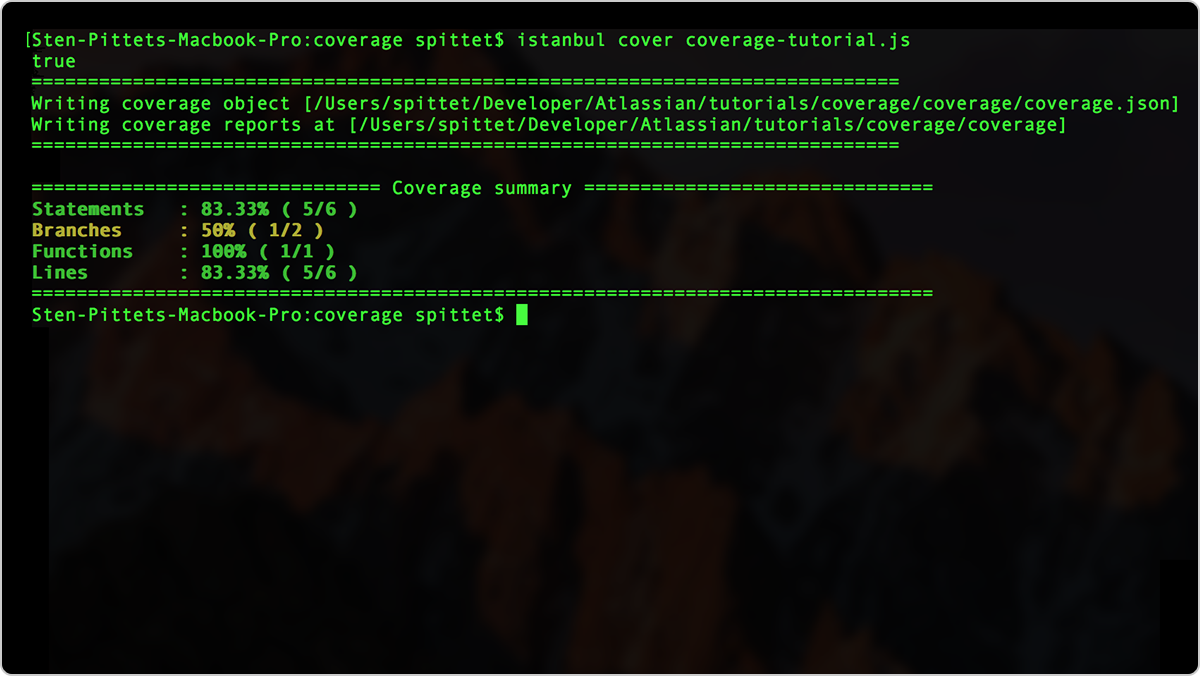
This is because when we run our script, the else statement has not been executed. If we wanted to get 100% coverage, we could simply add another line, essentially another test, to make sure that all branches of the if statement is used.
coverage-tutorial.js
function isMultipleOf10(x) { if (x % 10 == 0) return true; else return false; } console.log(isMultipleOf10(100)); console.log(isMultipleOf10(34)); // This will make our code execute the "return false;" statement.
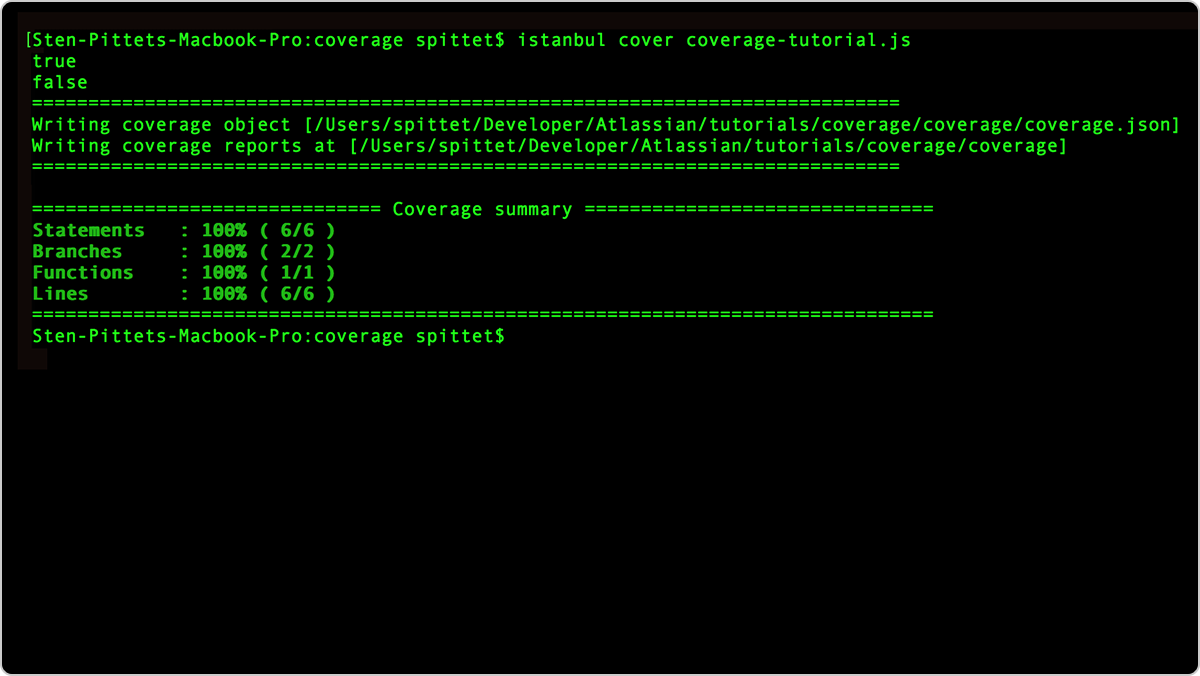
A second run of our coverage tool will now show that 100% of the source is covered thanks to our two console.log() statements at the bottom.
In this example, we were just logging results in the terminal but the same principal applies when you run your test suite. Your code coverage tool will monitor the execution of your test suite and tell you how much of the statements, branches, functions and lines were run as part of your tests.
Code Coverage: 6 Tips to Get Started
1. Find the right tool for your project
You might find several options to create coverage reports depending on the language(s) you use. Some of the popular tools are listed below:
- Java: Atlassian Clover, Cobertura, JaCoCo
- Javascript: istanbul
- PHP: PHPUnit
- Python: Coverage.py
- Ruby: SimpleCov
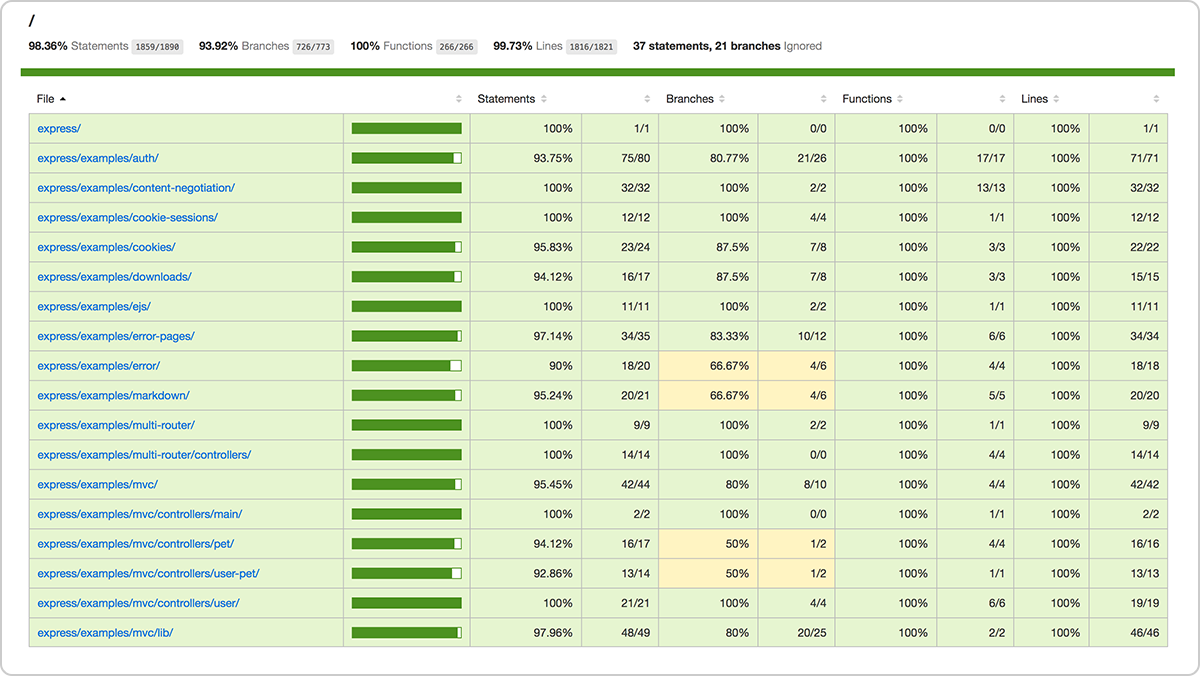
A comparison of tools can also help you make your decision. Some tools like istanbul will output the results straight into your terminal while others can generate a full HTML report that lets you explore which part of the code are lacking coverage.
2. What percentage of coverage should you aim for?
There's no silver bullet in code coverage, and a high percentage of coverage could still be problematic if critical parts of the application are not being tested, or if the existing tests are not robust enough to properly capture failures upfront. With that being said it is generally accepted that 80% coverage is a good goal to aim for. Trying to reach a higher coverage might turn out to be costly, while not necessary producing enough benefit.
The first time you run your coverage tool you might find that you have a fairly low percentage of coverage. If you're just getting started with testing it's a normal situation to be in and you shouldn't feel the pressure to reach 80% coverage right away. The reason is that rushing into a coverage goal might push your team to write tests that are hitting every line of the code instead of writing tests that are based on the business requirements of your application.
For instance, in the example above we reached 100% coverage by testing if 100 and 34 were multiples of 10. But what if we called our function with a letter instead of a number? Should we get a true/false result? Or should we get an exception? It is important that you give time to your team to think about testing from a user perspective and not just by looking at lines of code. Code coverage will not tell you if you're missing things in your source.
3. Focus on unit testing first
Unit tests consist in making sure that the individual methods of the classes and components used by your application are working. They're generally cheap to implement and fast to run and give you an overall assurance that the basis of the platform is solid. A simple way to increase quickly your code coverage is to start by adding unit tests as, by definition, they should help you make sure that your test suite is reaching all lines of code.
4. Use coverage reports to identify critical misses in testing
Soon you'll have so many tests in your code that it will be impossible for you to know what part of the application is checked during the execution of your test suite. You'll know what breaks when you get a red build, but it'll be hard for you to understand what components have passed the tests.
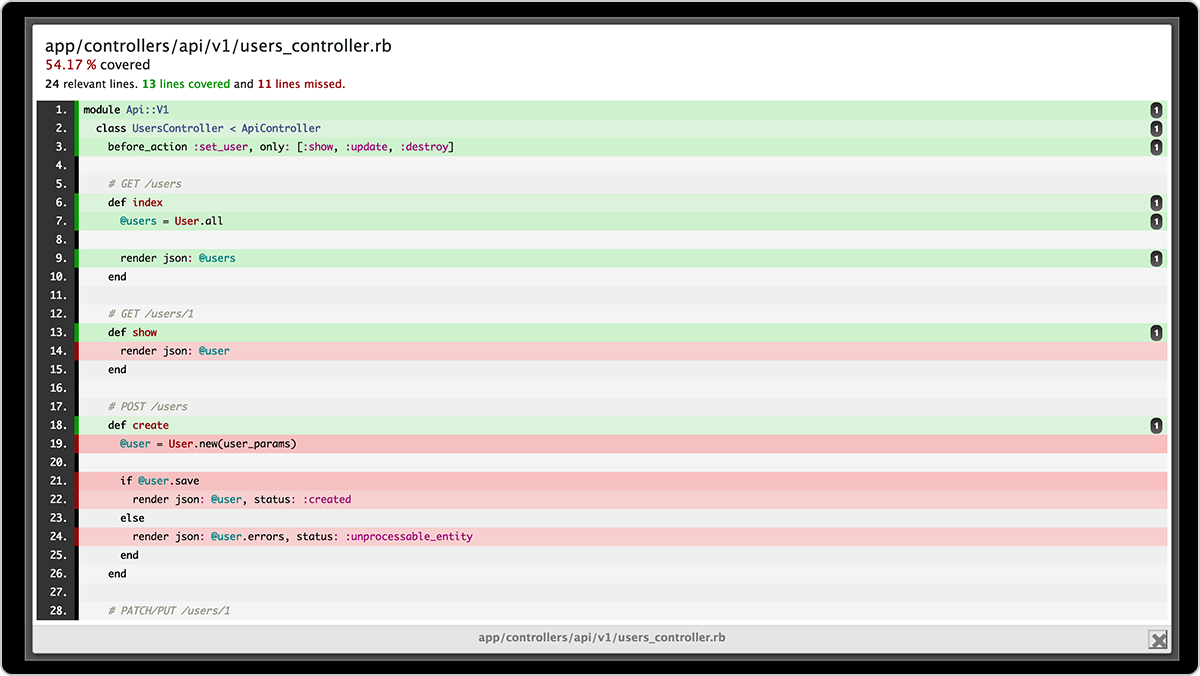
This is where the coverage reports can provide actionable guidance for your team. Most tools will allow you to dig into the coverage reports to see the actual items that weren't covered by tests and then use that to identify critical parts of your application that still need to be tested.
5. Make code coverage part of your continuous integration flow when you're ready
When you've established your continuous integration (CI) workflow you can start failing the tests if you don't reach a high enough percentage of coverage. Of course, as we said it earlier, it would be unreasonable to set the failure threshold too high, and 90% coverage is likely to cause your build to fail a lot. If your goal is 80% coverage, you might consider setting a failure threshold at 70% as a safety net for your CI culture.
Once again, be careful to avoid sending the wrong message as pressuring your team to reach good coverage might lead to bad testing practices.
6. Good coverage does not equal good tests
Getting a great testing culture starts by getting your team to understand how the application is supposed to behave when someone uses it properly, but also when someone tries to break it. Code coverage tools can help you understand where you should focus your attention next, but they won't tell you if your existing tests are robust enough for unexpected behaviors.
Achieving great coverage is an excellent goal, but it should be paired with having a robust test suite that can ensure that individual classes are not broken as well as verify the integrity of the system.
You can learn more here about the different types of software testing. Atlassian’s Open DevOps provides an open toolchain platform that allows you to build a CD-based development pipeline with the tools you love. Learn how Atlassian and third-party tools can integrate testing in your workflow with our DevOps testing tutorials.
Share this article
Next Topic
Recommended reading
Bookmark these resources to learn about types of DevOps teams, or for ongoing updates about DevOps at Atlassian.

DevOps community

Read the blog