Learn about Jira reports & dashboards
What are reports?
Jira has a range of reports that enable you to visualize trends about your project, versions, epics, sprints, and issues. Reports in Jira can be categorized into 4 types:
- Agile reports – Understand your team’s velocity, spot bottlenecks, and better predict future performance
- DevOps reports – Understand deployment pipeline and frequency to enable greater collaboration and streamline the product lifecycle
- Issue analysis reports – Understand the types of work your team is focused on and how your team is keeping up with the work
- Forecast and management reports – Evaluate your team’s capacity and better predict future performance

What are dashboards?
In Jira, a dashboard is a collection of “gadgets”, or pre-installed data displays, that show various types of real-time information to help you track and monitor your work across projects. Dashboards can be private or shared with other users on your instance. They can also contain information from a single or multiple projects, enabling you to access pertinent information from across your whole instance.
Dashboards can be found in the top navigation in your Jira site.
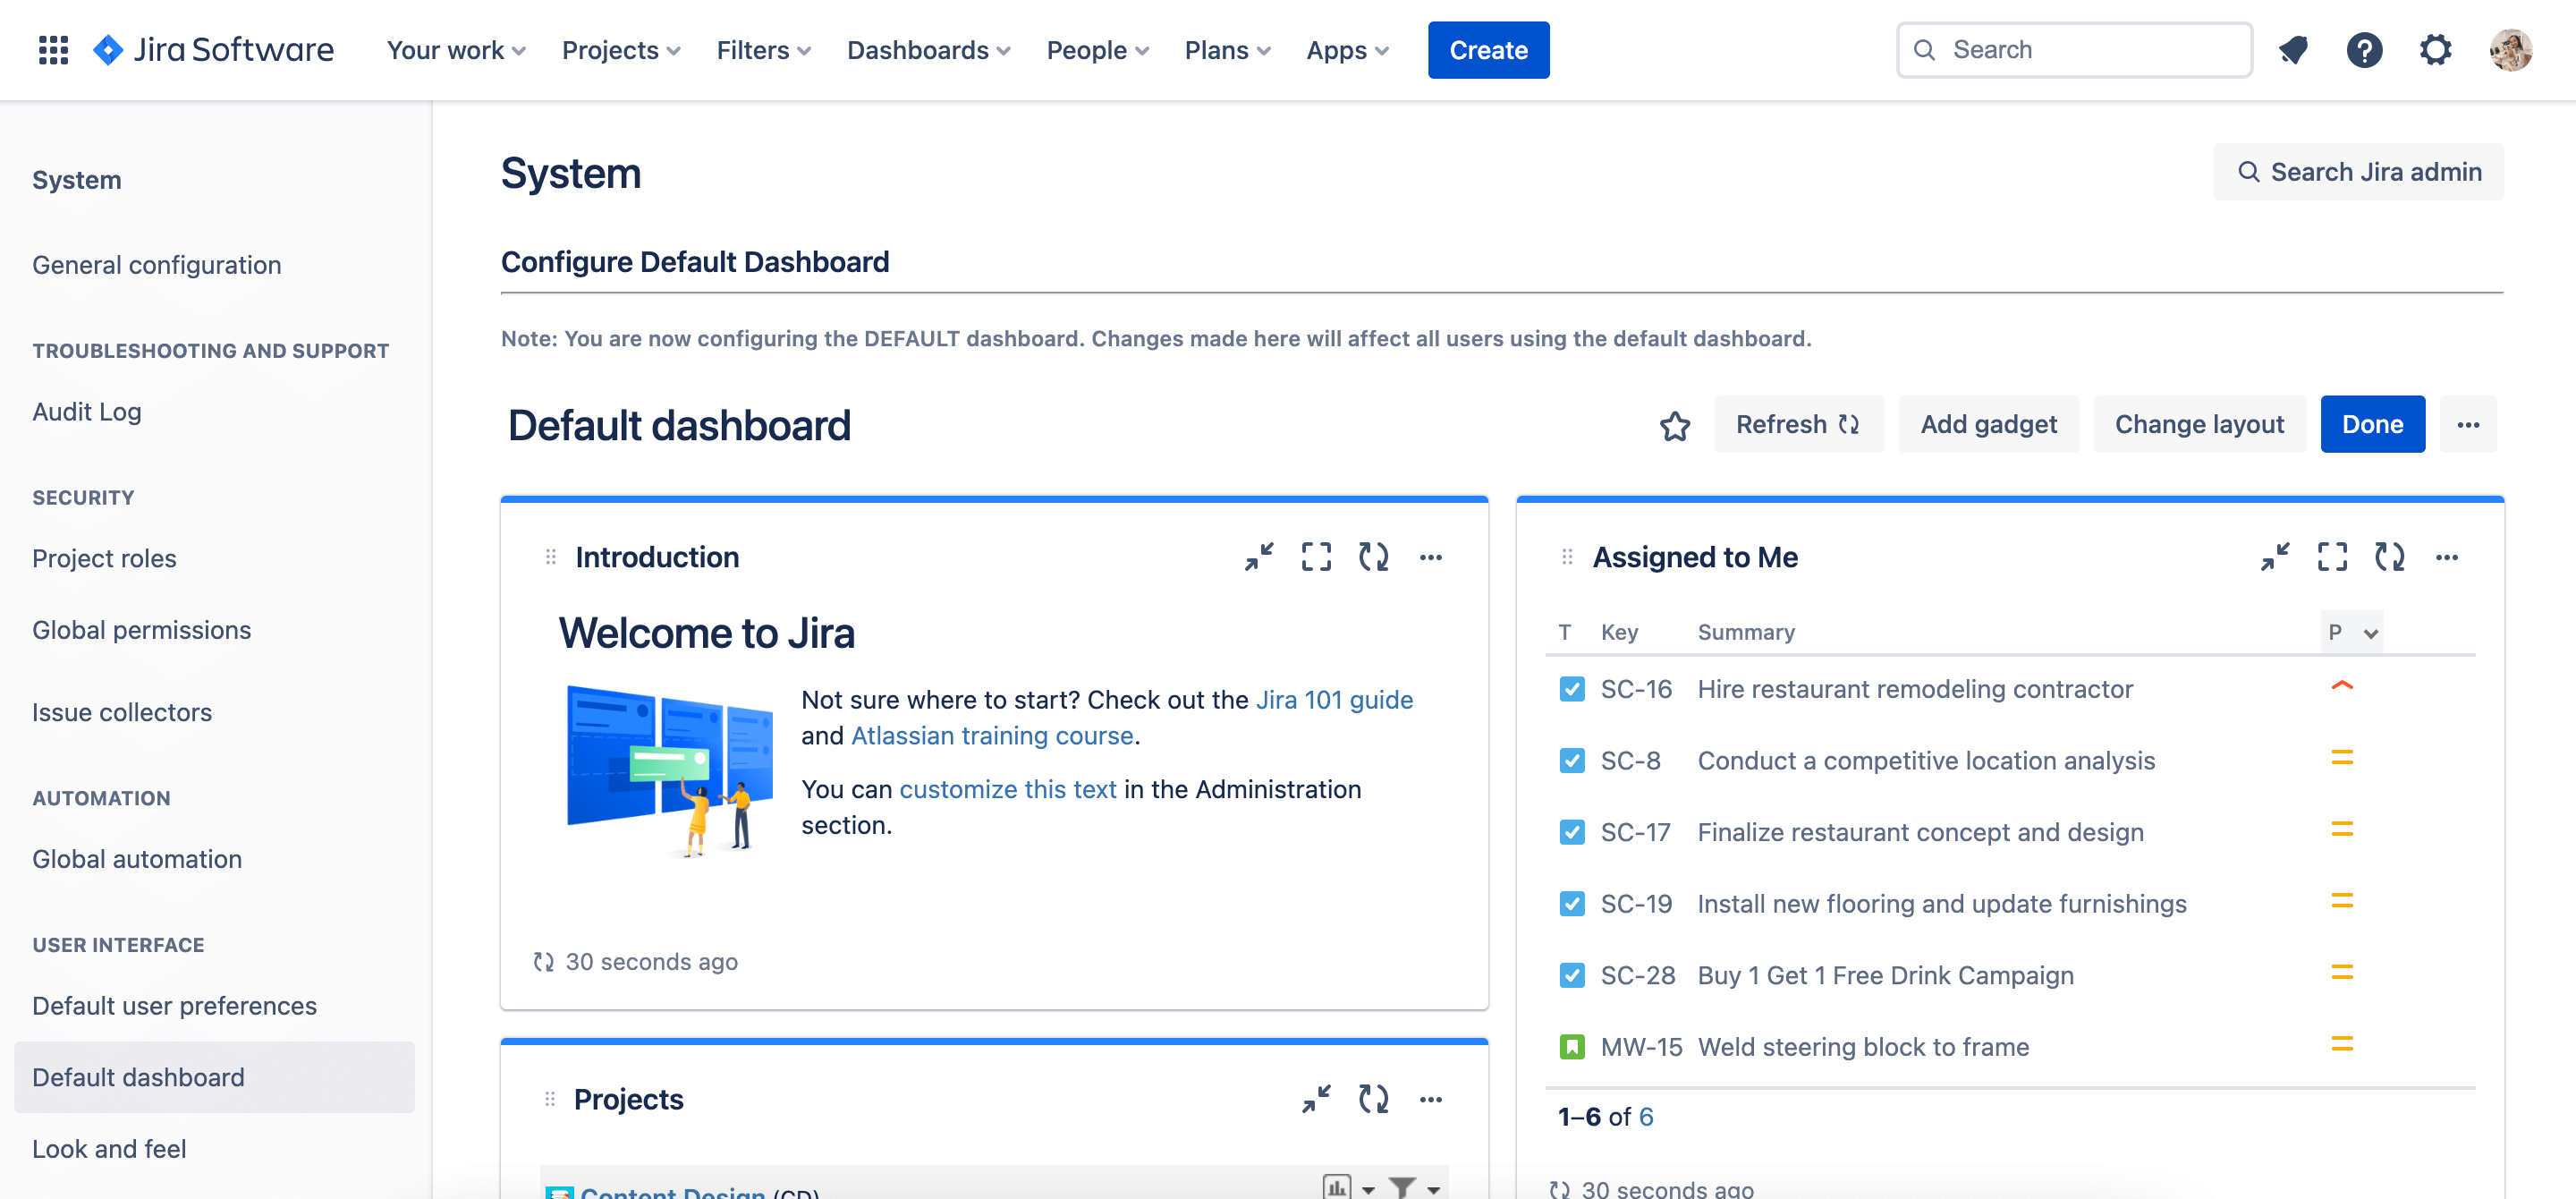
What is a system dashboard?
When users log in to Jira Cloud applications for the first time, they see the default dashboard. Only Jira administrators can change the gadgets and the layout of this default dashboard to show the most important information for your team.