Atlassian Analytics in Jira Service Management
How to use Atlassian Analytics in Jira Service Management
Whether you’re in IT Operations or Support, Atlassian Analytics can help you proactively spot and fix bottlenecks slowing down your team’s work, make better decisions around resource allocation, staffing, and investments, and keep tabs on the state of the business. You can customize dashboards to meet your stakeholders' needs and embed them into Confluence pages, Atlas tickets, and Trello cards making it easy to report out. You can learn more about the full capabilities of Atlassian Analytics across the Atlassian platform by reading our overview page.
Several dashboards are available out-of-the-box for common ITSM use cases. Once you connect your data from the Data Lake, the dashboard automatically populates the charts with your near-live data. Here’s a quick look at what you can do with these reports.
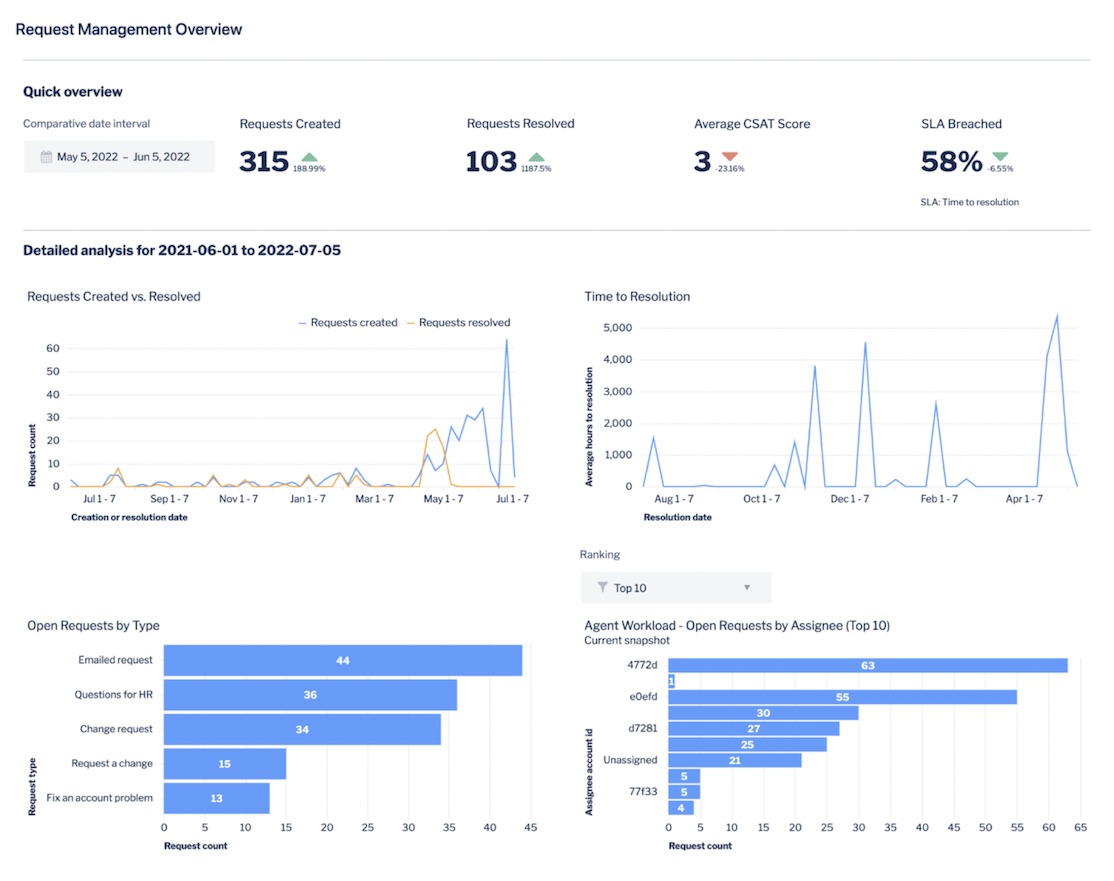
Request management
With the request management dashboard, your team can keep pushing to provide excellent service experiences to customers and employees. The requests created vs. resolved chart shows how often your team is closing out tickets and getting customers help, while the time to resolution chart measures how long that takes. You can also look at agent workload to see how the work is distributed among agents, CSAT to see whether customers are happy with the help provided by your team, and performance against SLAs (service-level agreements).
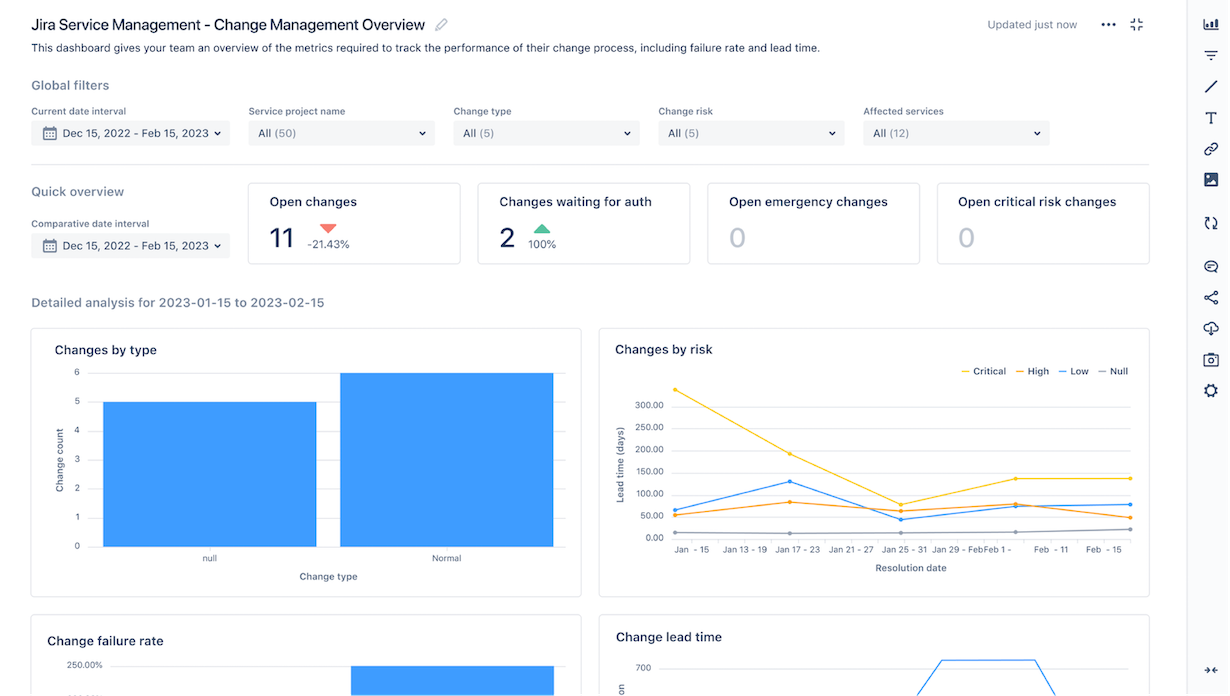
Change management
The dashboard for change management helps teams determine how well they’re able to minimize risk while continuing to make improvements and innovate at the pace of the business. You can use charts that show your changes by type and risk, how long it takes changes to deploy, change lead time, and change failure rate showing the types of changes that are failing. Armed with this data, you can continue improving your change management practices so you can deploy with confidence.
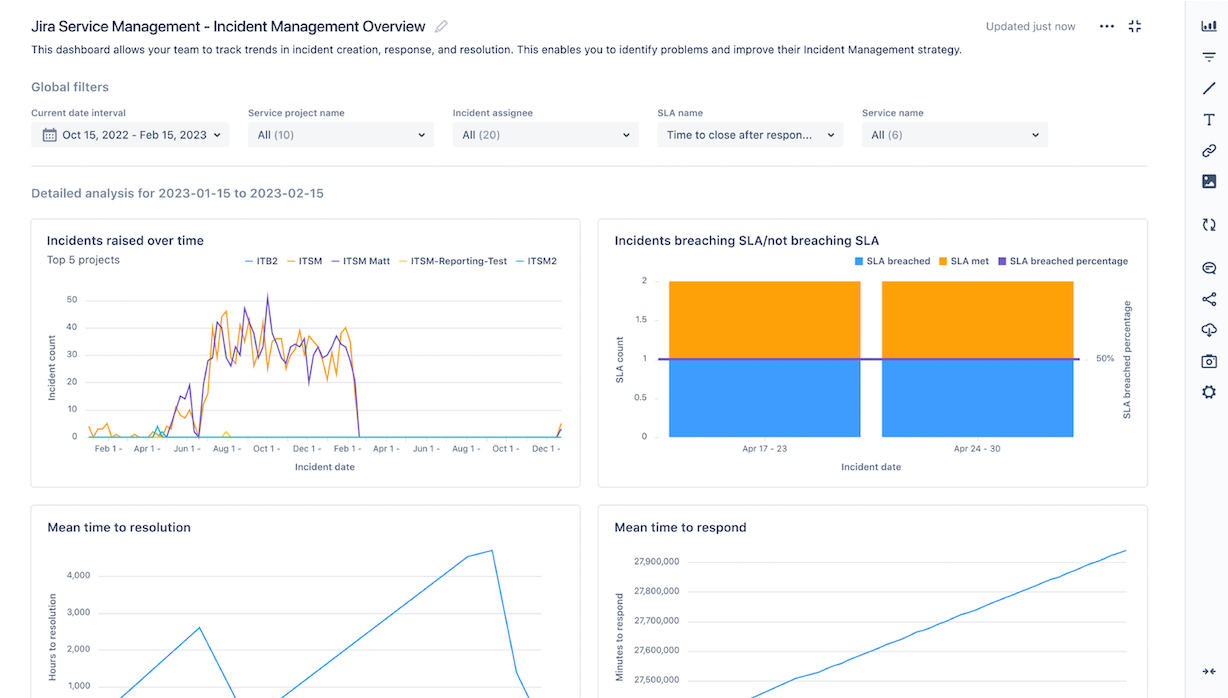
Incident management
When an incident occurs that takes your services offline, your main concern is getting service restored to customers as quickly as possible. When you’re ready to do your post-incident review (PIR), the incident management dashboard can provide data that will help you learn from incidents and improve for next time. You can review the volume of incidents over time, your team’s mean time to resolve or respond, and how often incidents have caused you to breach SLAs.
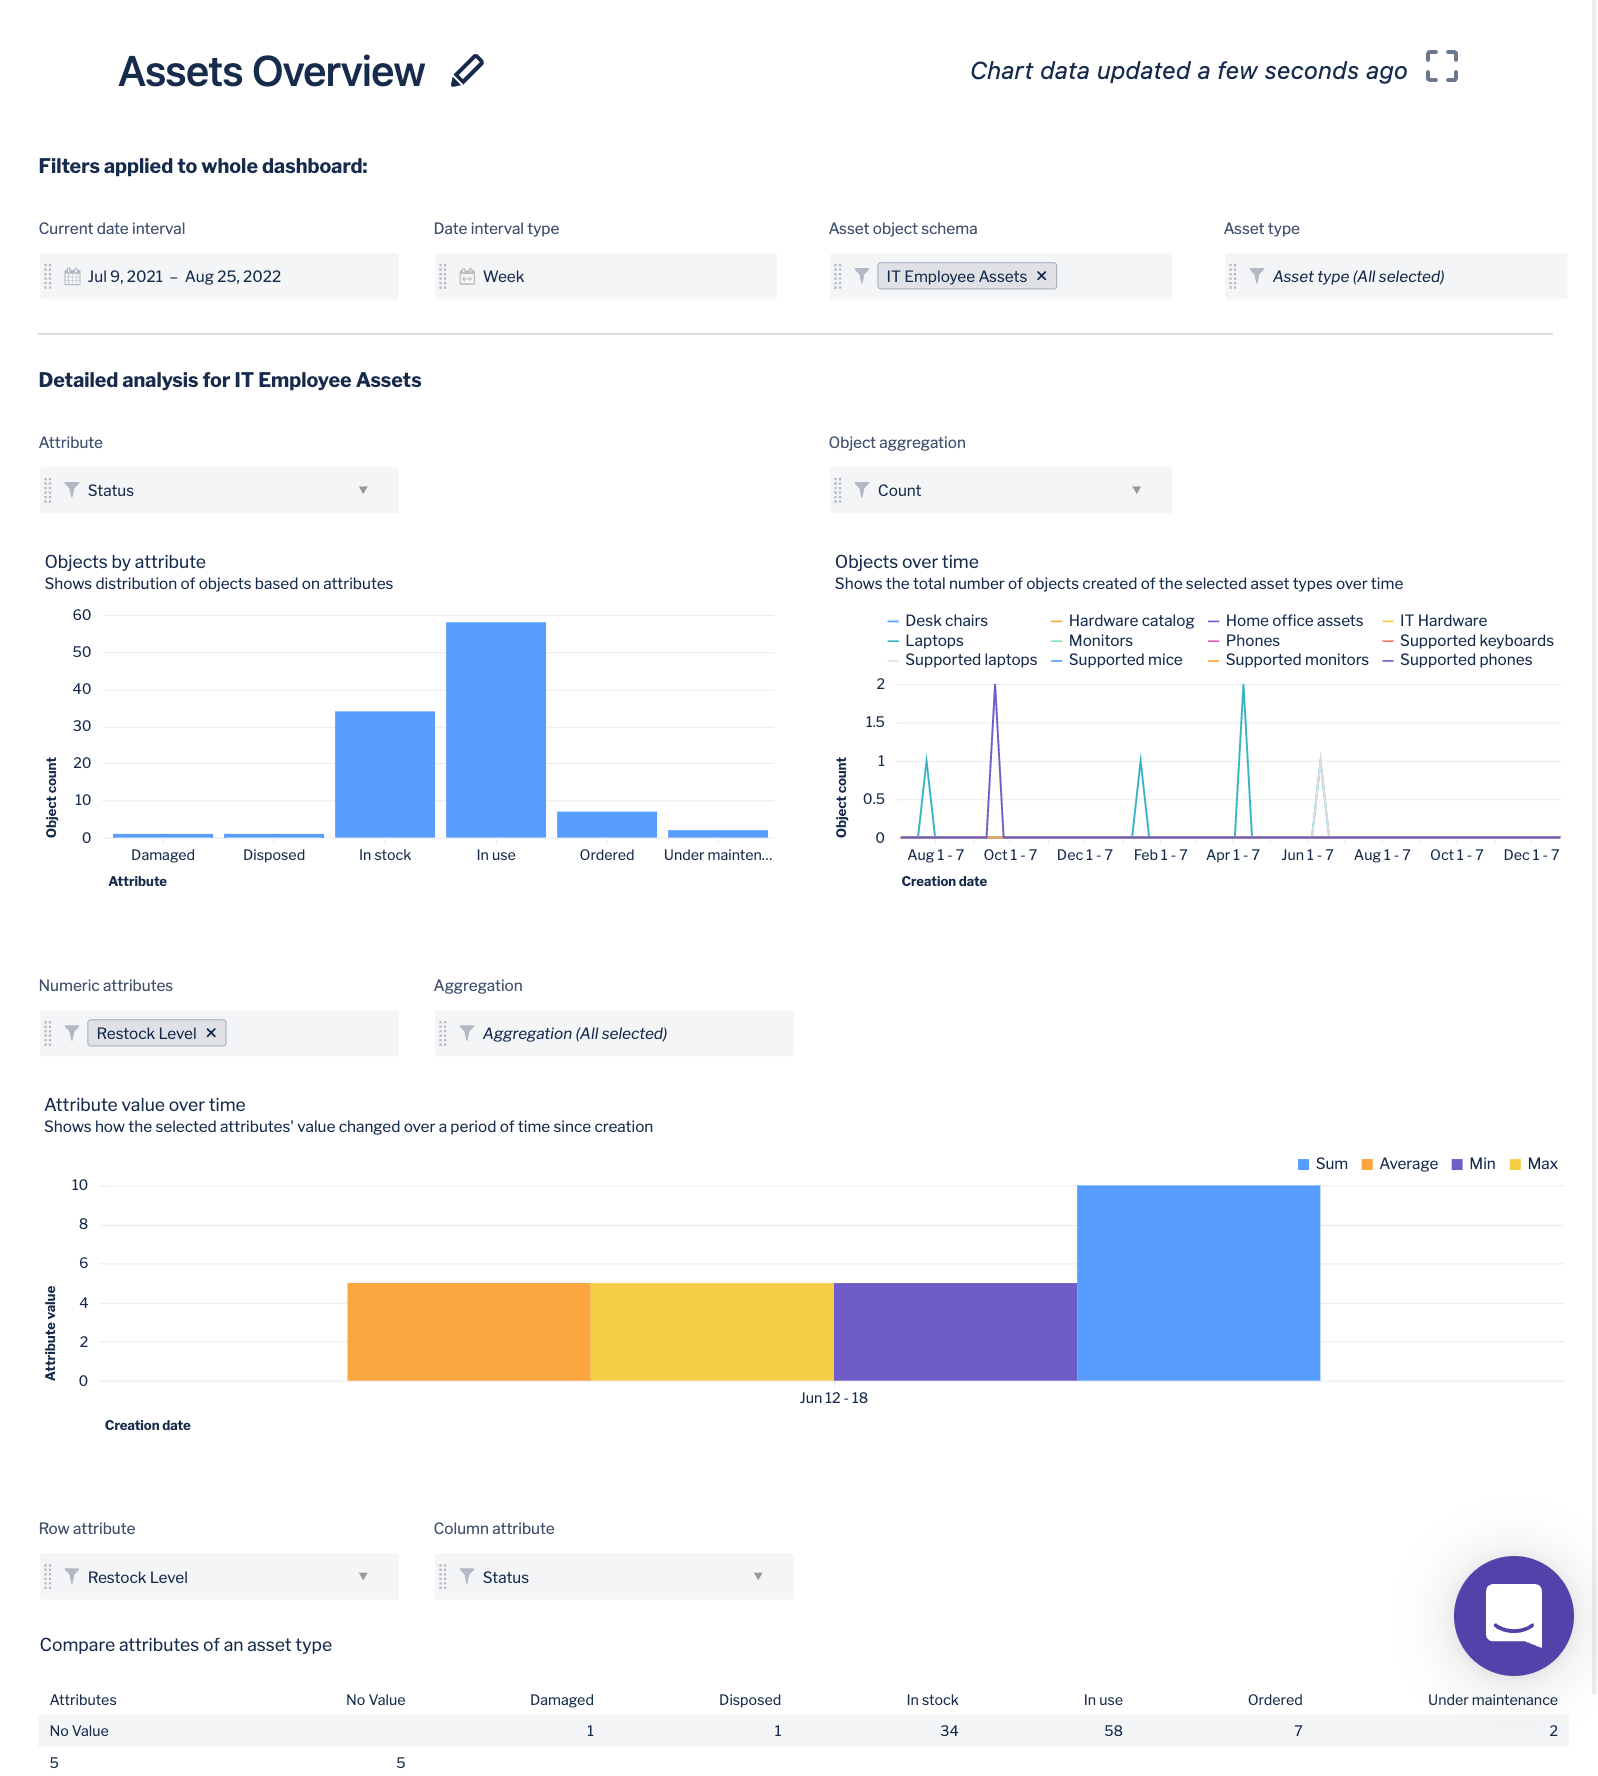
Asset management
The Assets overview dashboard gives teams a way to make sense of their objects and data stored in Assets, Jira Service Management's asset and configuration management feature set. Out-of-the-box reports allow you to prove value, power better decision-making, and report out easily. By viewing objects, their related issues and projects, and the time spent on them, the reports can be used for inventory management, lifecycle management, measuring employee productivity, and more. For example, you could look at data on how many employee laptops are currently in service and the amount that require maintenance, who they are owned by, and how much they cost.
Custom reporting
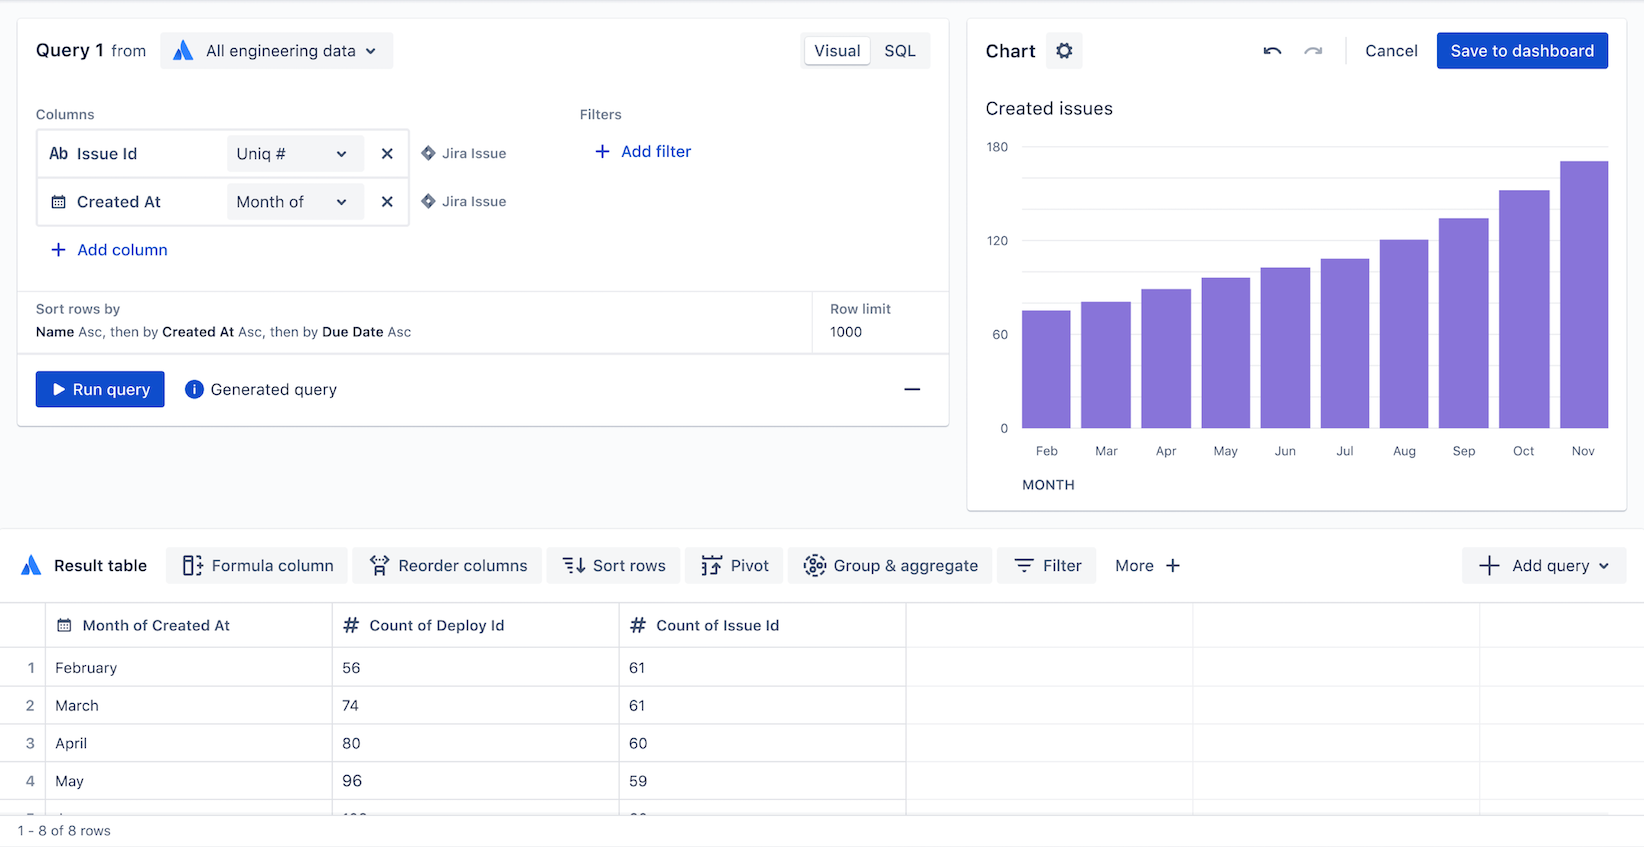
In addition to the out-of-the-box dashboards, you can also create your own. Getting started is easy with the visualSQL builder that allows you to create individual charts or entire dashboards using the criteria and data of your choice. With the Atlassian Data Lake, you can pull in data from other Atlassian tools, or even third-party tools like Snowflake, Amazon Redshift, Microsoft SQL Server, and more.
Getting Started
Asset and Configuration Management