Jira Product Discovery views overview
What is a list view?
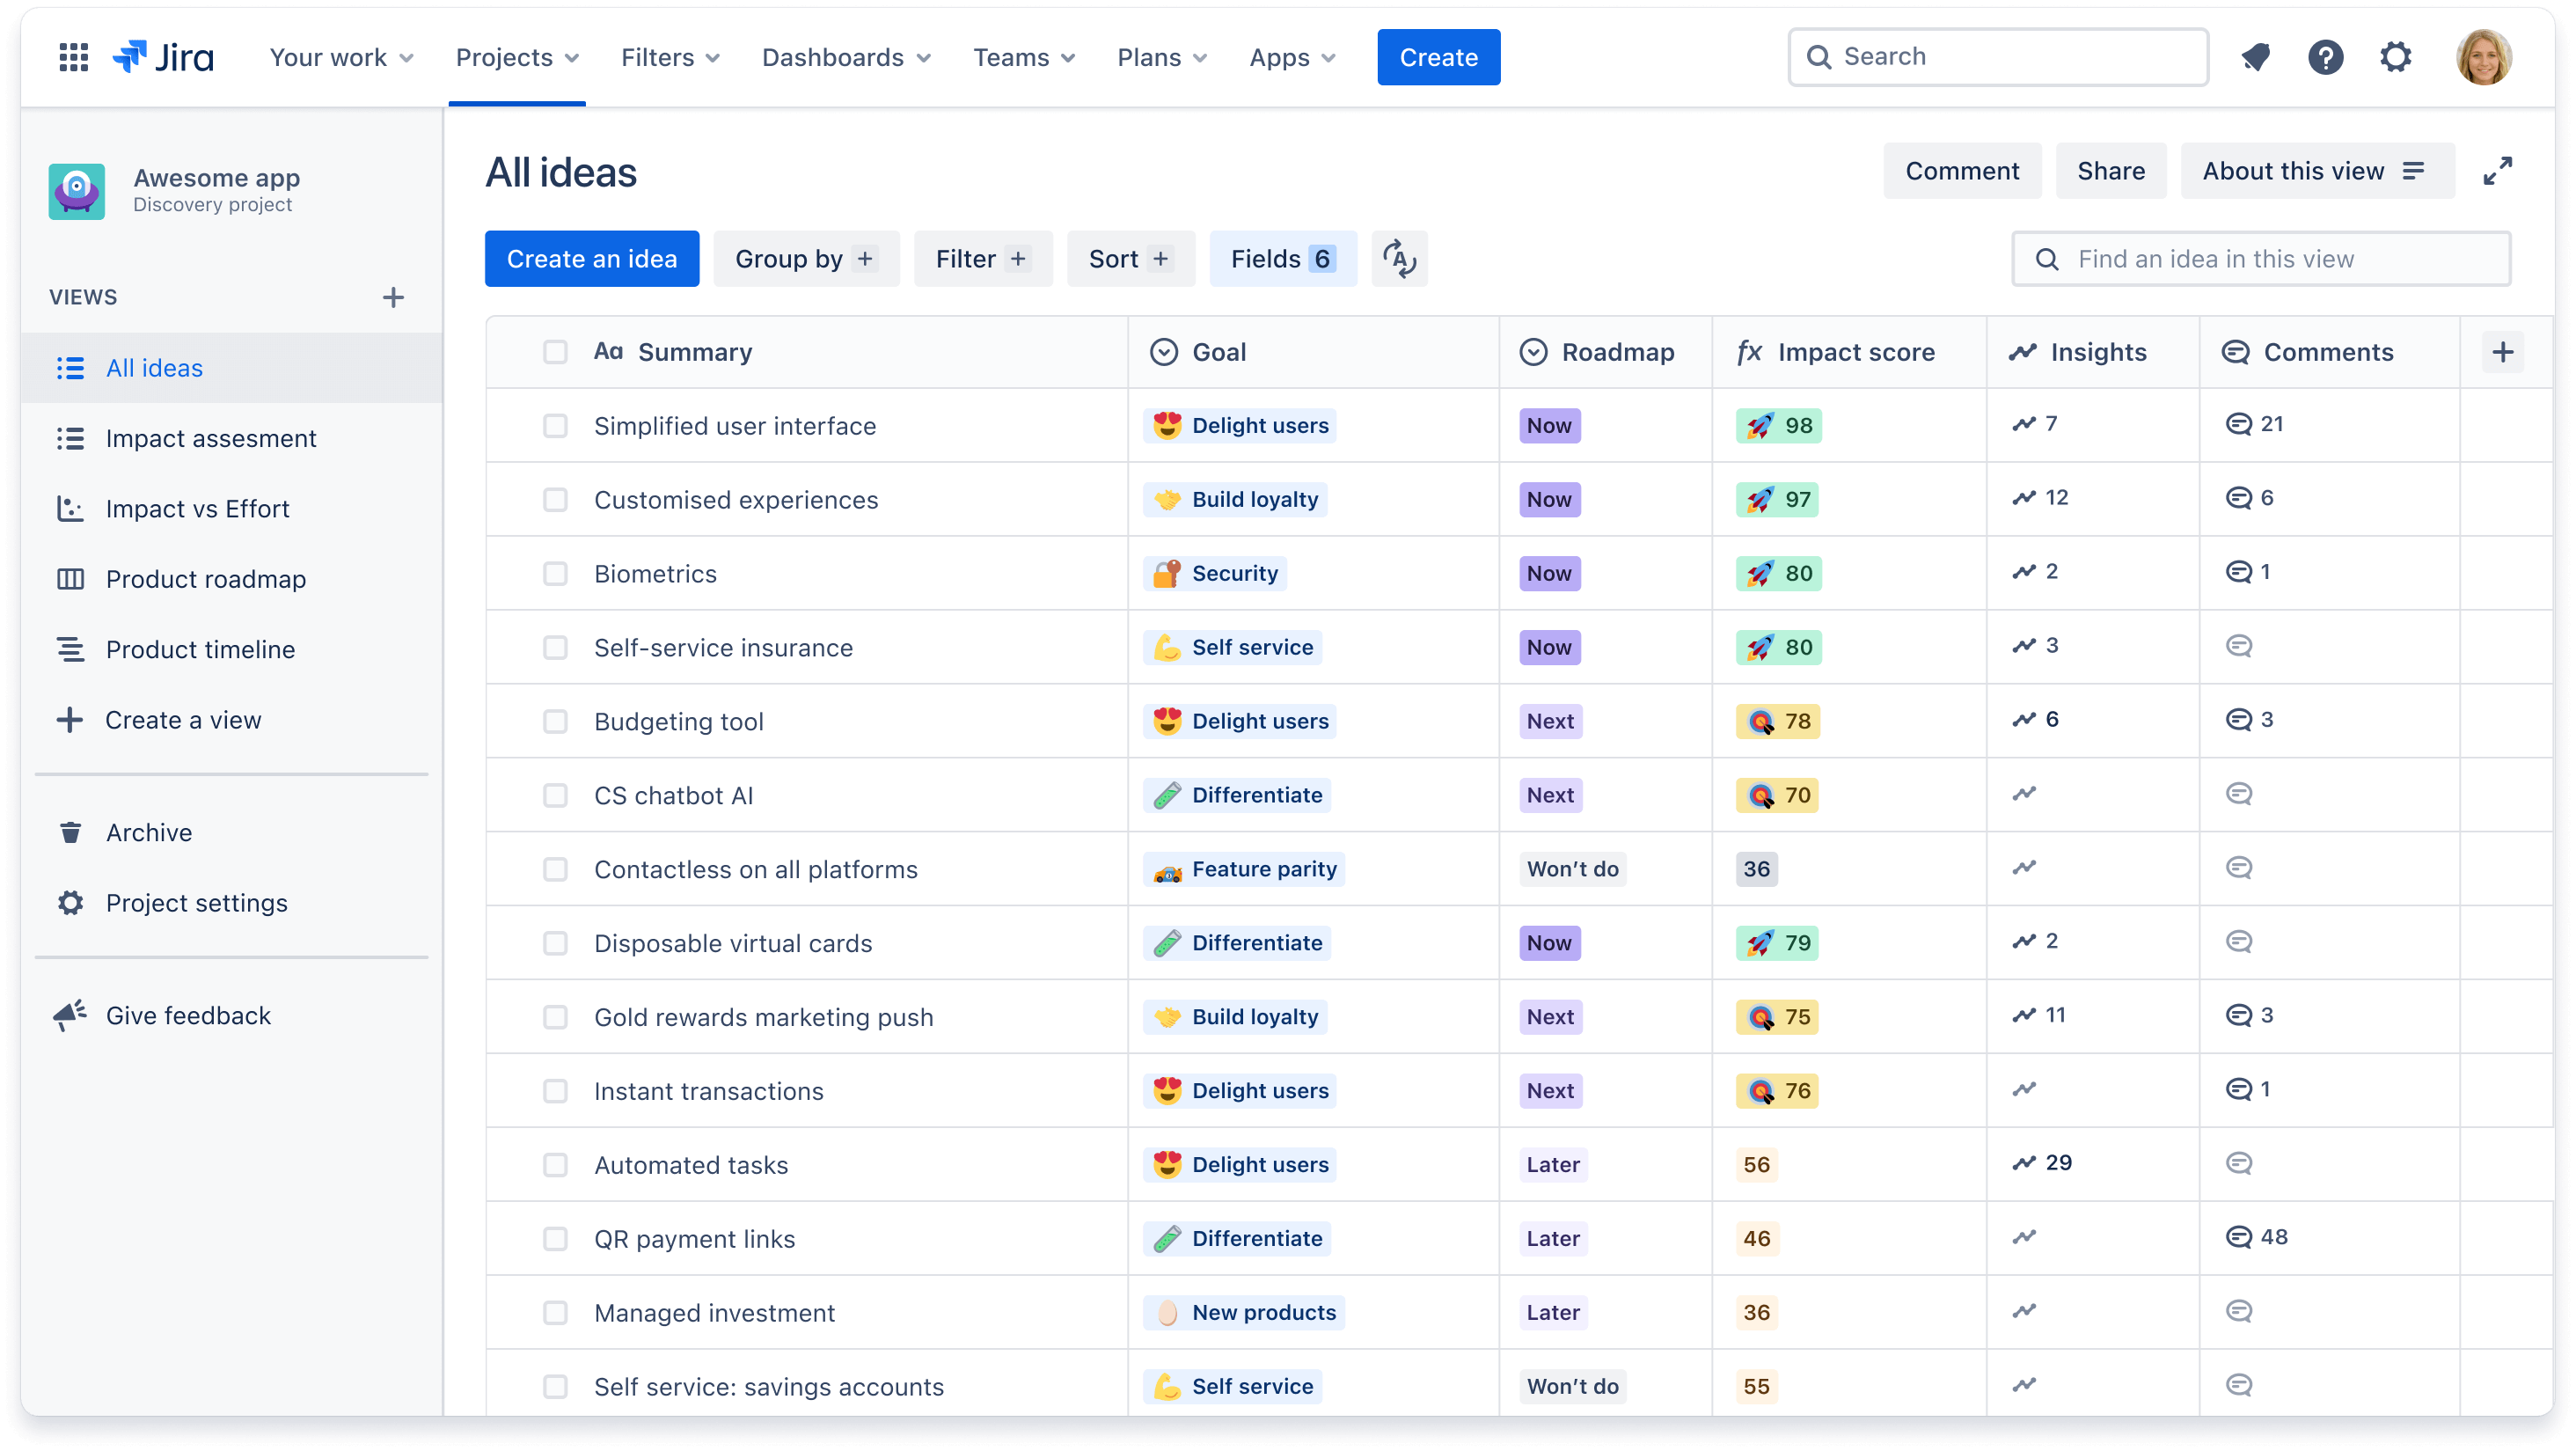
The list view is Jira Product Discovery’s default view. Think of a list view as an extendable spreadsheet. You can put all of your ideas in one place, group them, filter, and slice and dice them in a way that makes sense to you.
When to use a list view
List views are a great starting point to gather ideas in one place and decide which fields you need to organize and prioritize those ideas. We recommend using this view when:
- you need to easily scan a list of ideas and compare them across multiple fields
- you need to sort ideas ascending or descending based on a field and see their positioning
-
you need to group ideas based off a field you select, such as ‘Goal’ or ‘Team’
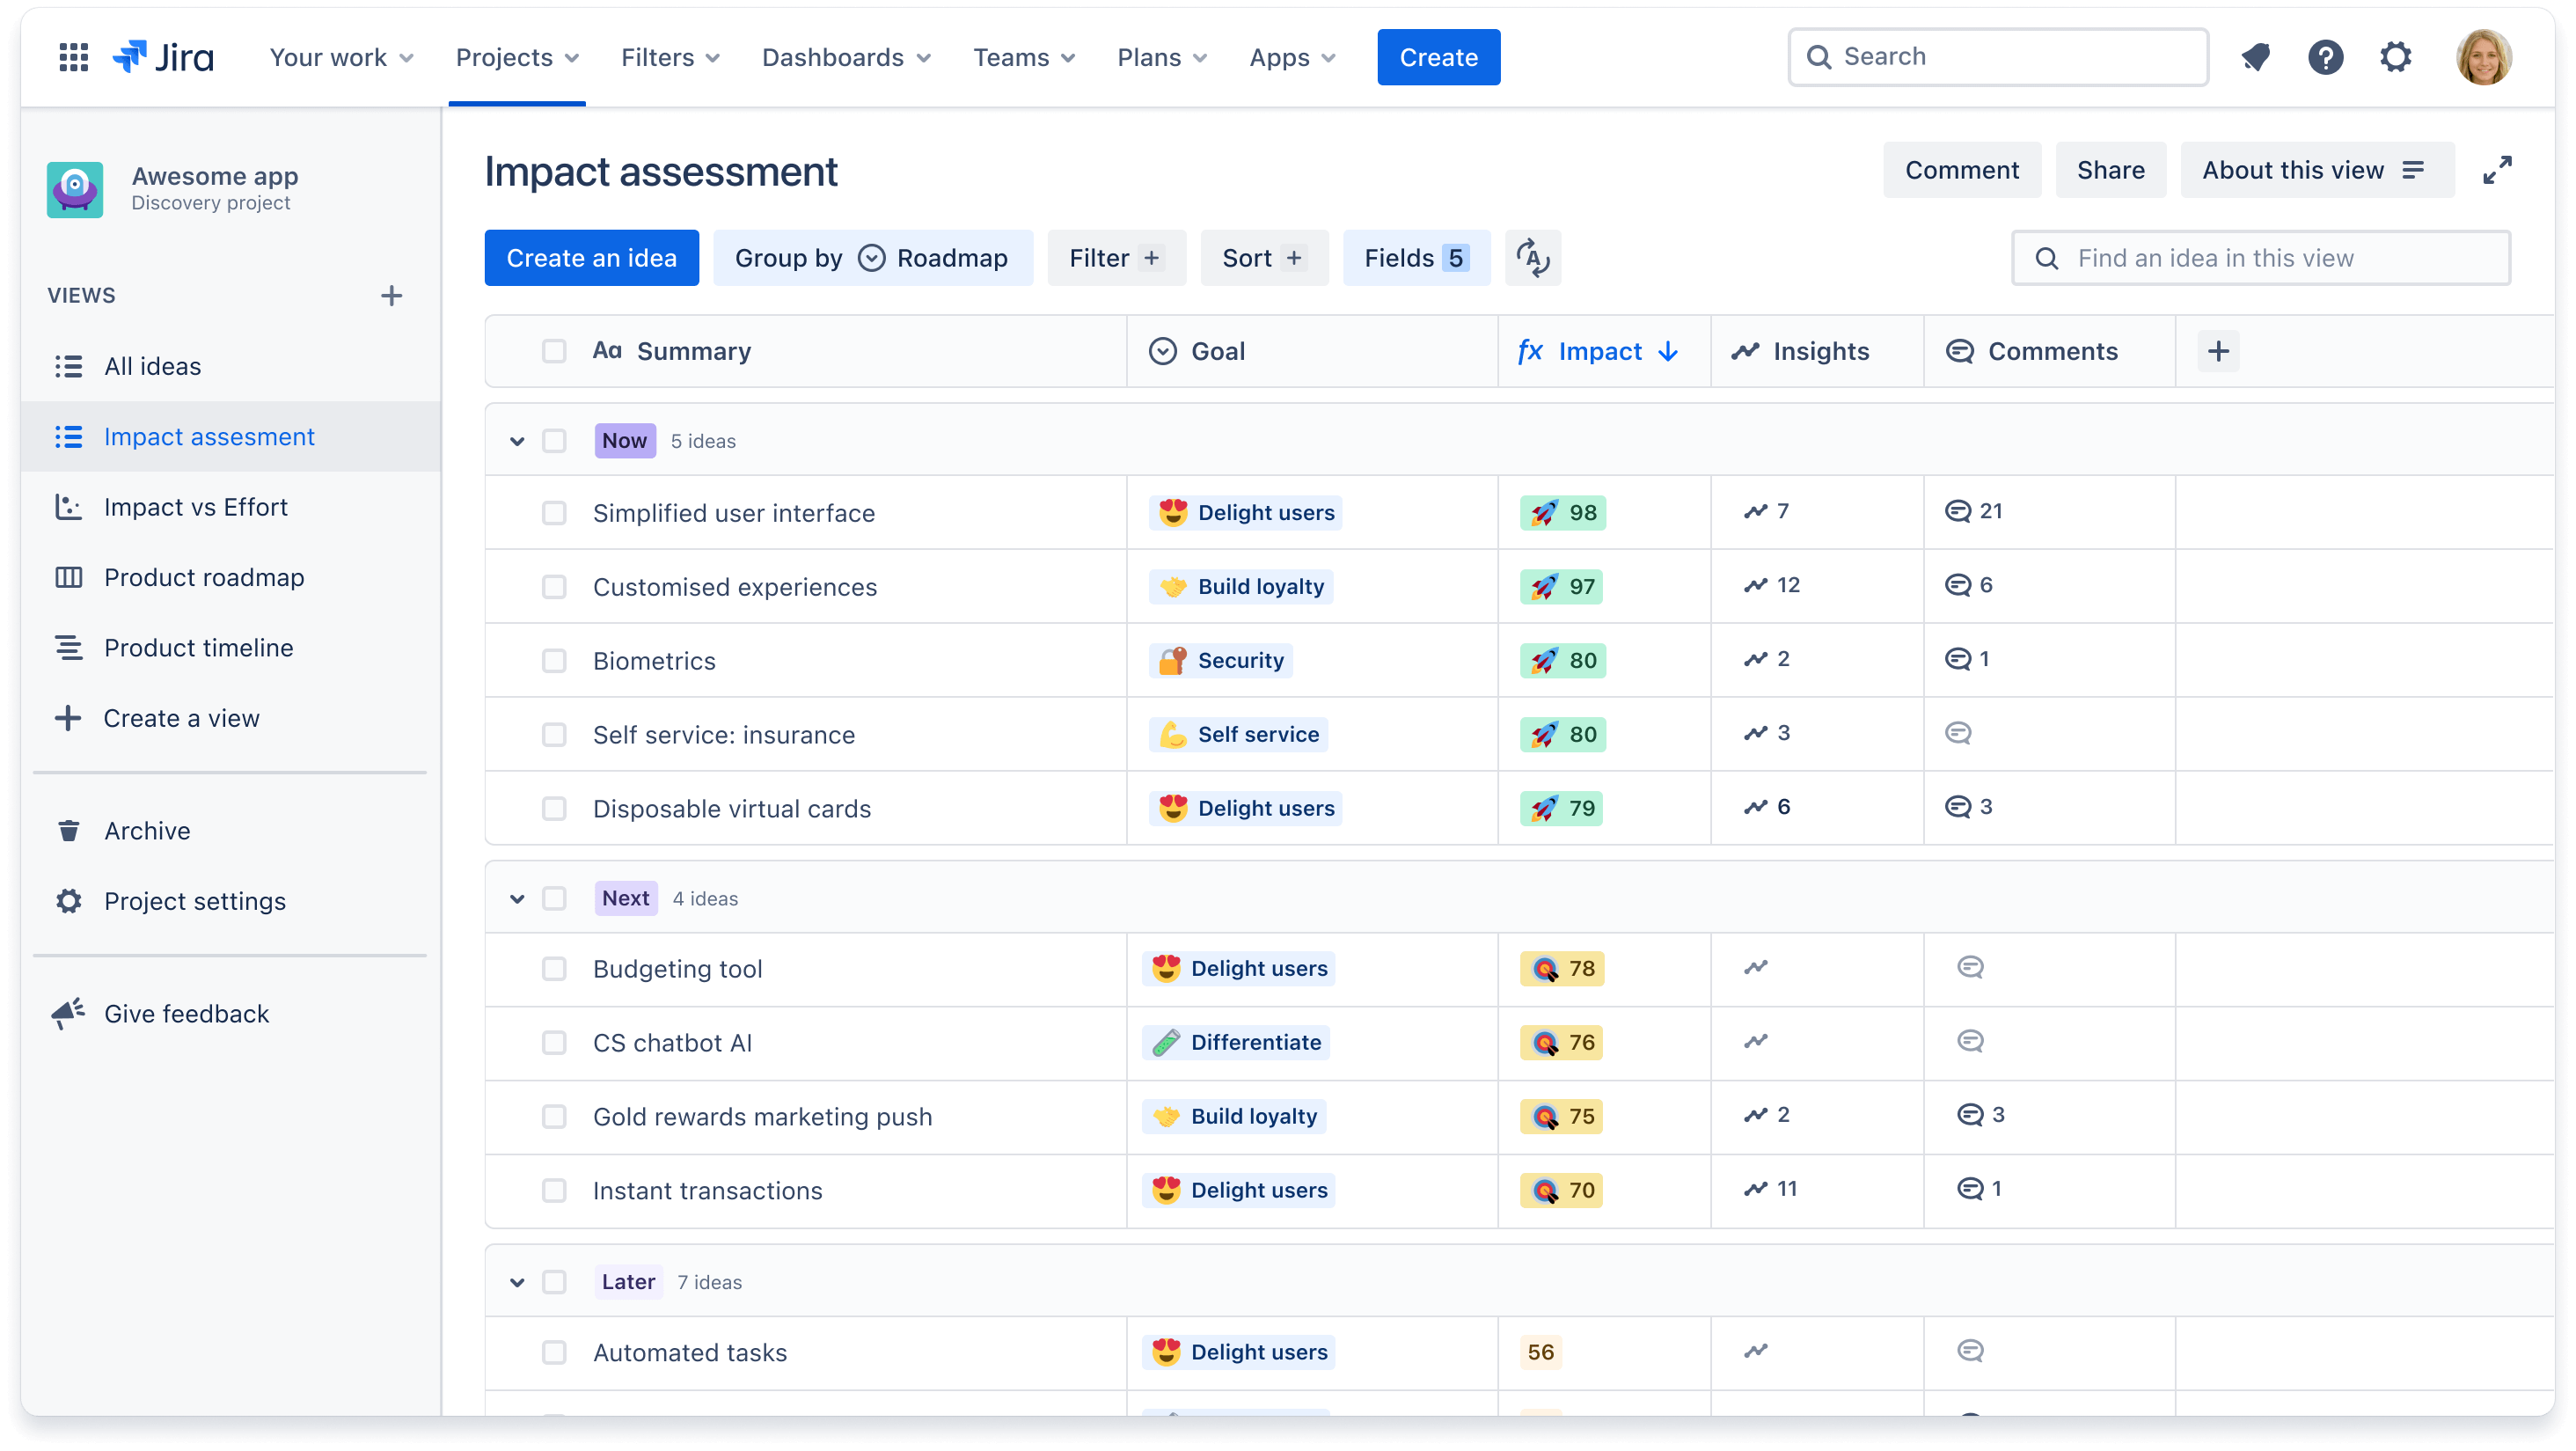
Examples of list views you may create include:
- Impact assessment, with fields like impact, effort, confidence, and impact score to sort ideas based on the impact they’ll have on your business and customers
- RICE scoring, with fields for Reach, Impact, Confidence, and Effort to prioritize ideas based on a custom RICE formula. Here's a guide on Mastering prioritization using RICE.
- Team-specific, where ideas are filtered to only show those associated with Team A, and a separate list view for ideas associated with Team B
- Lightweight capacity planning, with fields like Effort, Team Size and Remaning capacity to quickly where teams have bandwidth. Here's a guide for lightweight capacity planning.
- Planning work for a period (e.g. Quarterly planning), where teams can have clarity on what to focus on and which goals their work is tied to. Take a look at this guide on how to set up a list view for quarterly planning.
-
Delivery progress, with Delivery progress and Delivery status fields to show linked Jira Software epics and issues, and their progress, for each idea. Here's a guide on how to set up a delivery tracker for your work.
What is a matrix view?
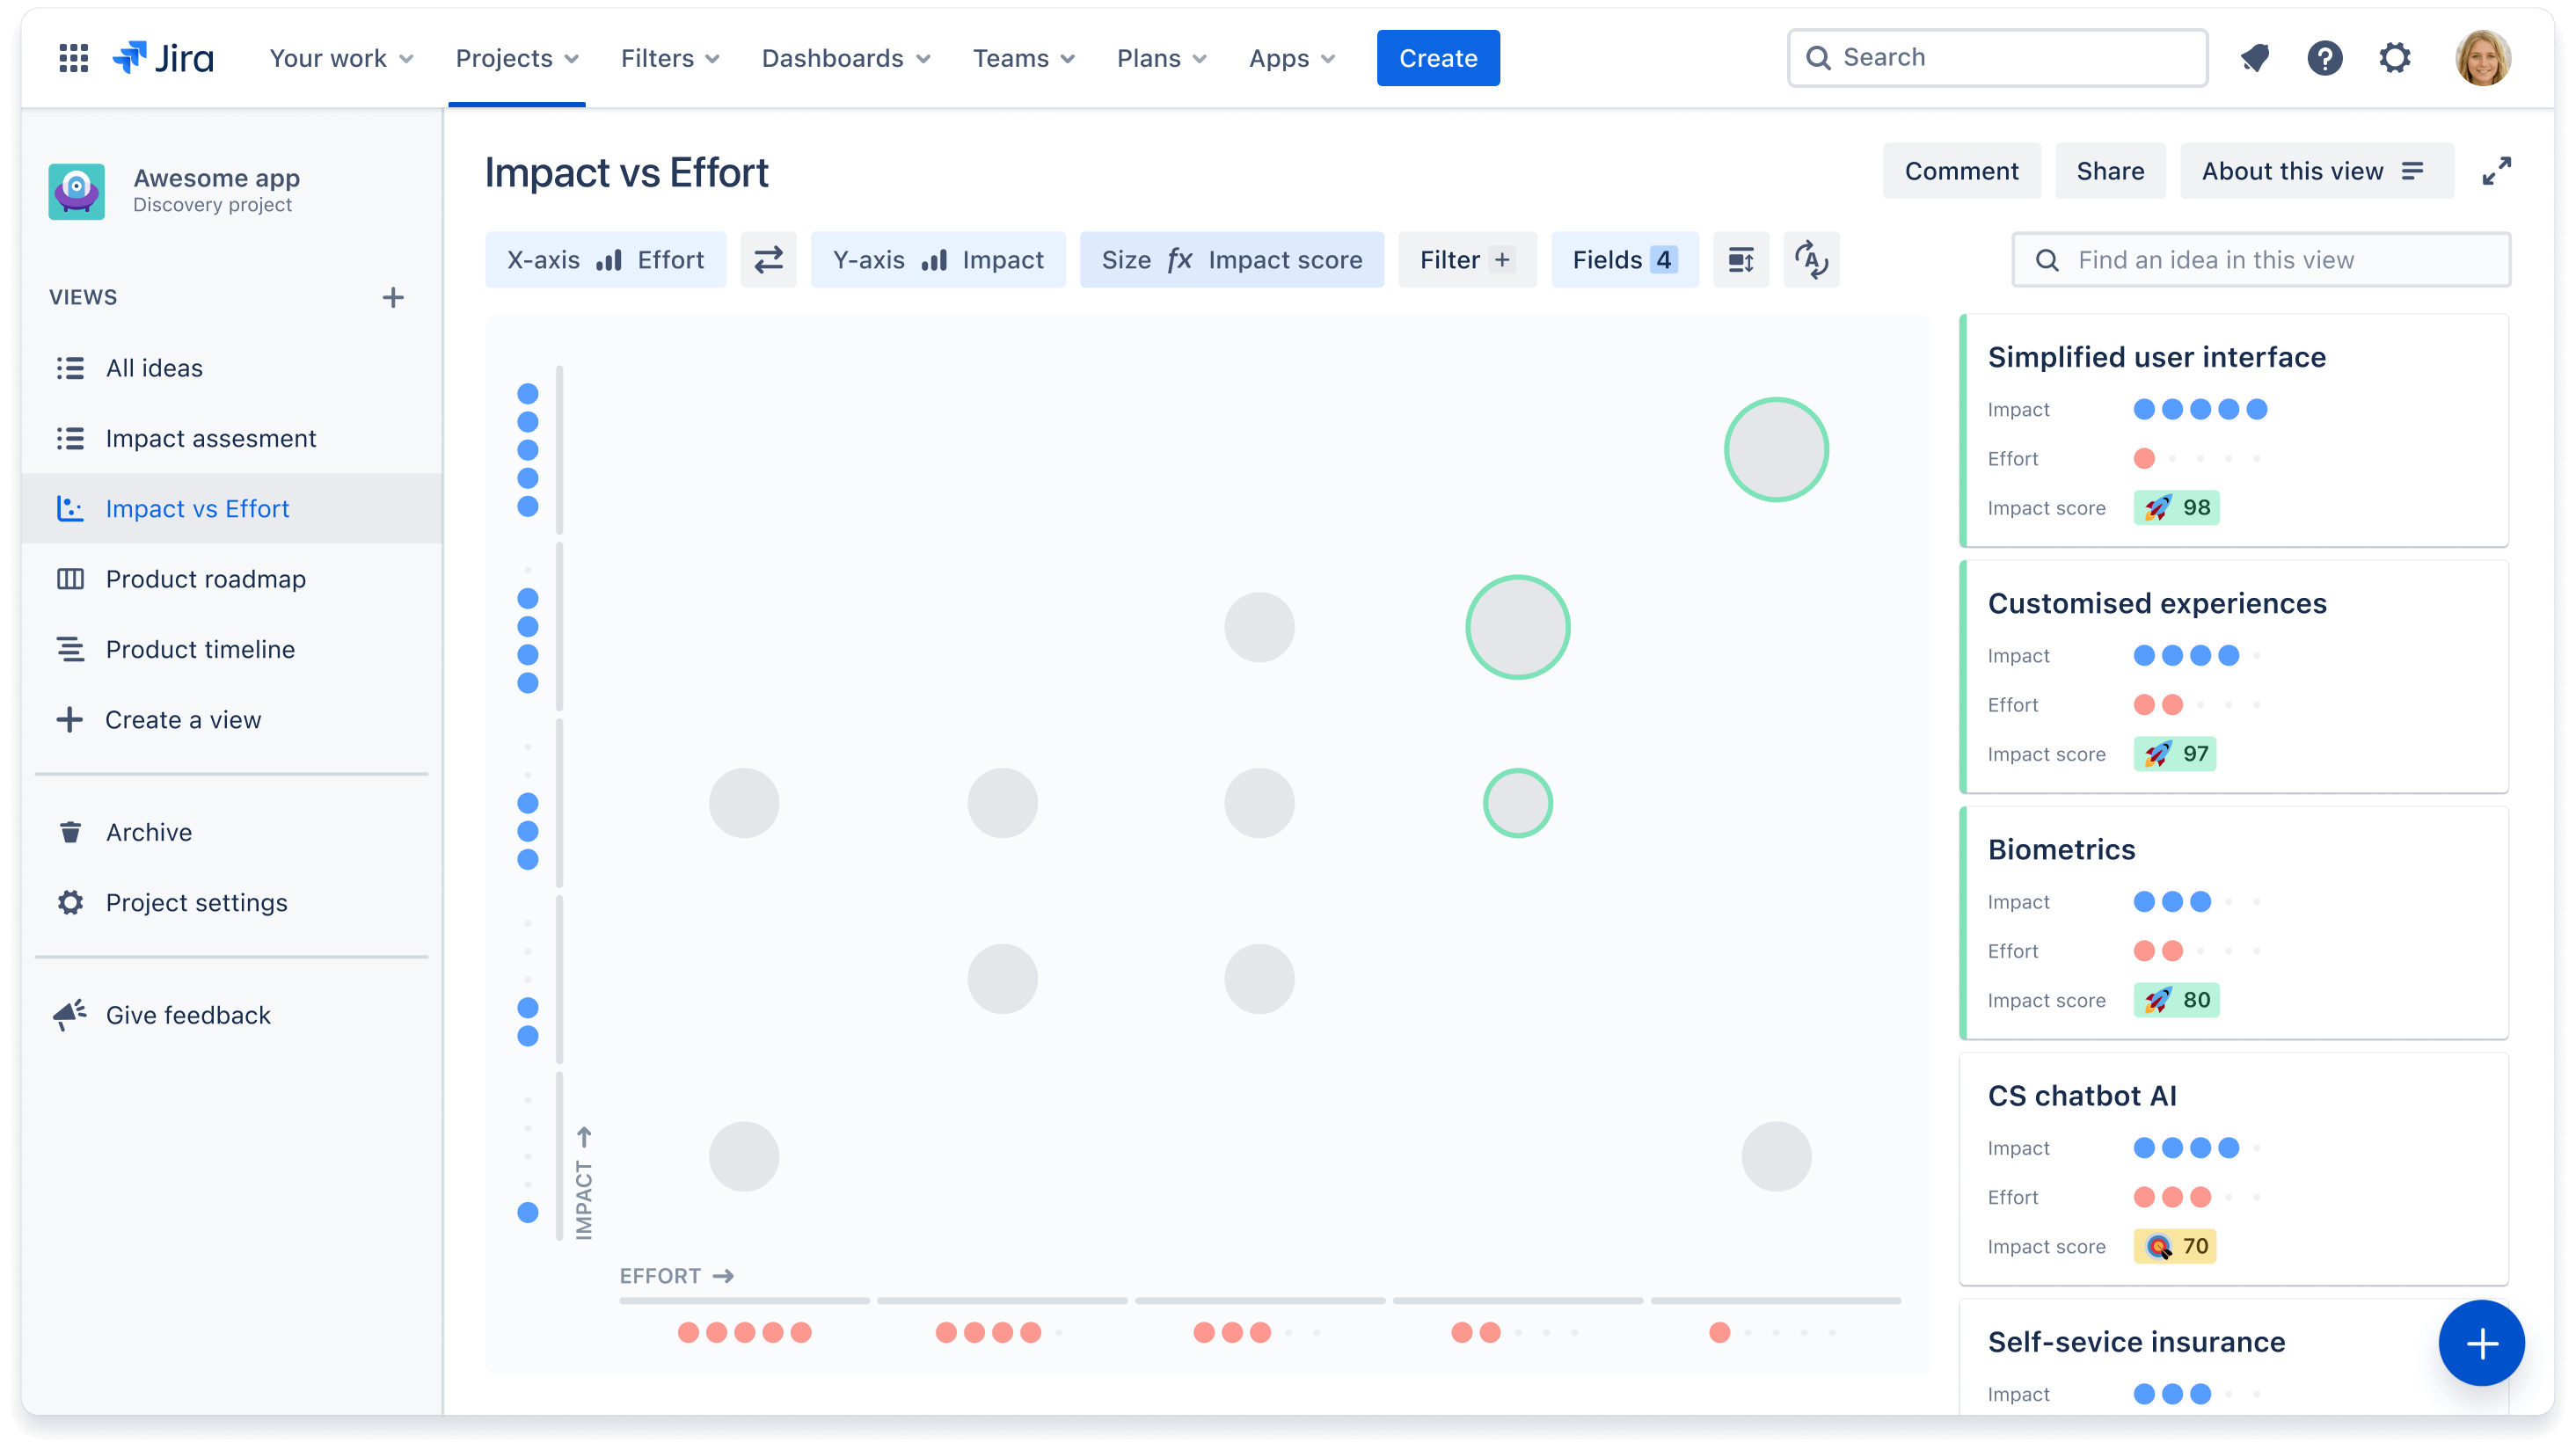
The matrix view offers a visual way to compare ideas across two chosen fields. It is the perfect canvas for prioritization conversations with your team. By placing ideas on the x and y axis, such as impact vs. effort, you can quickly identify which ideas are big boulders versus quick wins.
To add to your visualization, change the size of each idea circle based on an eligible field, such as impact score. The larger the impact, the bigger the circle.
When to use a matrix view
We recommend using this view when:
- You want to quickly show where ideas rank in your prioritization and why
- You want to prioritize ideas based on two key criteria, most commonly Impact vs Effort
You need a canvas to reference for prioritization discussions to talk through opportunities at a high level
What is a board view?
Once you’ve prioritized your ideas, it’s time to communicate your plans out to the business. Instead of static presentations and endless meetings, you can share always-up-to-date roadmaps, and the board view is our perfect form of a roadmap. Board views categorize ideas into columns and let you easily tailor information to your audience by layering more or less data points for added context.

When to use a board view
A board view is best used when you don’t want to focus your conversation around anything time-based. We recommend using a board view when:
- You want to focus on what you’re committing to versus when you’re committing to them
-
You want to tailor information to your audience by grouping ideas into buckets (e.g. swimlanes) or layering in data points to communicate your strategy visually
Some examples of board views you may create include:
- Using the “Roadmap” field to organize ideas by Now, Next, and later
- Using the “Quarter” field to organize ideas by Q1, Q2, Q3, and Q4
- A leadership-specific view that groups ideas by “Company goals” to show which ideas ladder up to each goal. Here's a guide on how to create a roadmap for leadership.
-
A product team-specific view that groups ideas by “Team” or “Squad” to show which ideas will be owned by which team
In the board and timeline view, change the layout of cards to show more or less information. Click on the Fields + button and select which fields to toggle on or off.
What is a timeline view?
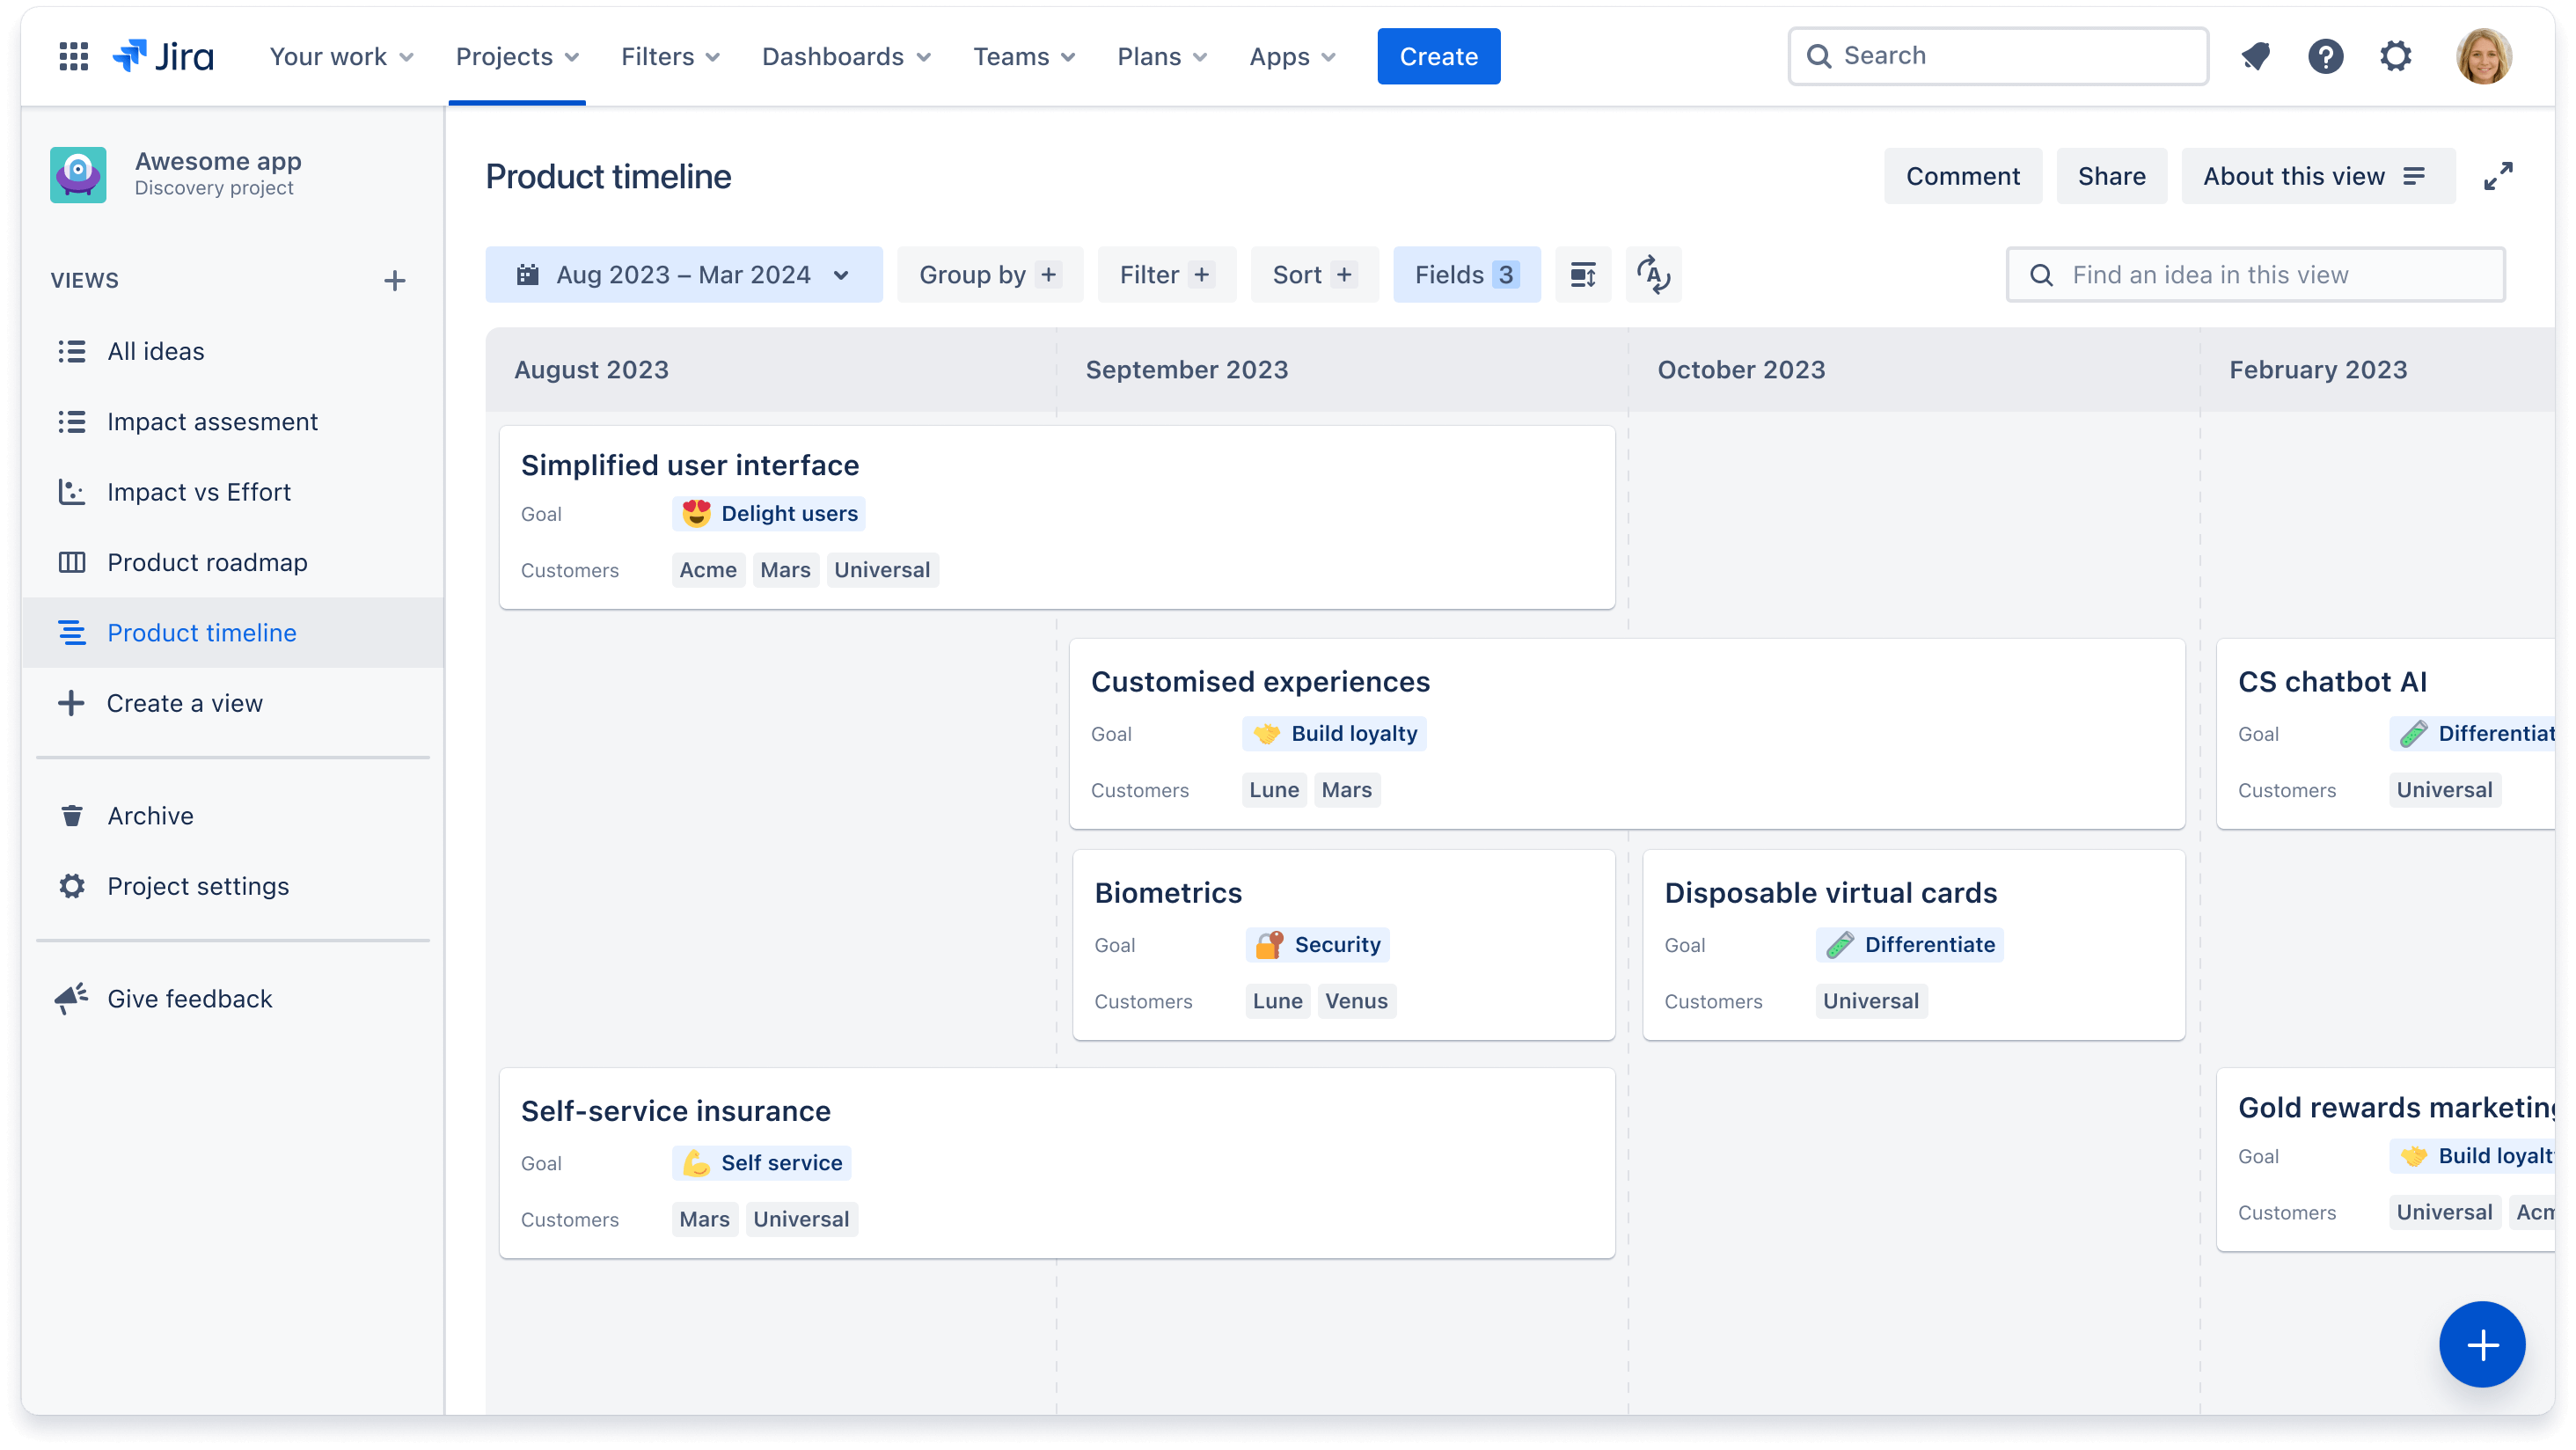
While some teams prefer roadmap discussions without a specific focus on timing, other teams need more detail about when certain features are going to ship. The timeline view displays ideas across a monthly or quarterly timeline. You can easily modify dates in this view by dragging cards to your desired timeframe.
When to use a timeline view
We recommend using a timeline view when you need to communicate rough estimates of delivery dates, in months or quarters, back out to the business. This can also help teams that may be dependent on ideas shipping to plan their own roadmap.
Similar to the board view, some examples of timeline views include:
- A sales-specific view that groups ideas by “Customer segment” to show which ideas have been requested by certain customer groups
A team-specific view that groups ideas by “Squad” to show which ideas will be worked on by which team or squad
How do I create and manage a view?
To create, edit, and manage views, you must be in a Creator role. To create a view:
- Navigate to your lefthand navigation and click + Create a view
- Select a view type or create a new section to organize a set of views.
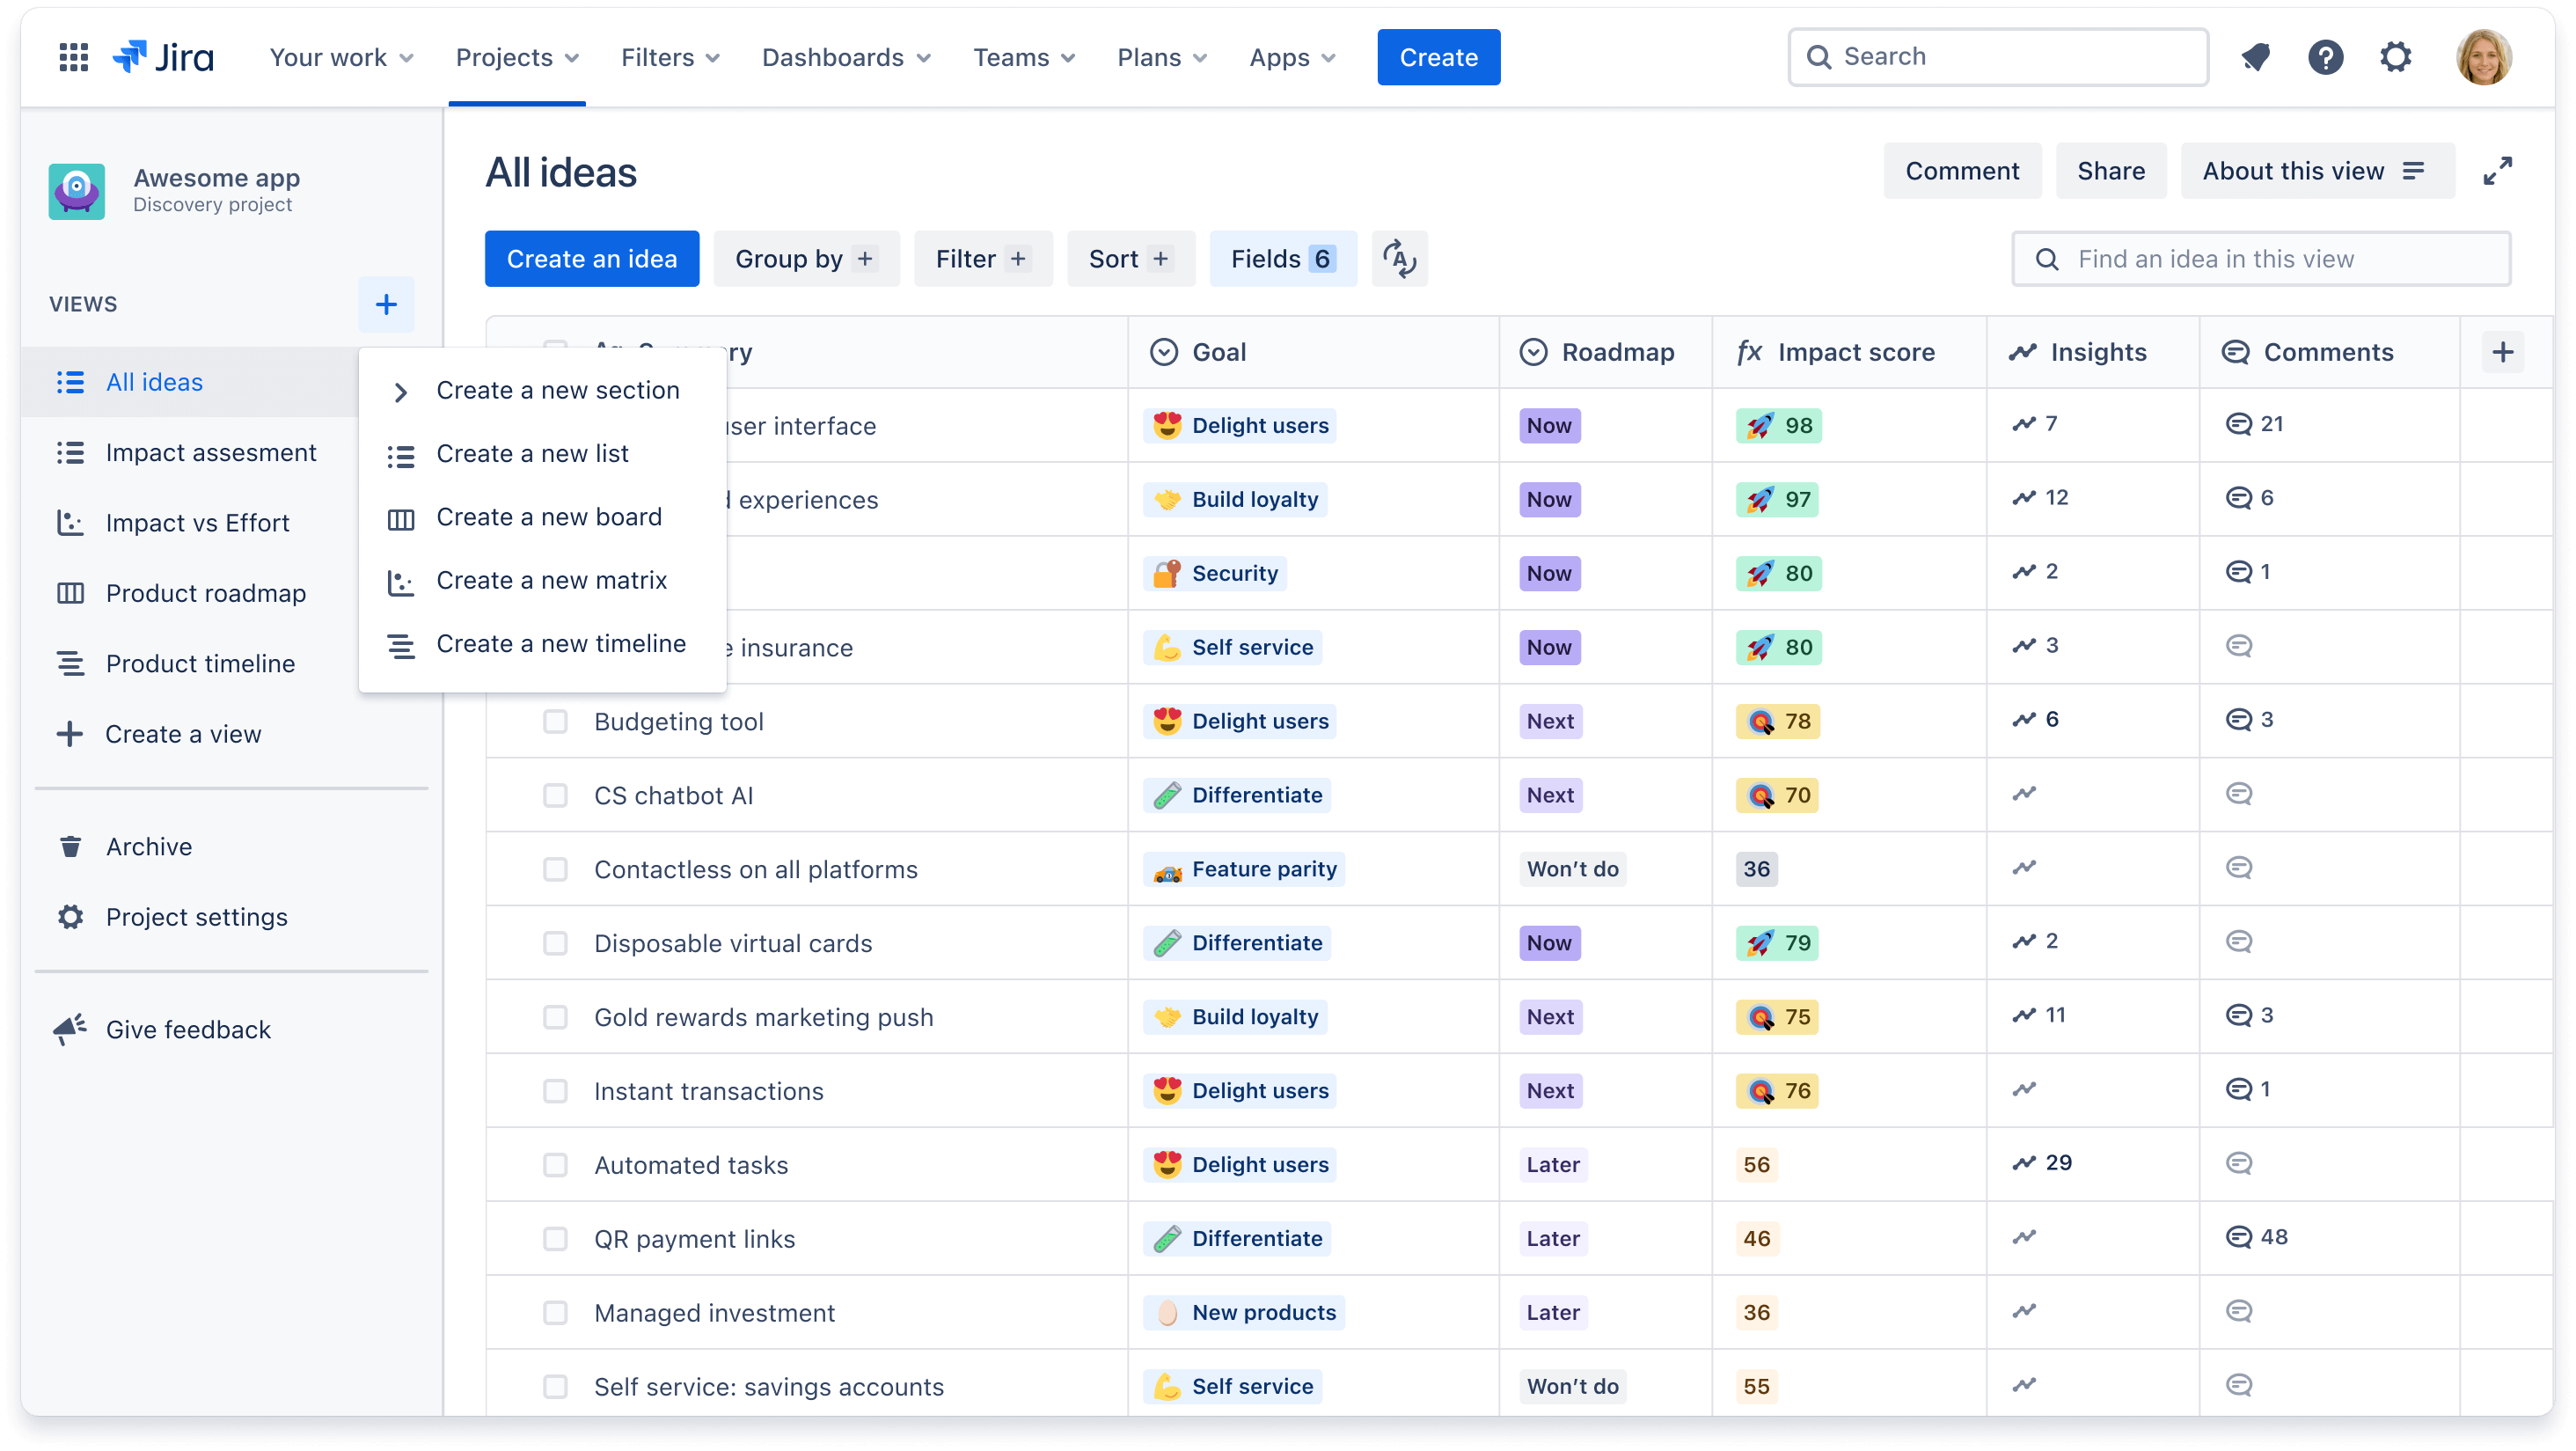
To keep your lefthand navigation organized, create sections (i.e by team or product) to house multiple views in an expand. Click on + Create a view and select Create a new section.
Did you know that you can comment on a whole view? This is best for when stakeholders have overall feedback or questions on a specific view. Learn how to comment on a view.
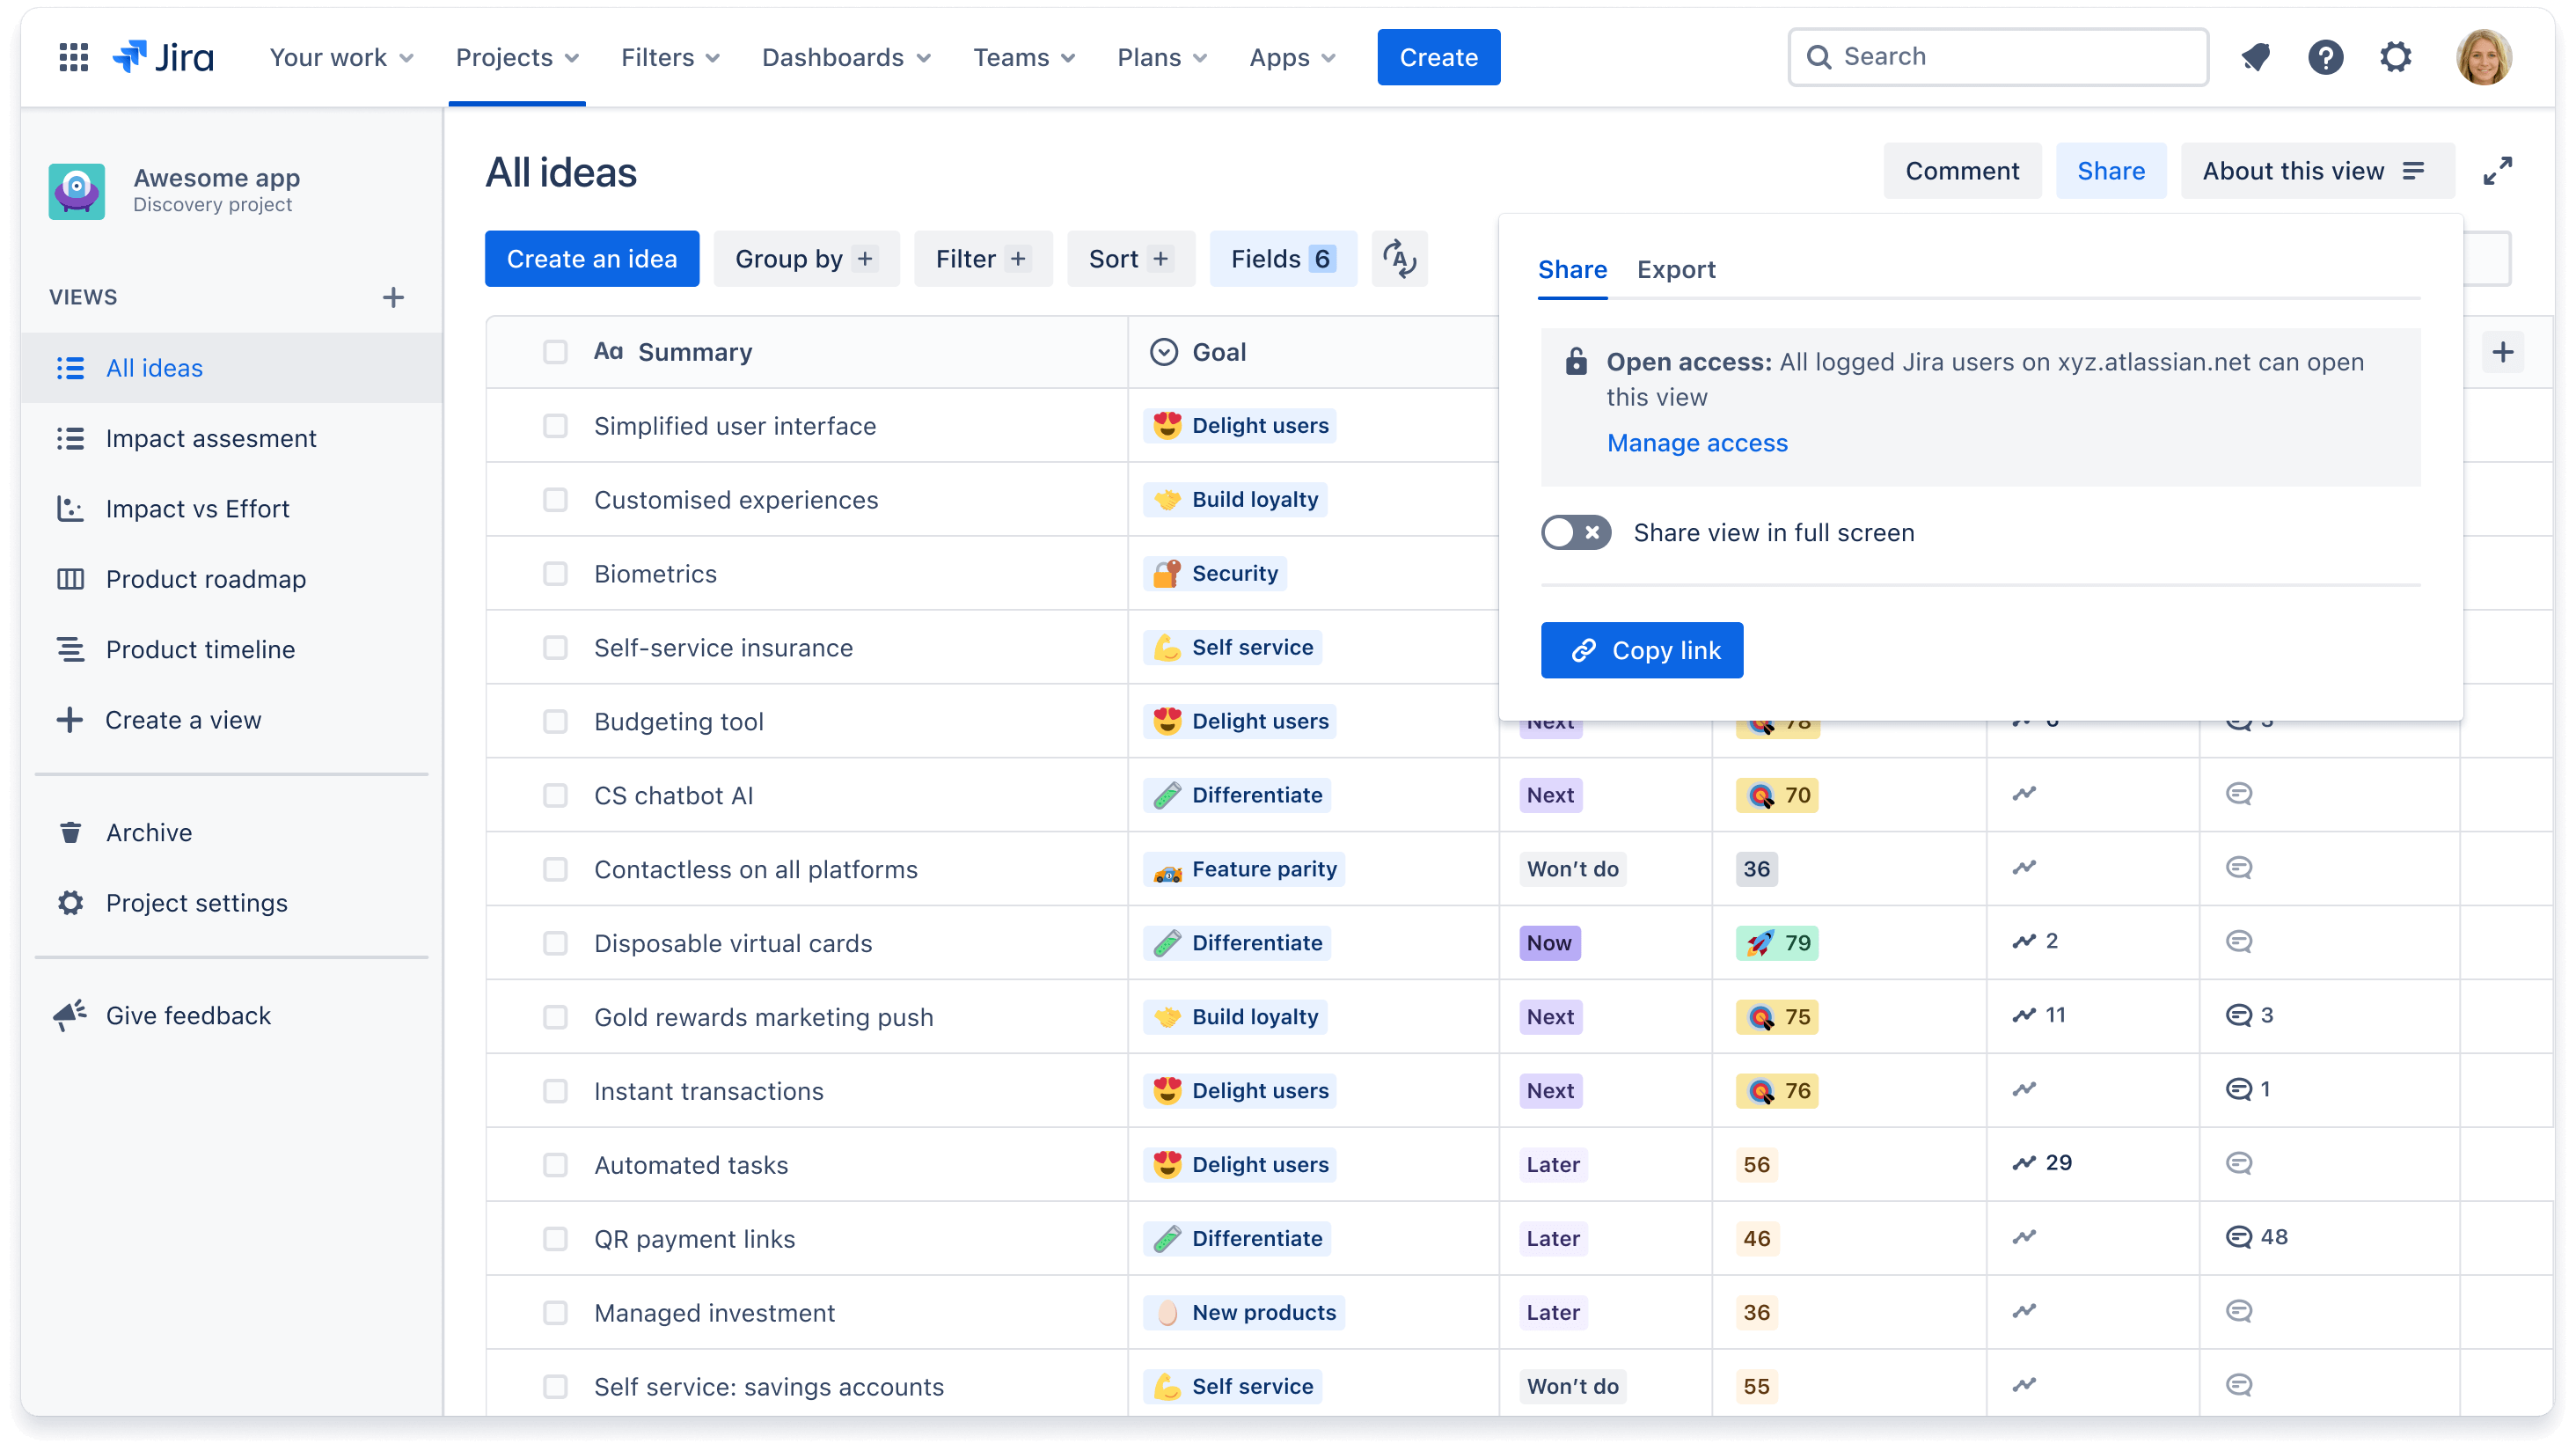
Sharing and exporting views
The main benefit of creating multiple views is being able to easily share them with your teammates or external stakeholders.
To share a view with your team (e.g. those who have access to your Jira site or other Atlassian Cloud products):
- Click on Share in the upper righthand corner of your screen
- Click the blue Copy link button and share an always-up-to-date link with your peers or export a static version of the view as a JPEG or CSV file
You can also embed these views into Confluence (watch a demo!), for example in a strategy document, so you can tell a story around your roadmap.
Visit our documentation for step by step instructions on exporting data into a CSV or gsheet.
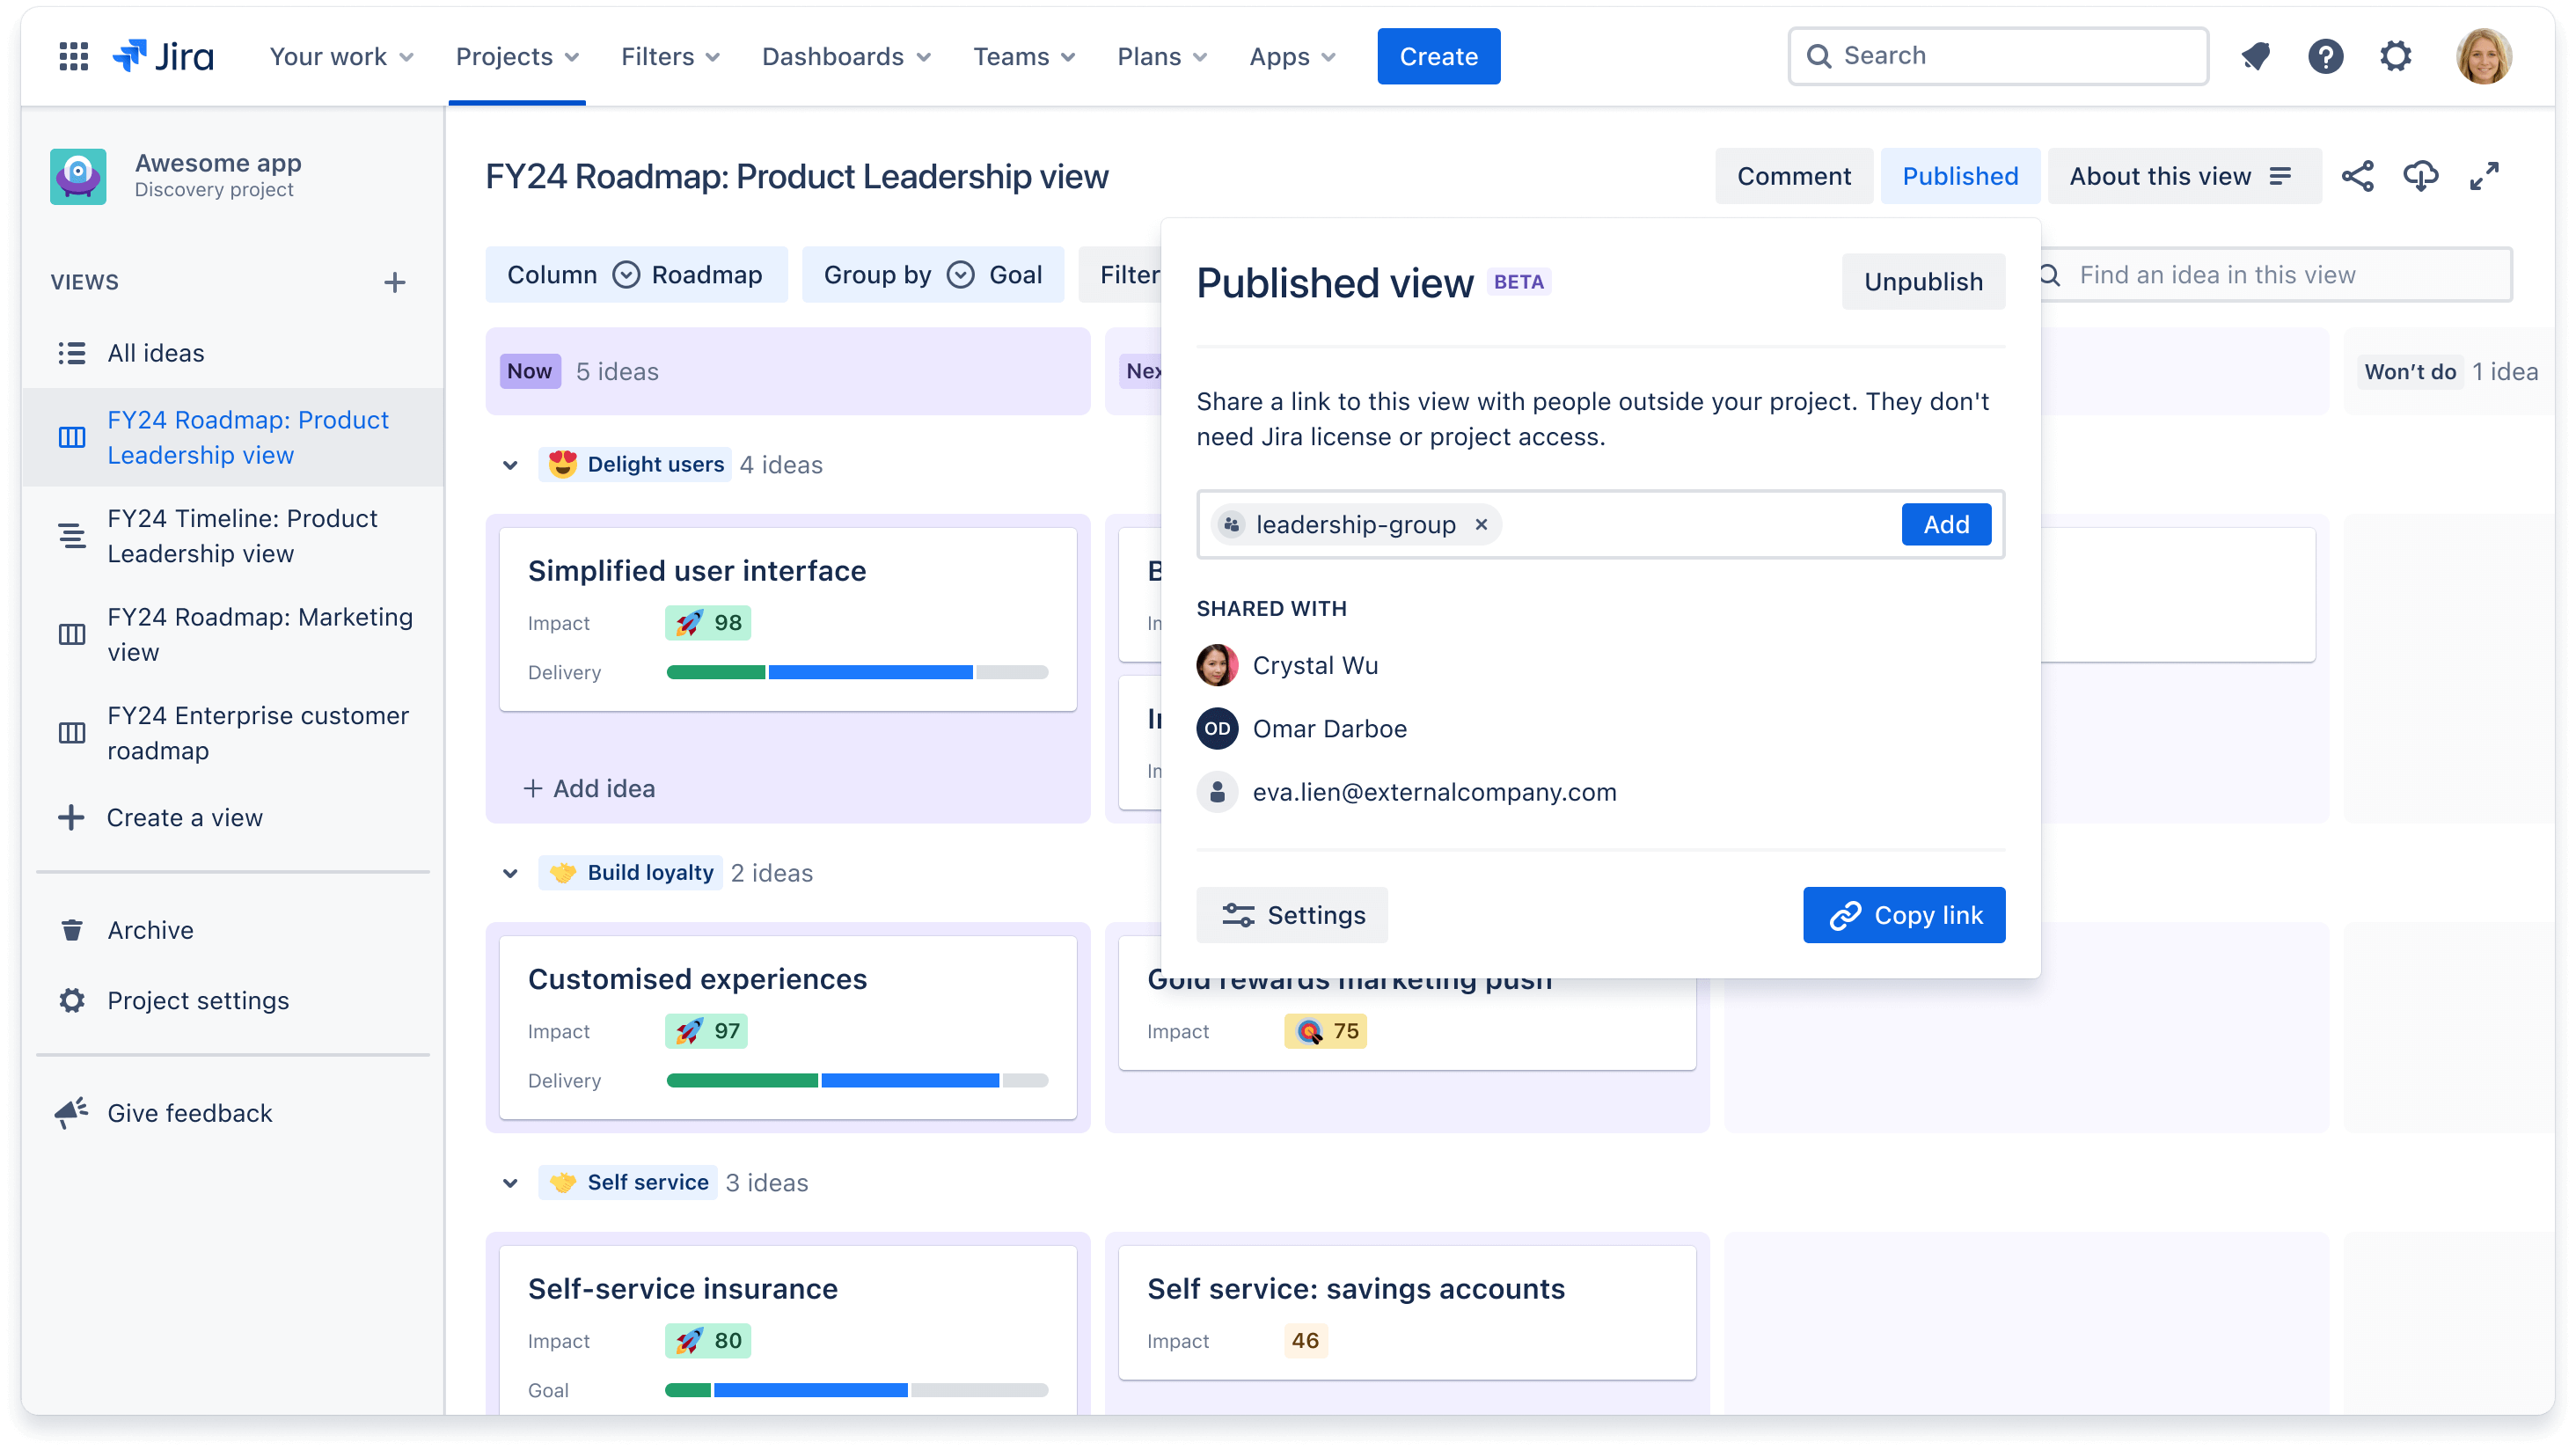
To publish a read-only view to those who don’t have access to Jira or another Atlassian product (e.g. senior leadership or customers):
- Click on Publish in the upper righthand corner of your screen
- Add specific email address or team aliases you wish to share with
- In the bottom left, click Settings, to configure which fields you want visible to your stakeholders
- Click Copy link to copy the published URL and send it out via email or messaging app
If you're a Creator and don’t see the Publish button, ensure your project admin has enabled permissions. Learn more about publishing views here.
Importing data into a view
To move information from one tool to another, or to consolidate into a single source of truth, you can import data into a view. There are two methods to import data:
- Import existing Jira issues into Jira Product Discovery - To import existing issues you can either do a bulk move or import using CSV file. Visit our documentation for step by step instructions.
- Import ideas from a CSV file - If you’re importing ideas from another software like Gsheets, Productboard, or Aha! you should use a CSV file. Follow these guidelines to import using this method.
How do I customize views?
The main reason to customize a view is to tailor the information presented for a specific purpose or a specific audience, like a view to show how ideas ladder up to each company goal.
Once you’ve added fields to your views, there are three ways in which you can further customize your view to present data in a way that you want: filtering, grouping, and sorting.
Filtering views
Filtering lets you hide ideas from a view. You can filter by a “Team” field to only show ideas that are assigned to Team A, or you can filter by an “Initiative” field to show all opportunities that are being evaluated for a stream of work.
To filter a view:
- Click the Filter + button at the top of your screen
- Click + Add a filter and choose any field you wish to filter by
- Tick the box for each field option you’d like to be visible. You can also filter by multiple fields
Grouping views
Grouping ideas allows you to visually bucket multiple ideas together based on a field. You can group all ideas by assignee or group ideas by a stream of work to act as a swimlane. When you group ideas, you can also hide or expand groups to declutter and organize your view.
To group ideas in a view:
- Click the Group by + button at the top of your screen
- Click the Select a field dropdown and choose any field you wish to group by
- You can choose to hide empty groups or hide a field option
Sorting views
Sorting ideas let’s you compare ideas, ascending or descending, based on a specific field. For example, you may want to see the most requested ideas by using the Votes field to sort descending. You can also add a second layer of sorting with another field.
To sort ideas in a list view, hover over the title of any field column, and click the 3 dots to choose ascending or descending. For any other view type:
- Click the Sort + button at the top of your screen
- Click Select a field and choose a field
- Click the arrow to the right for ascending or descending