

Reporting in Jira
Deliver value to customers faster with real-time insights at your fingertips. Jira enables teams to make data-driven decisions with agile reports, dashboards, and more.
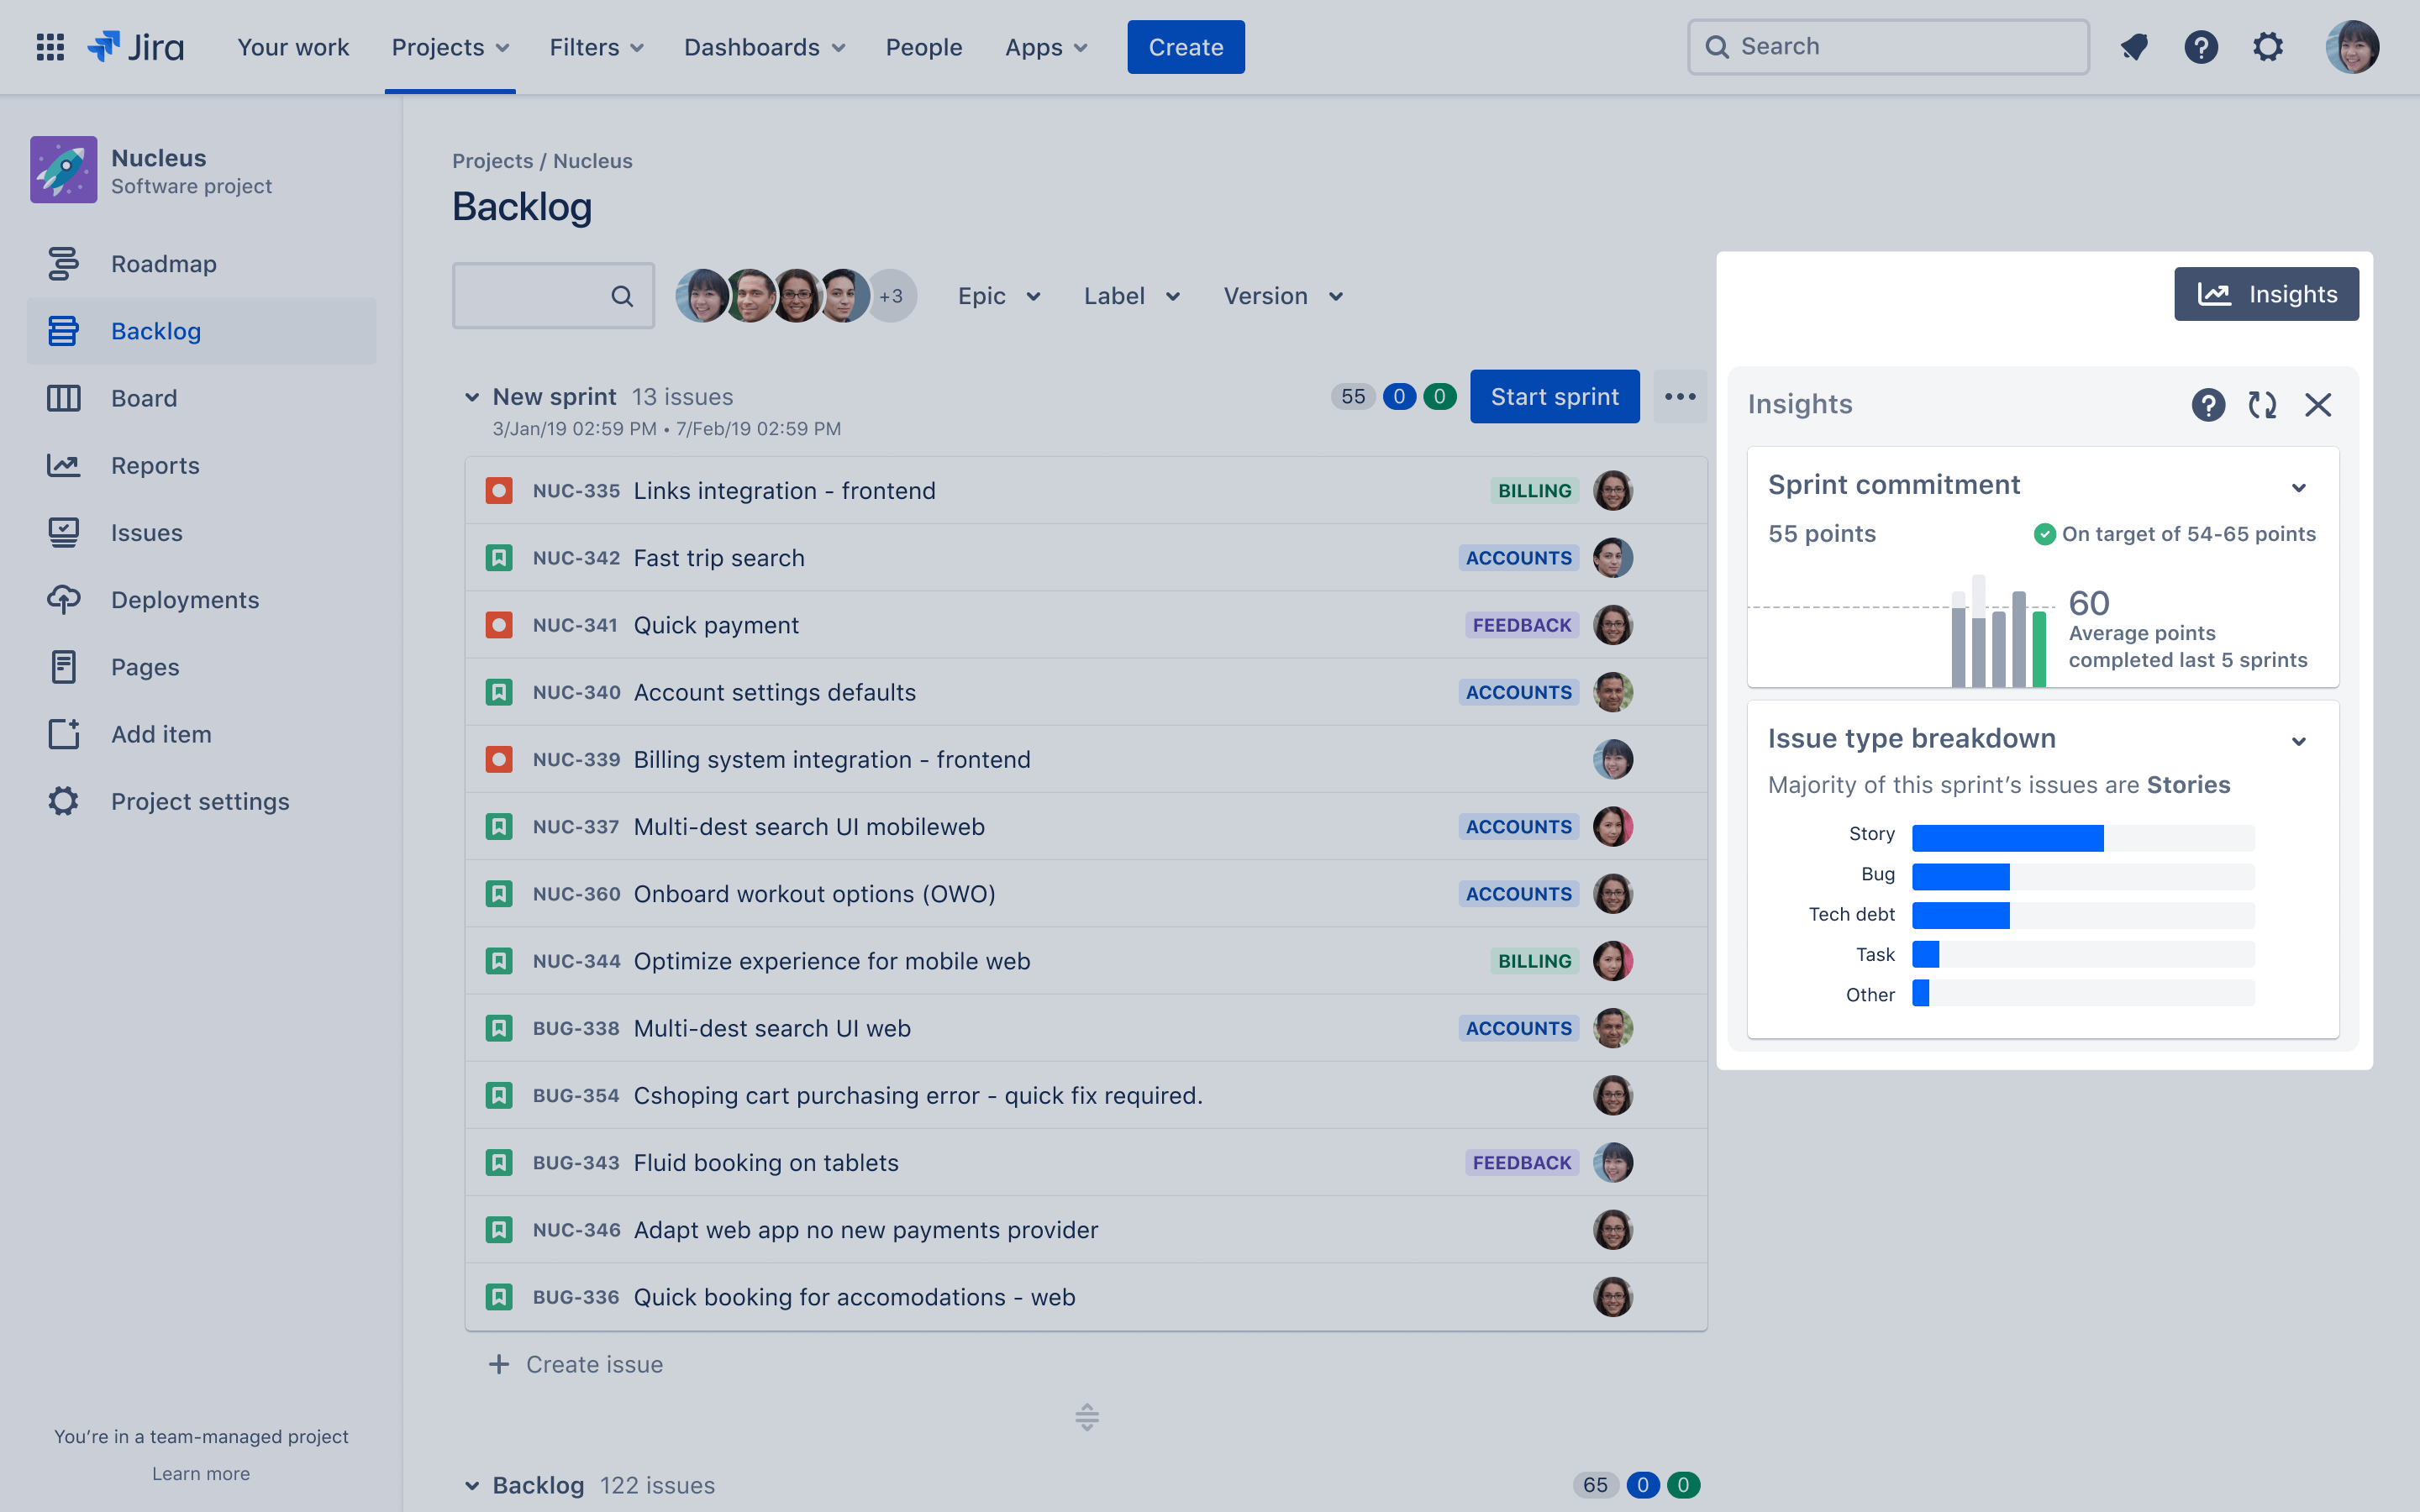
See insights in the context of your work
As you plan
During your sprint
When you ship
Improve delivery and performance with agile reports
Reports in Jira offer critical insights for scrum, kanban, and any agile methodology in between.
Reports for scrum teams.
Stay on track of sprint goals and improve retrospectives with data scrum teams can put to use sprint over sprint.
Sprint report
Determine overcommittment and excessive scope creep and understand completed work in each sprint.

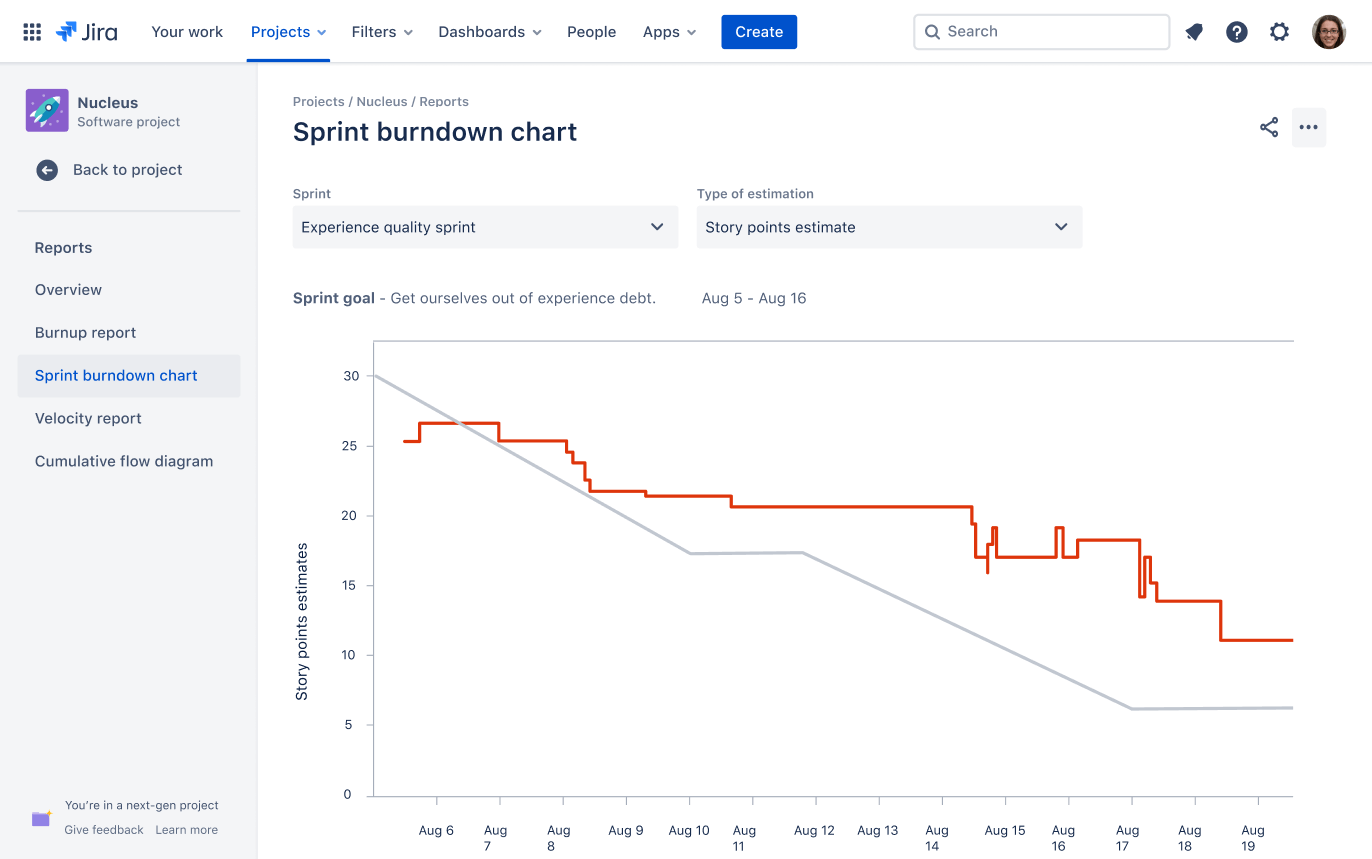
Burndown chart
Track progress towards sprint goals to manage progress and respond accordingly.
Release burndown
Track and monitor the projected release date for versions and take action if work is falling behind projected schedule.
Velocity chart
Track work from sprint to sprint to helps teams determine the velocity and better estimate the work a team realistically achieve in future sprints.
Optimize kanban flow for continuous delivery
Better predict future performance and spot bottlenecks with agile reports for kanban teams.

Cumulative flow diagram
Easily spot blockages by seeing the number of issues that increase in any given state.
Control chart
Determine future performance with cycle and lead times for your product, version, or sprint.
Work management made easier with Jira reports
Identify trends and work smarter, with out-of-the-box reports for issue analysis and forecasting in Jira.
Issue analysis

Average Age Report

Created vs Resolved Issues Report

Pie Chart Report

Recently Created Issues Report

Resolution Time Report

Single Level Group By Report

Time Since Issues Report
Forecast & management
Time Tracking Report

User Workload Report

Version Workload Report
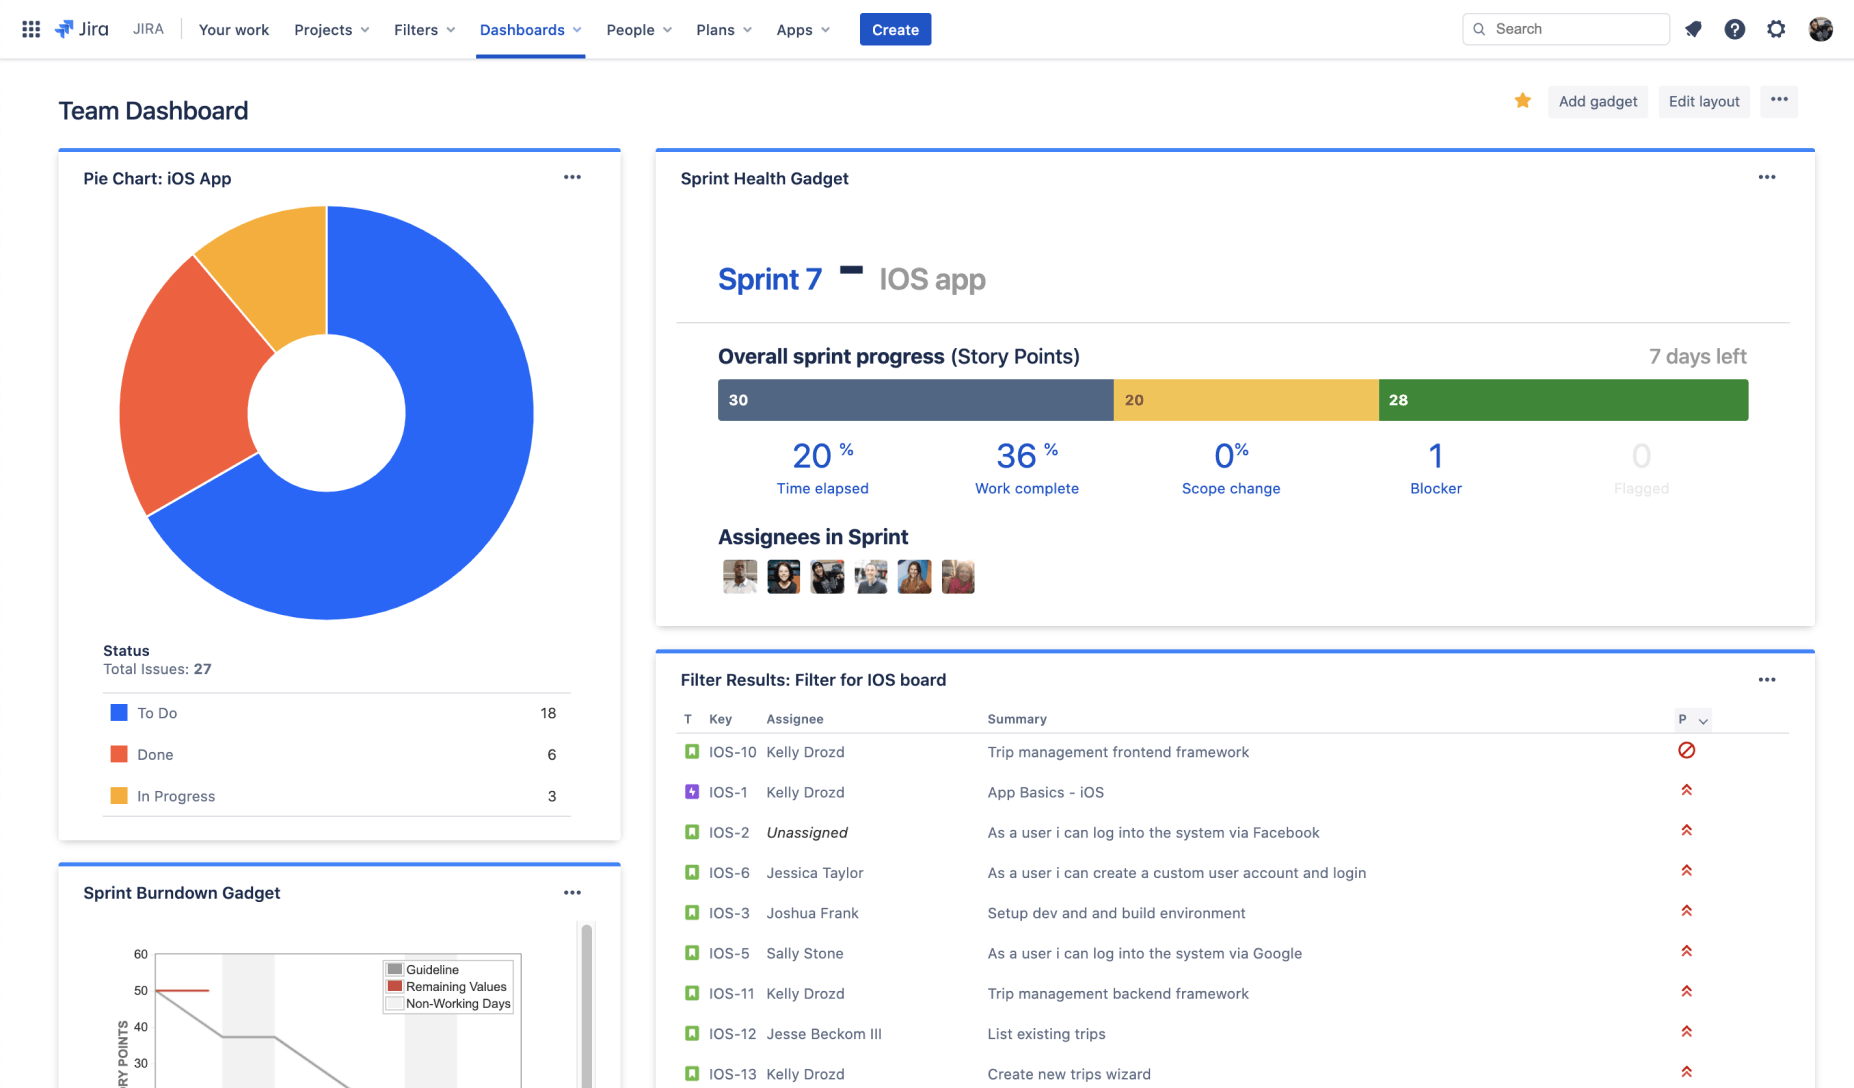
Bring it all together with dashboards in Jira
Organize projects and track achievements in a single view with dashboards in Jira. With dozens of built-in gadgets, easily customize dashboards for teams, stakeholders, and leadership.

Find what you need with the power of search in Jira
With advanced search in Jira, turn work across tasks, projects, initiatives into custom reports that can be saved, shared, or added to dashboards.