Jira Product Discovery views overview
Qu'est-ce qu'une vue Liste ?
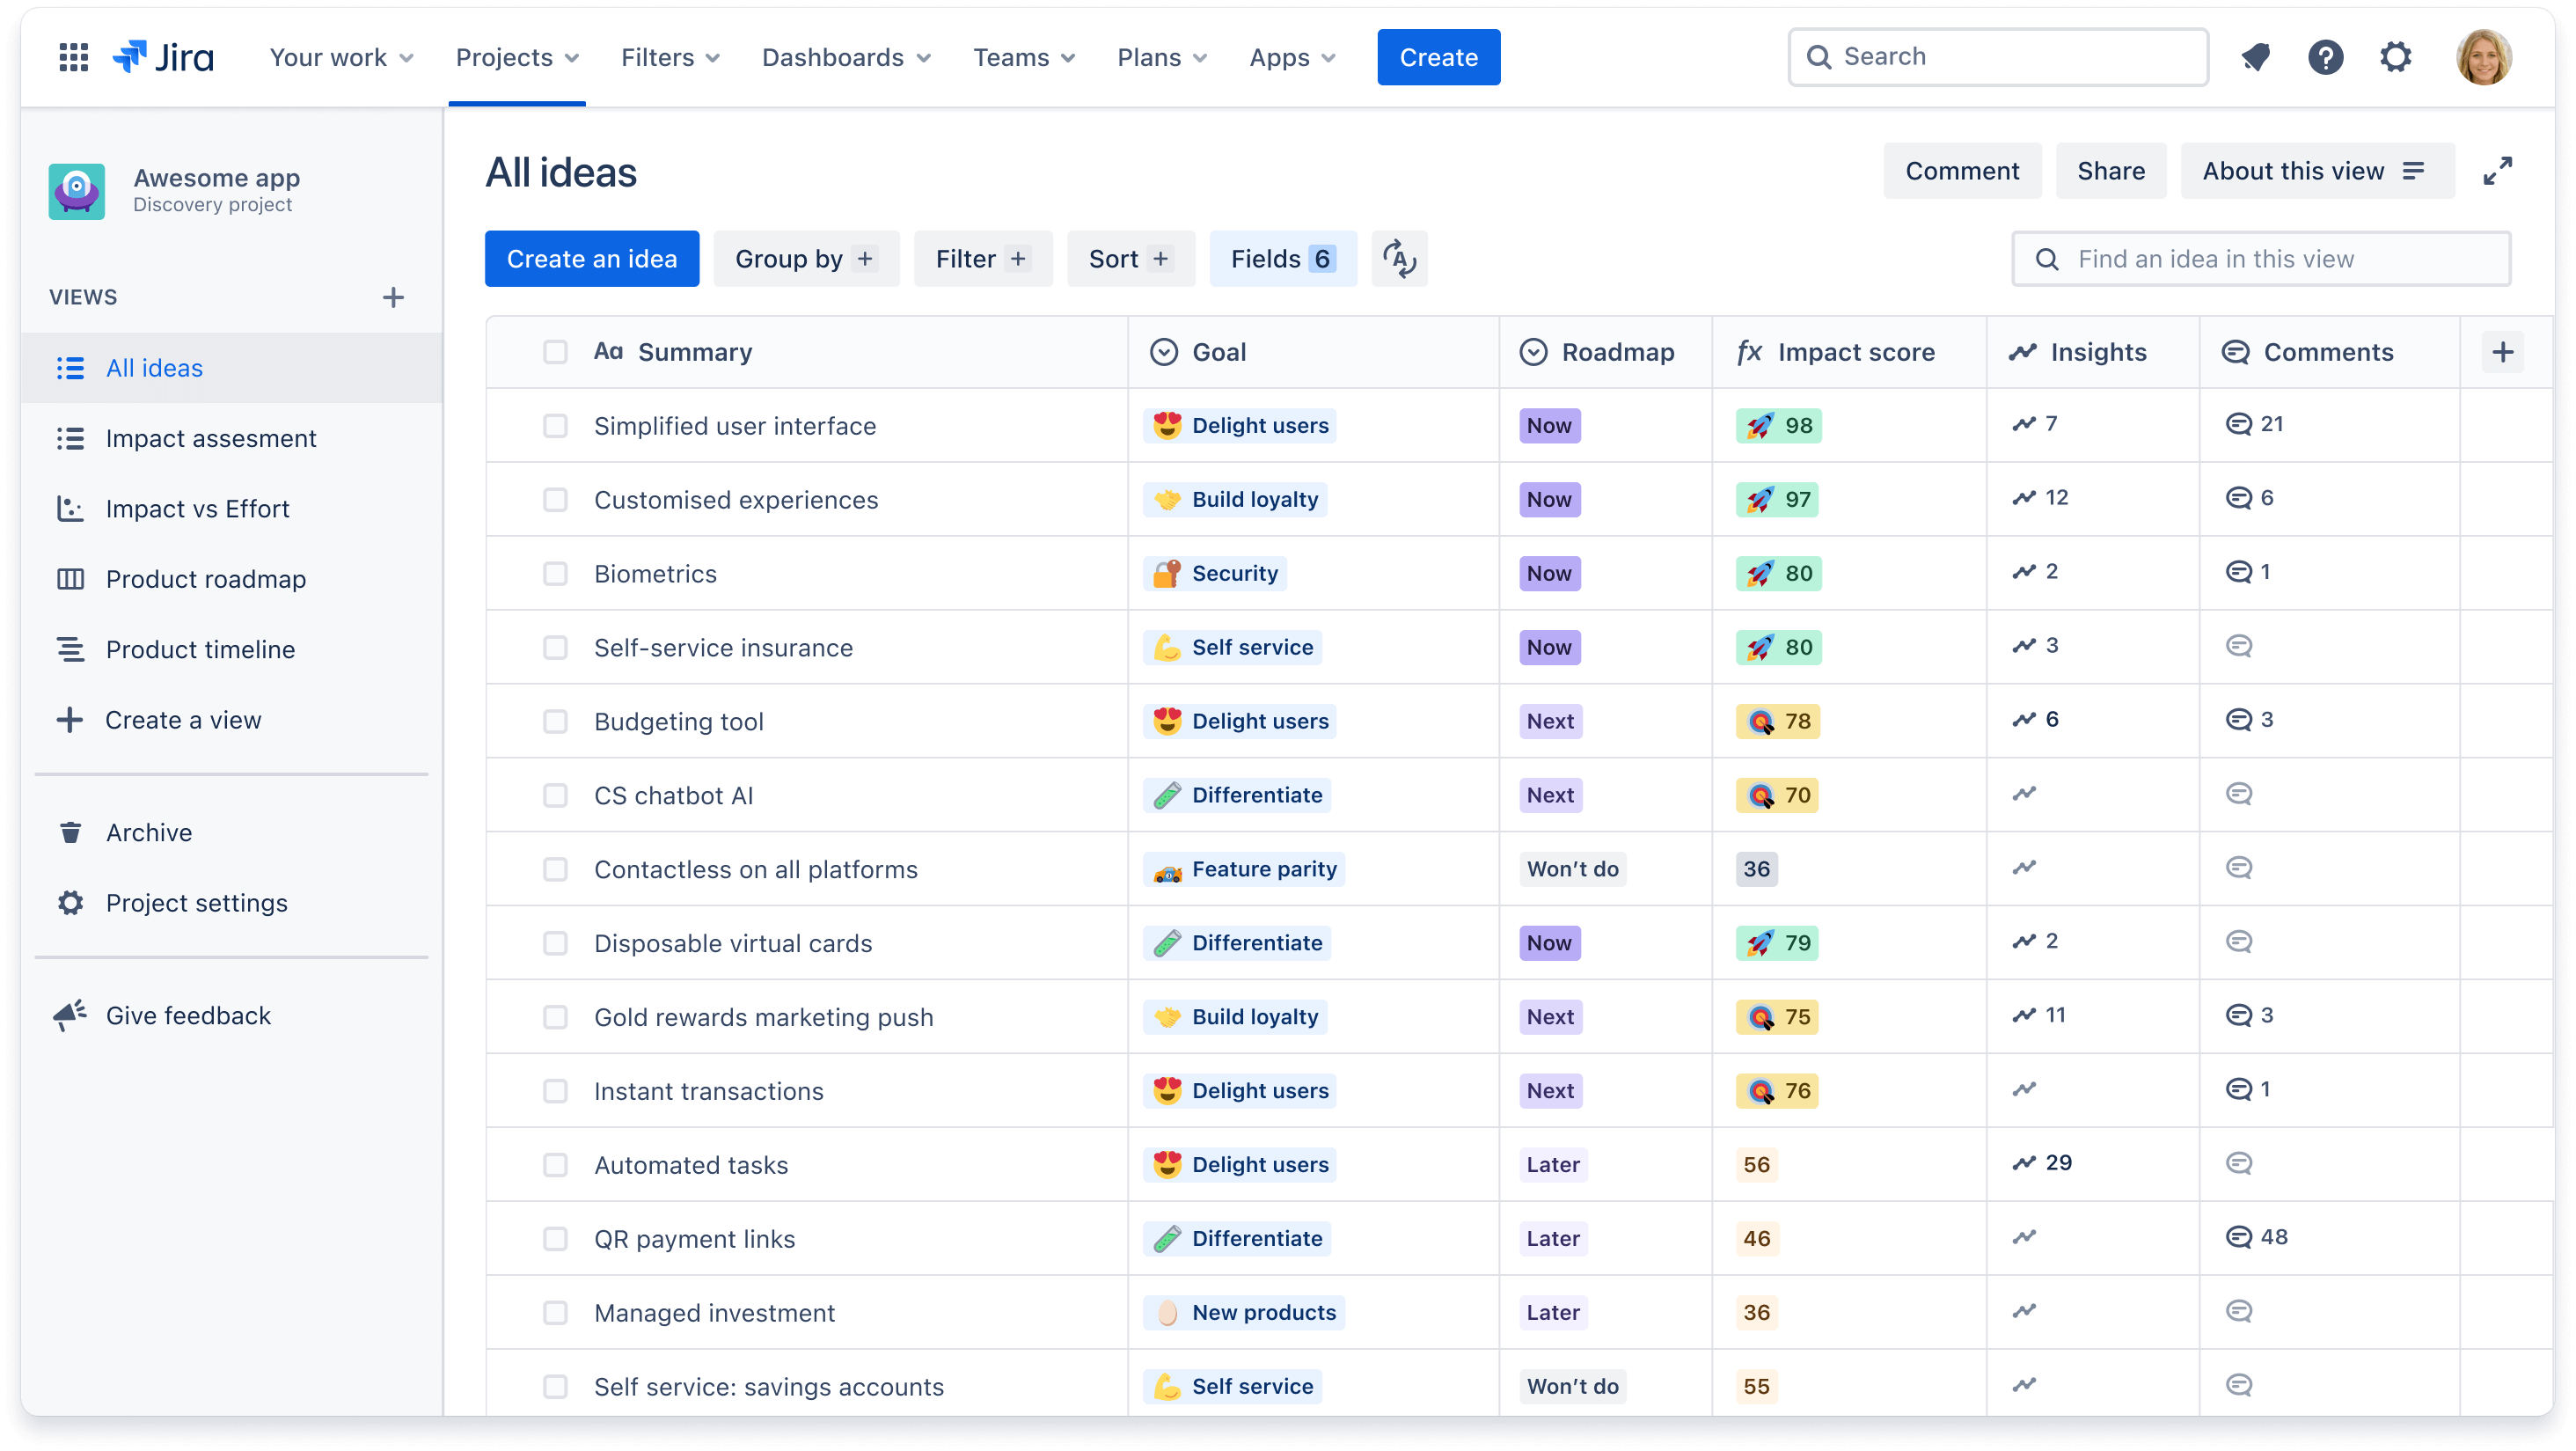
The list view is Jira Product Discovery’s default view. Think of a list view as an extendable spreadsheet. You can put all of your ideas in one place, group them, filter, and slice and dice them in a way that makes sense to you.
When to use a list view
List views are a great starting point to gather ideas in one place and decide which fields you need to organize and prioritize those ideas. We recommend using this view when:
- you need to easily scan a list of ideas and compare them across multiple fields
- you need to sort ideas ascending or descending based on a field and see their positioning
you need to group ideas based off a field you select, such as ‘Goal’ or ‘Team’
Examples of list views you may create include:
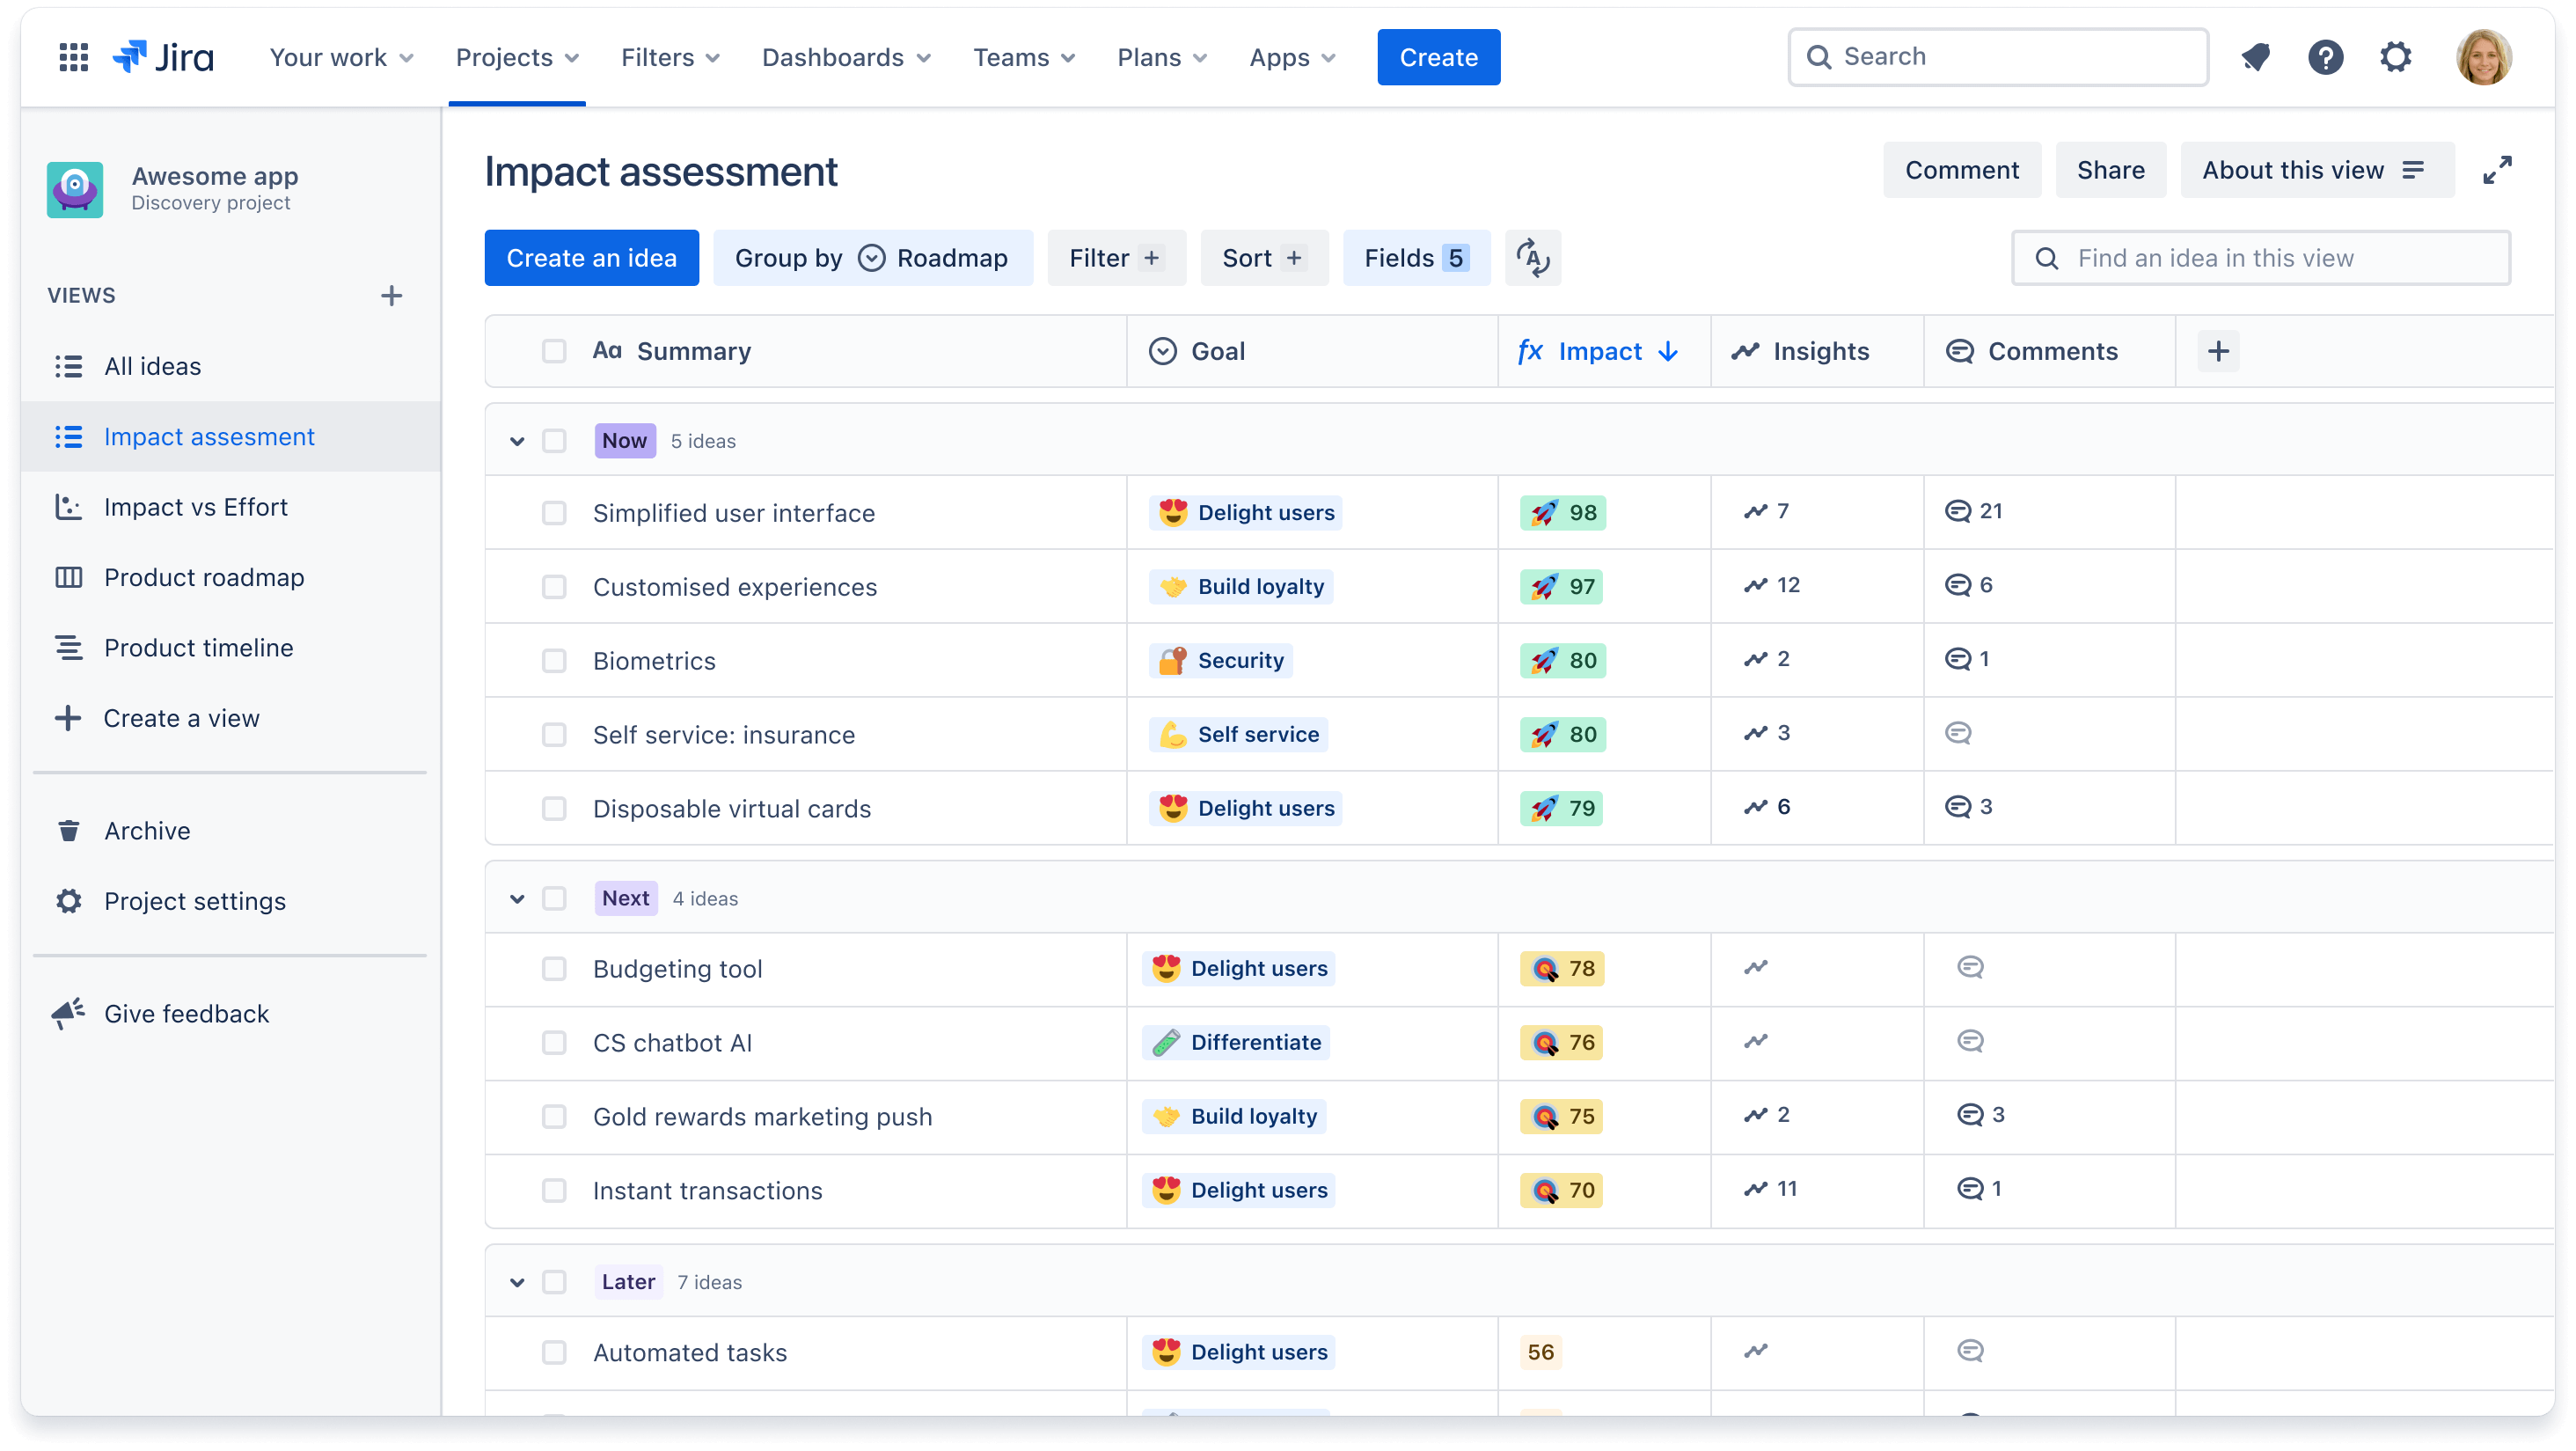
- Impact assessment, with fields like impact, effort, confidence, and impact score to sort ideas based on the impact they’ll have on your business and customers
- RICE scoring, with fields for Reach, Impact, Confidence, and Effort to prioritize ideas based on a custom RICE formula
- Team-specific, where ideas are filtered to only show those associated with Team A, and a separate list view for ideas associated with Team B
Delivery progress, with Delivery progress and Delivery status fields to show linked Jira Software epics and issues, and their progress, for each idea
Qu'est-ce qu'une vue Matrice ?
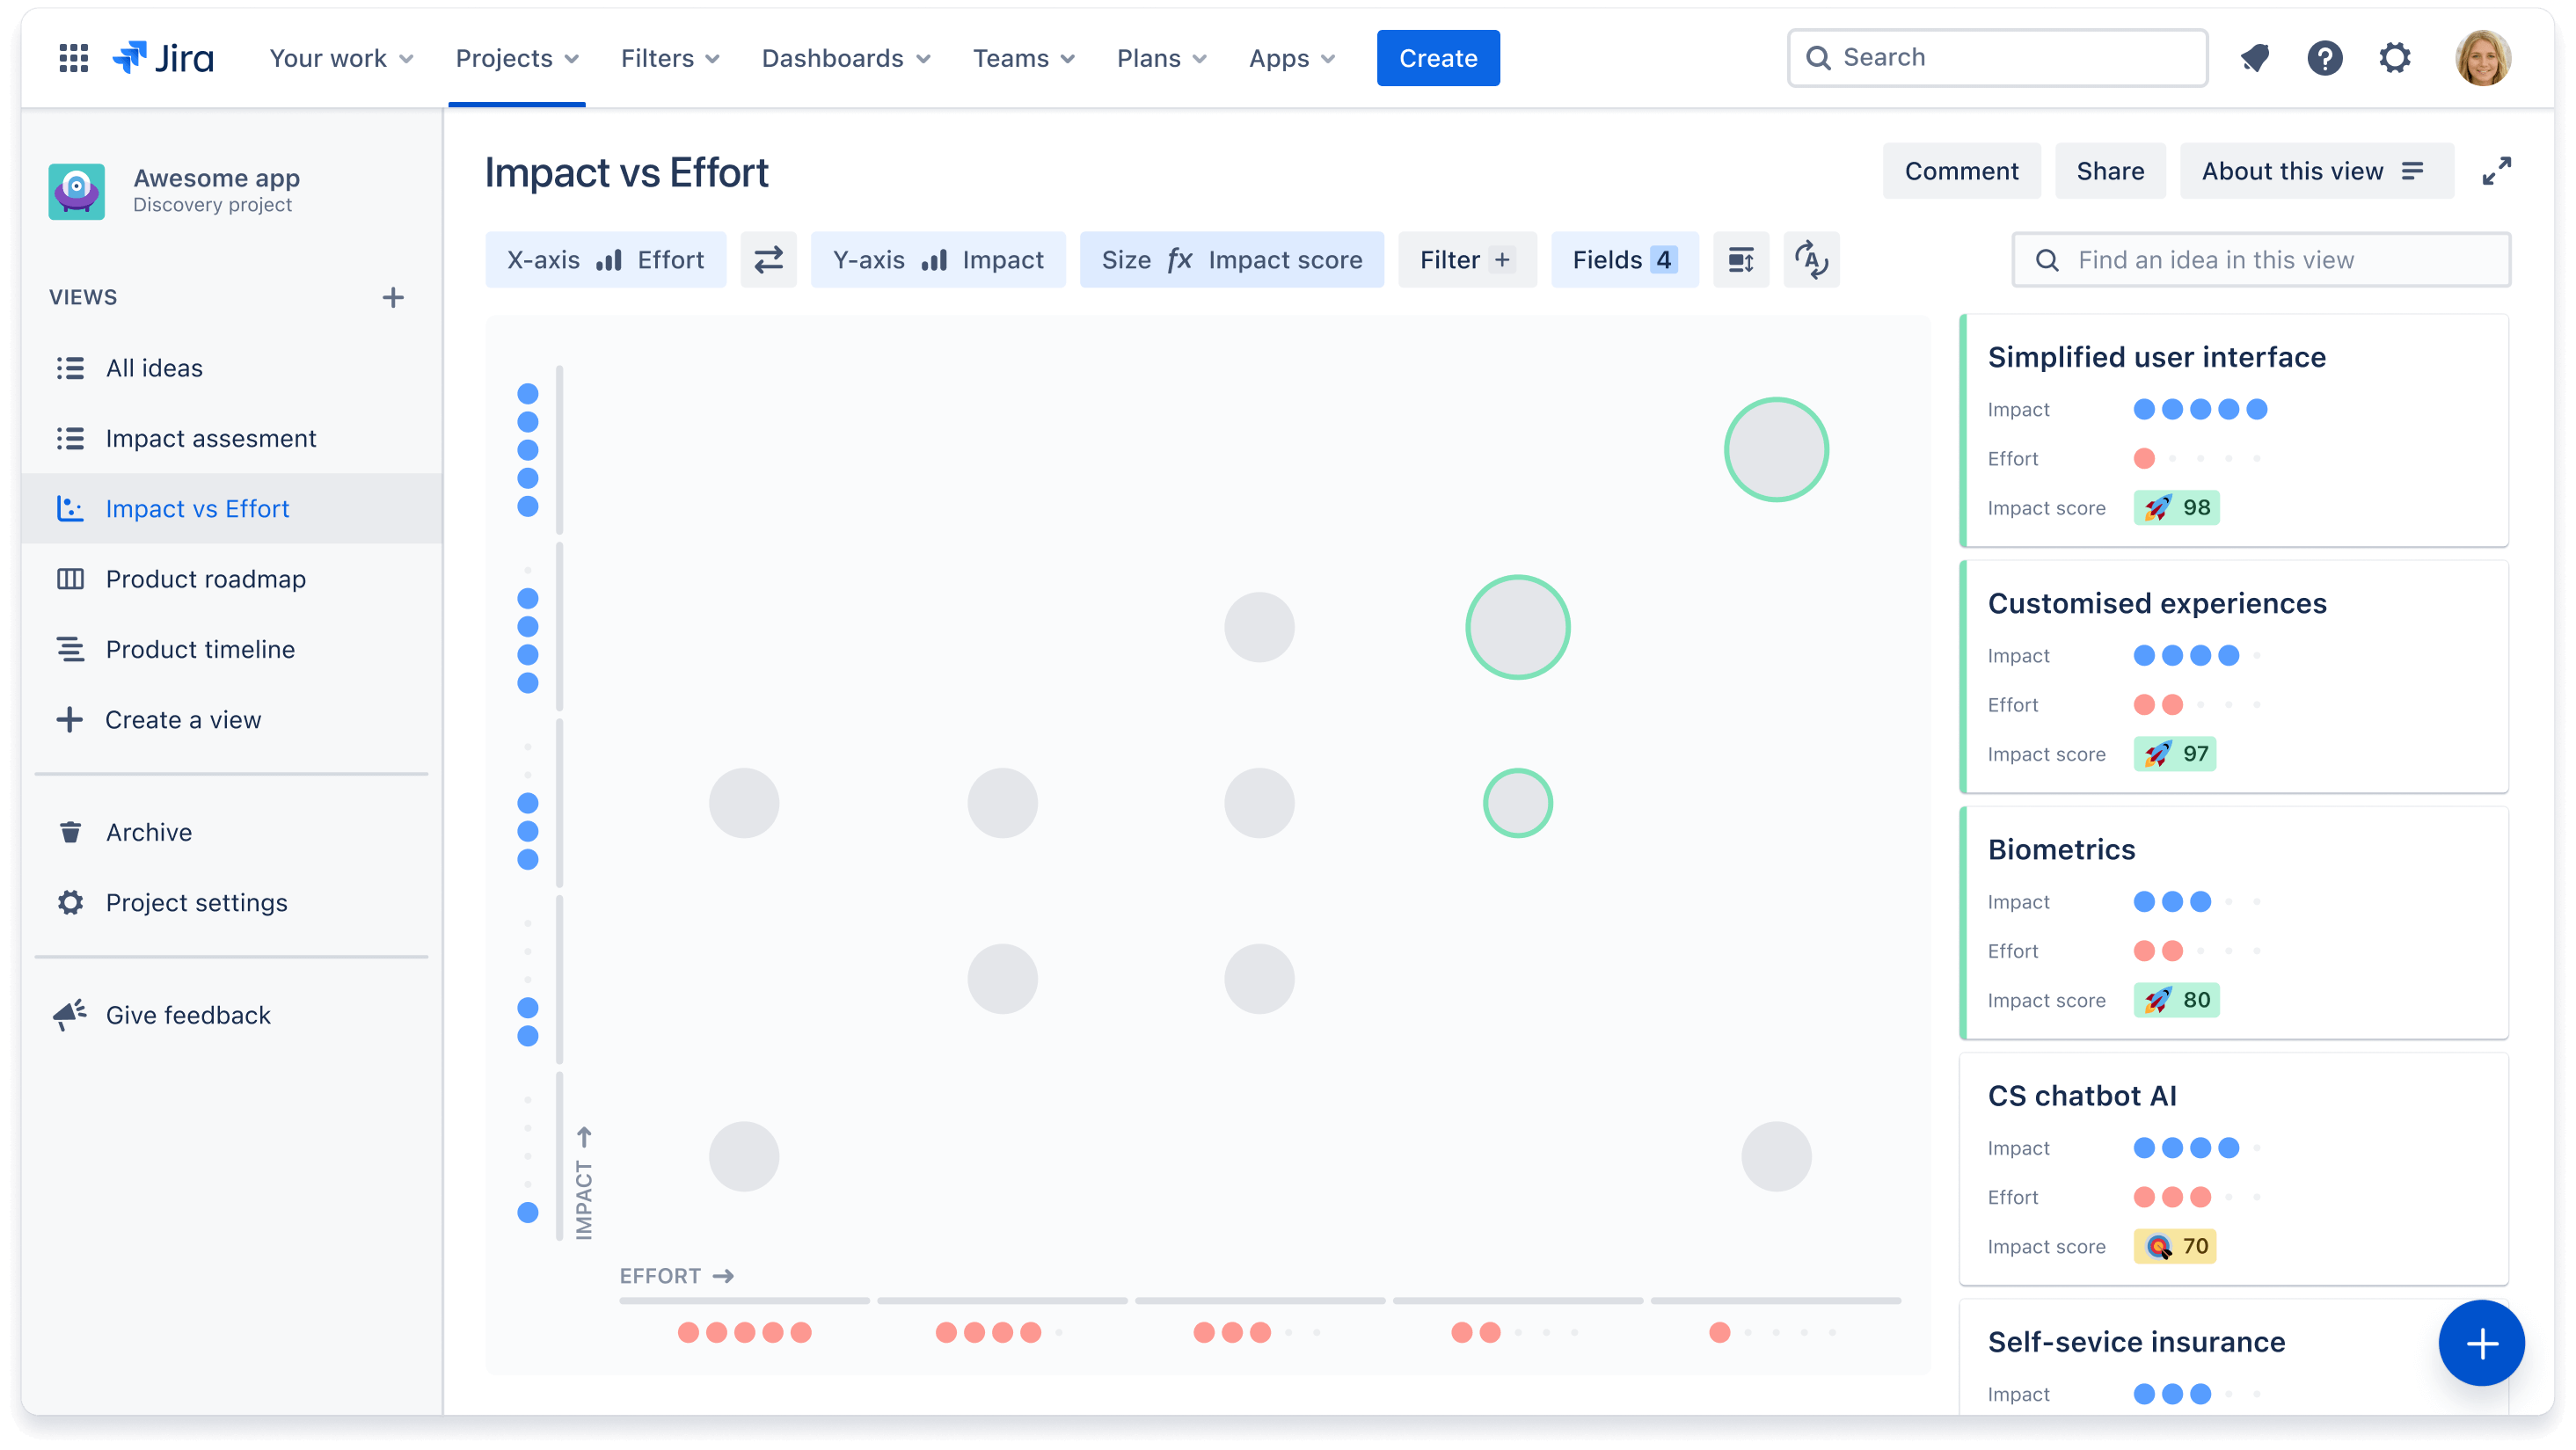
The matrix view offers a visual way to compare ideas across two chosen fields. It is the perfect canvas for prioritization conversations with your team. By placing ideas on the x and y axis, such as impact vs. effort, you can quickly identify which ideas are big boulders versus quick wins.
To add to your visualization, change the size of each idea circle based on an eligible field, such as impact score. The larger the impact, the bigger the circle.
When to use a matrix view
Nous recommandons d'utiliser cette vue lorsque :
- You want to quickly show where ideas rank in your prioritization and why
- You want to prioritize ideas based on two key criteria, most commonly Impact vs Effort
You need a canvas to reference for prioritization discussions to talk through opportunities at a high level
Qu'est-ce qu'une vue Tableau ?
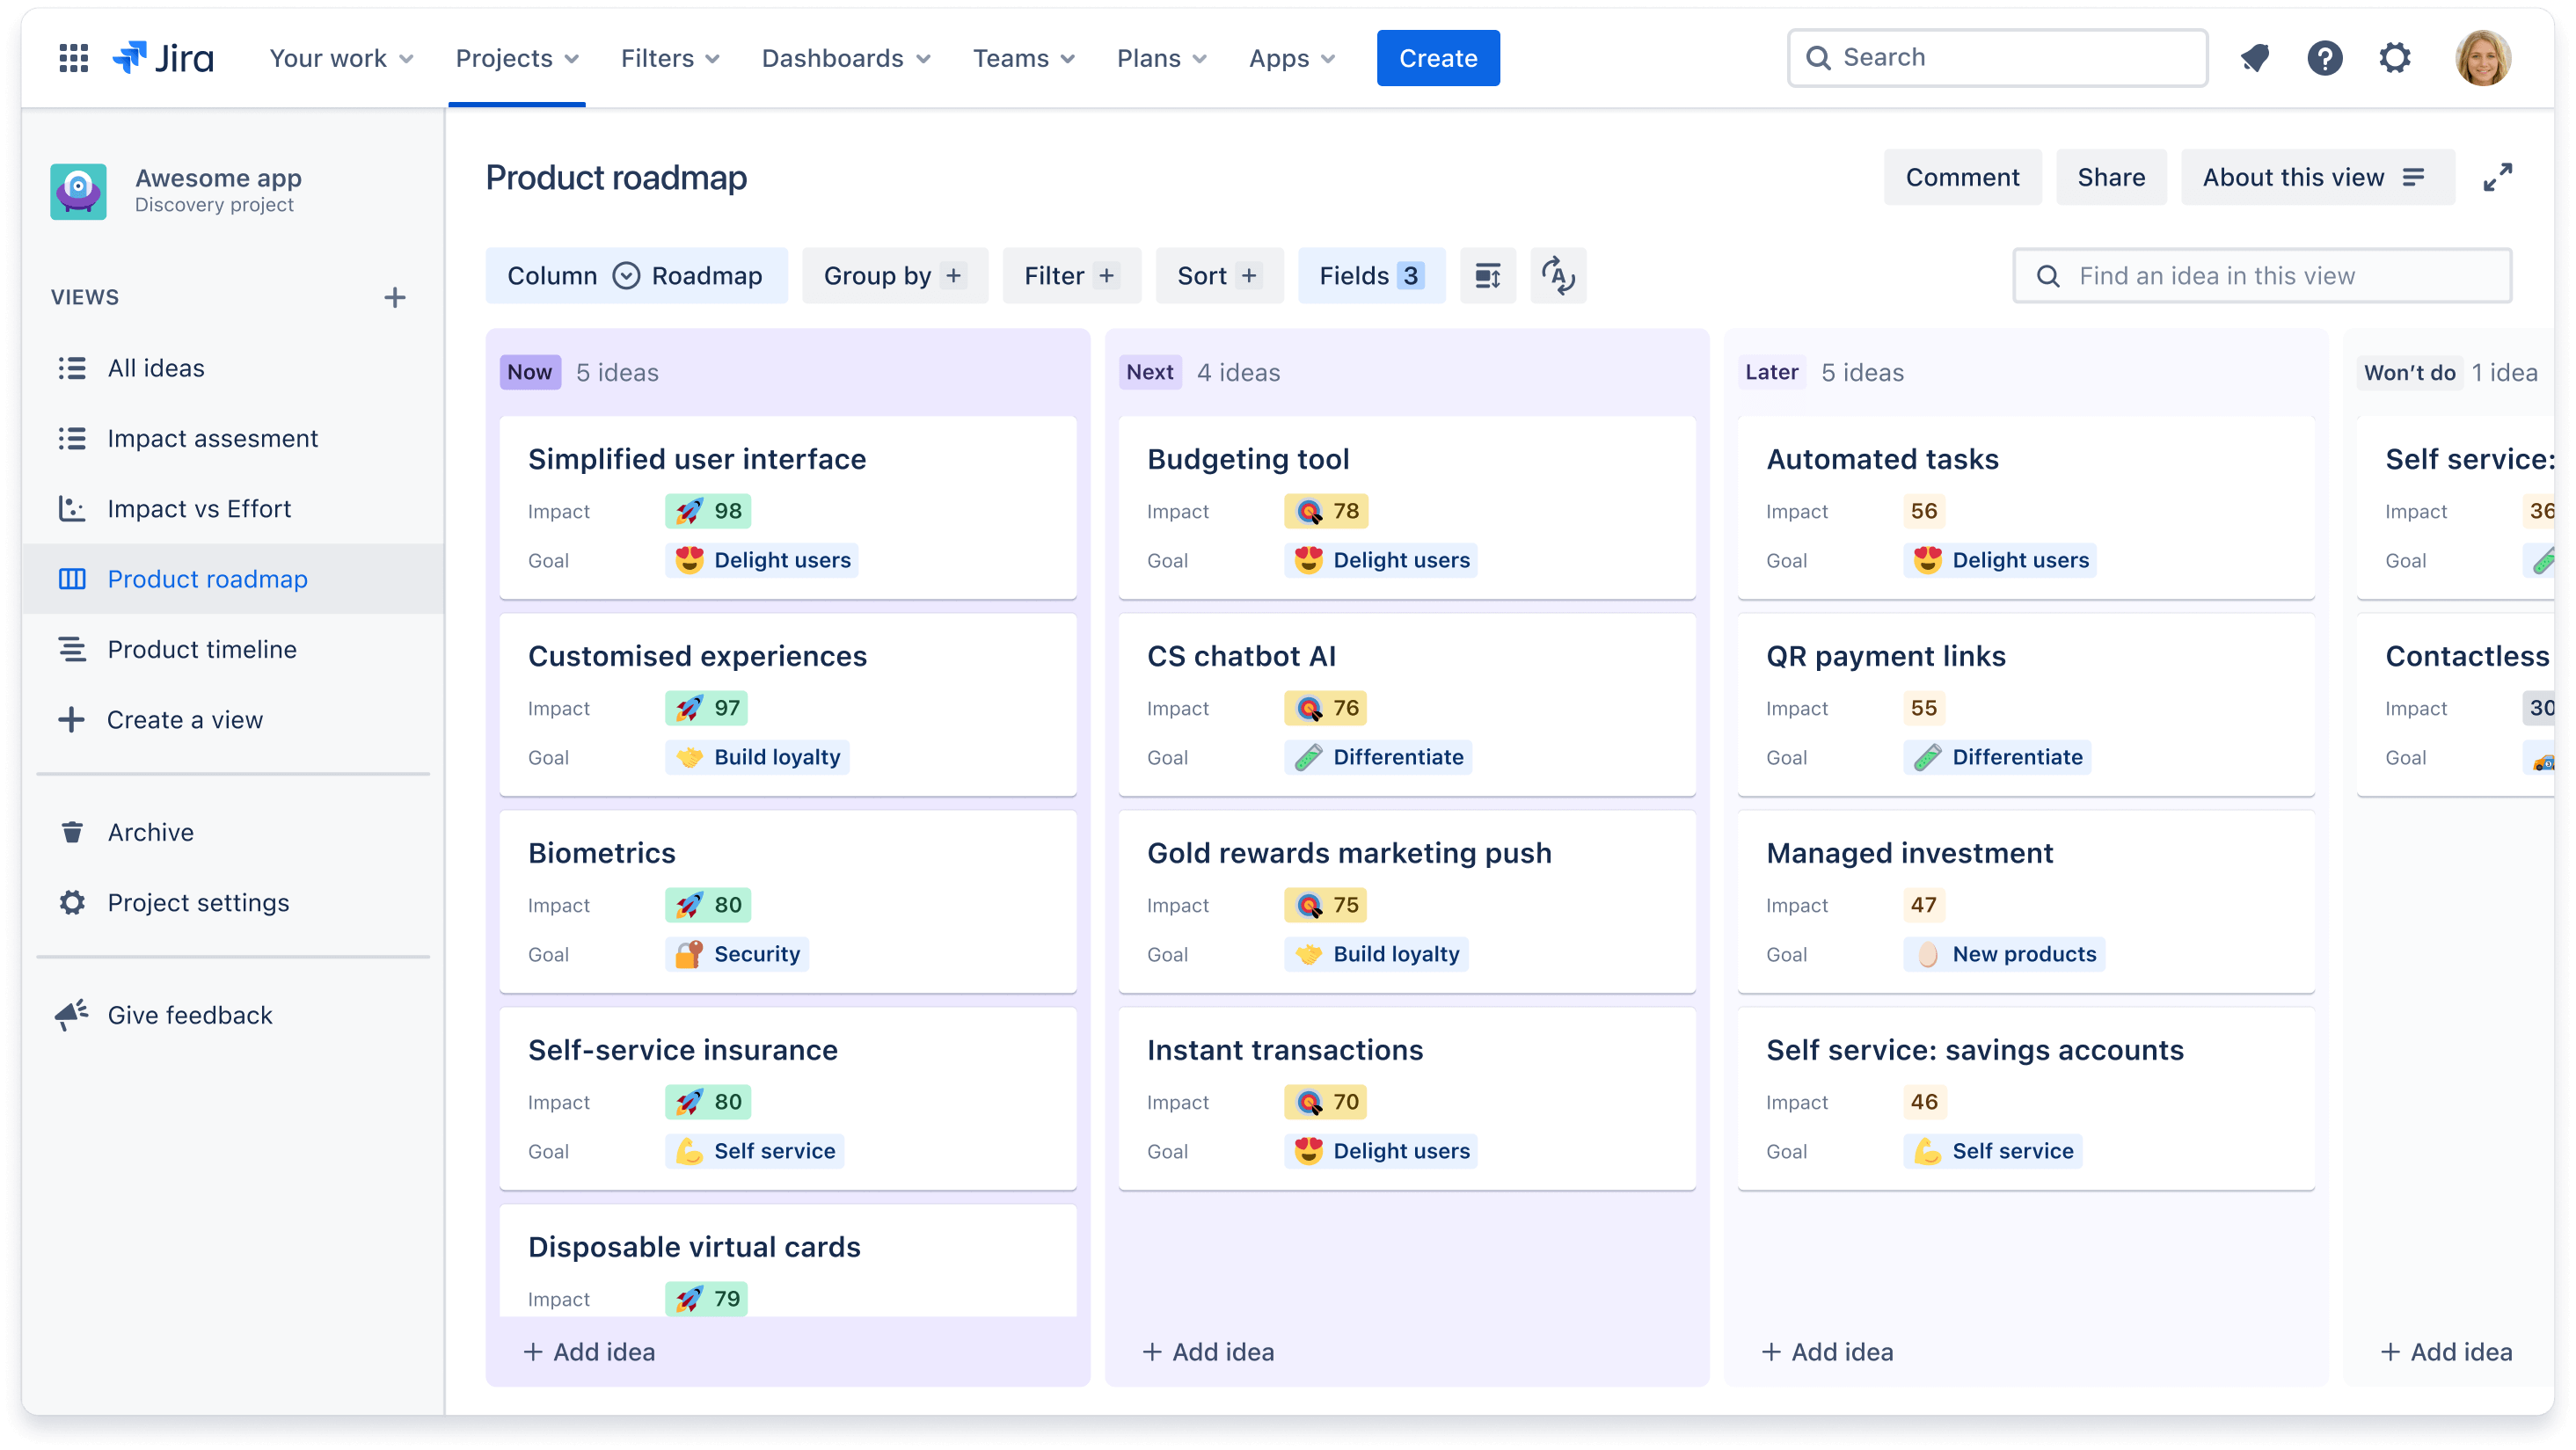
Once you’ve prioritized your ideas, it’s time to communicate your plans out to the business. Instead of static presentations and endless meetings, you can share always-up-to-date roadmaps, and the board view is our perfect form of a roadmap. Board views categorize ideas into columns and let you easily tailor information to your audience by layering more or less data points for added context.
When to use a board view
A board view is best used when you don’t want to focus your conversation around anything time-based. We recommend using a board view when:
- You want to focus on what you’re committing to versus when you’re committing to them
-
You want to tailor information to your audience by grouping ideas into buckets (e.g. swimlanes) or layering in data points to communicate your strategy visually
Some examples of board views you may create include:
- Using the “Roadmap” field to organize ideas by Now, Next, and later
- Using the “Quarter” field to organize ideas by Q1, Q2, Q3, and Q4
- A leadership-specific view that groups ideas by “Company goals” to show which ideas ladder up to each goal
-
A product team-specific view that groups ideas by “Team” or “Squad” to show which ideas will be owned by which team
In the board and timeline view, change the layout of cards to show more or less information. Click on the Fields + button and select which fields to toggle on or off.
Qu'est-ce que la vue Chronologie ?
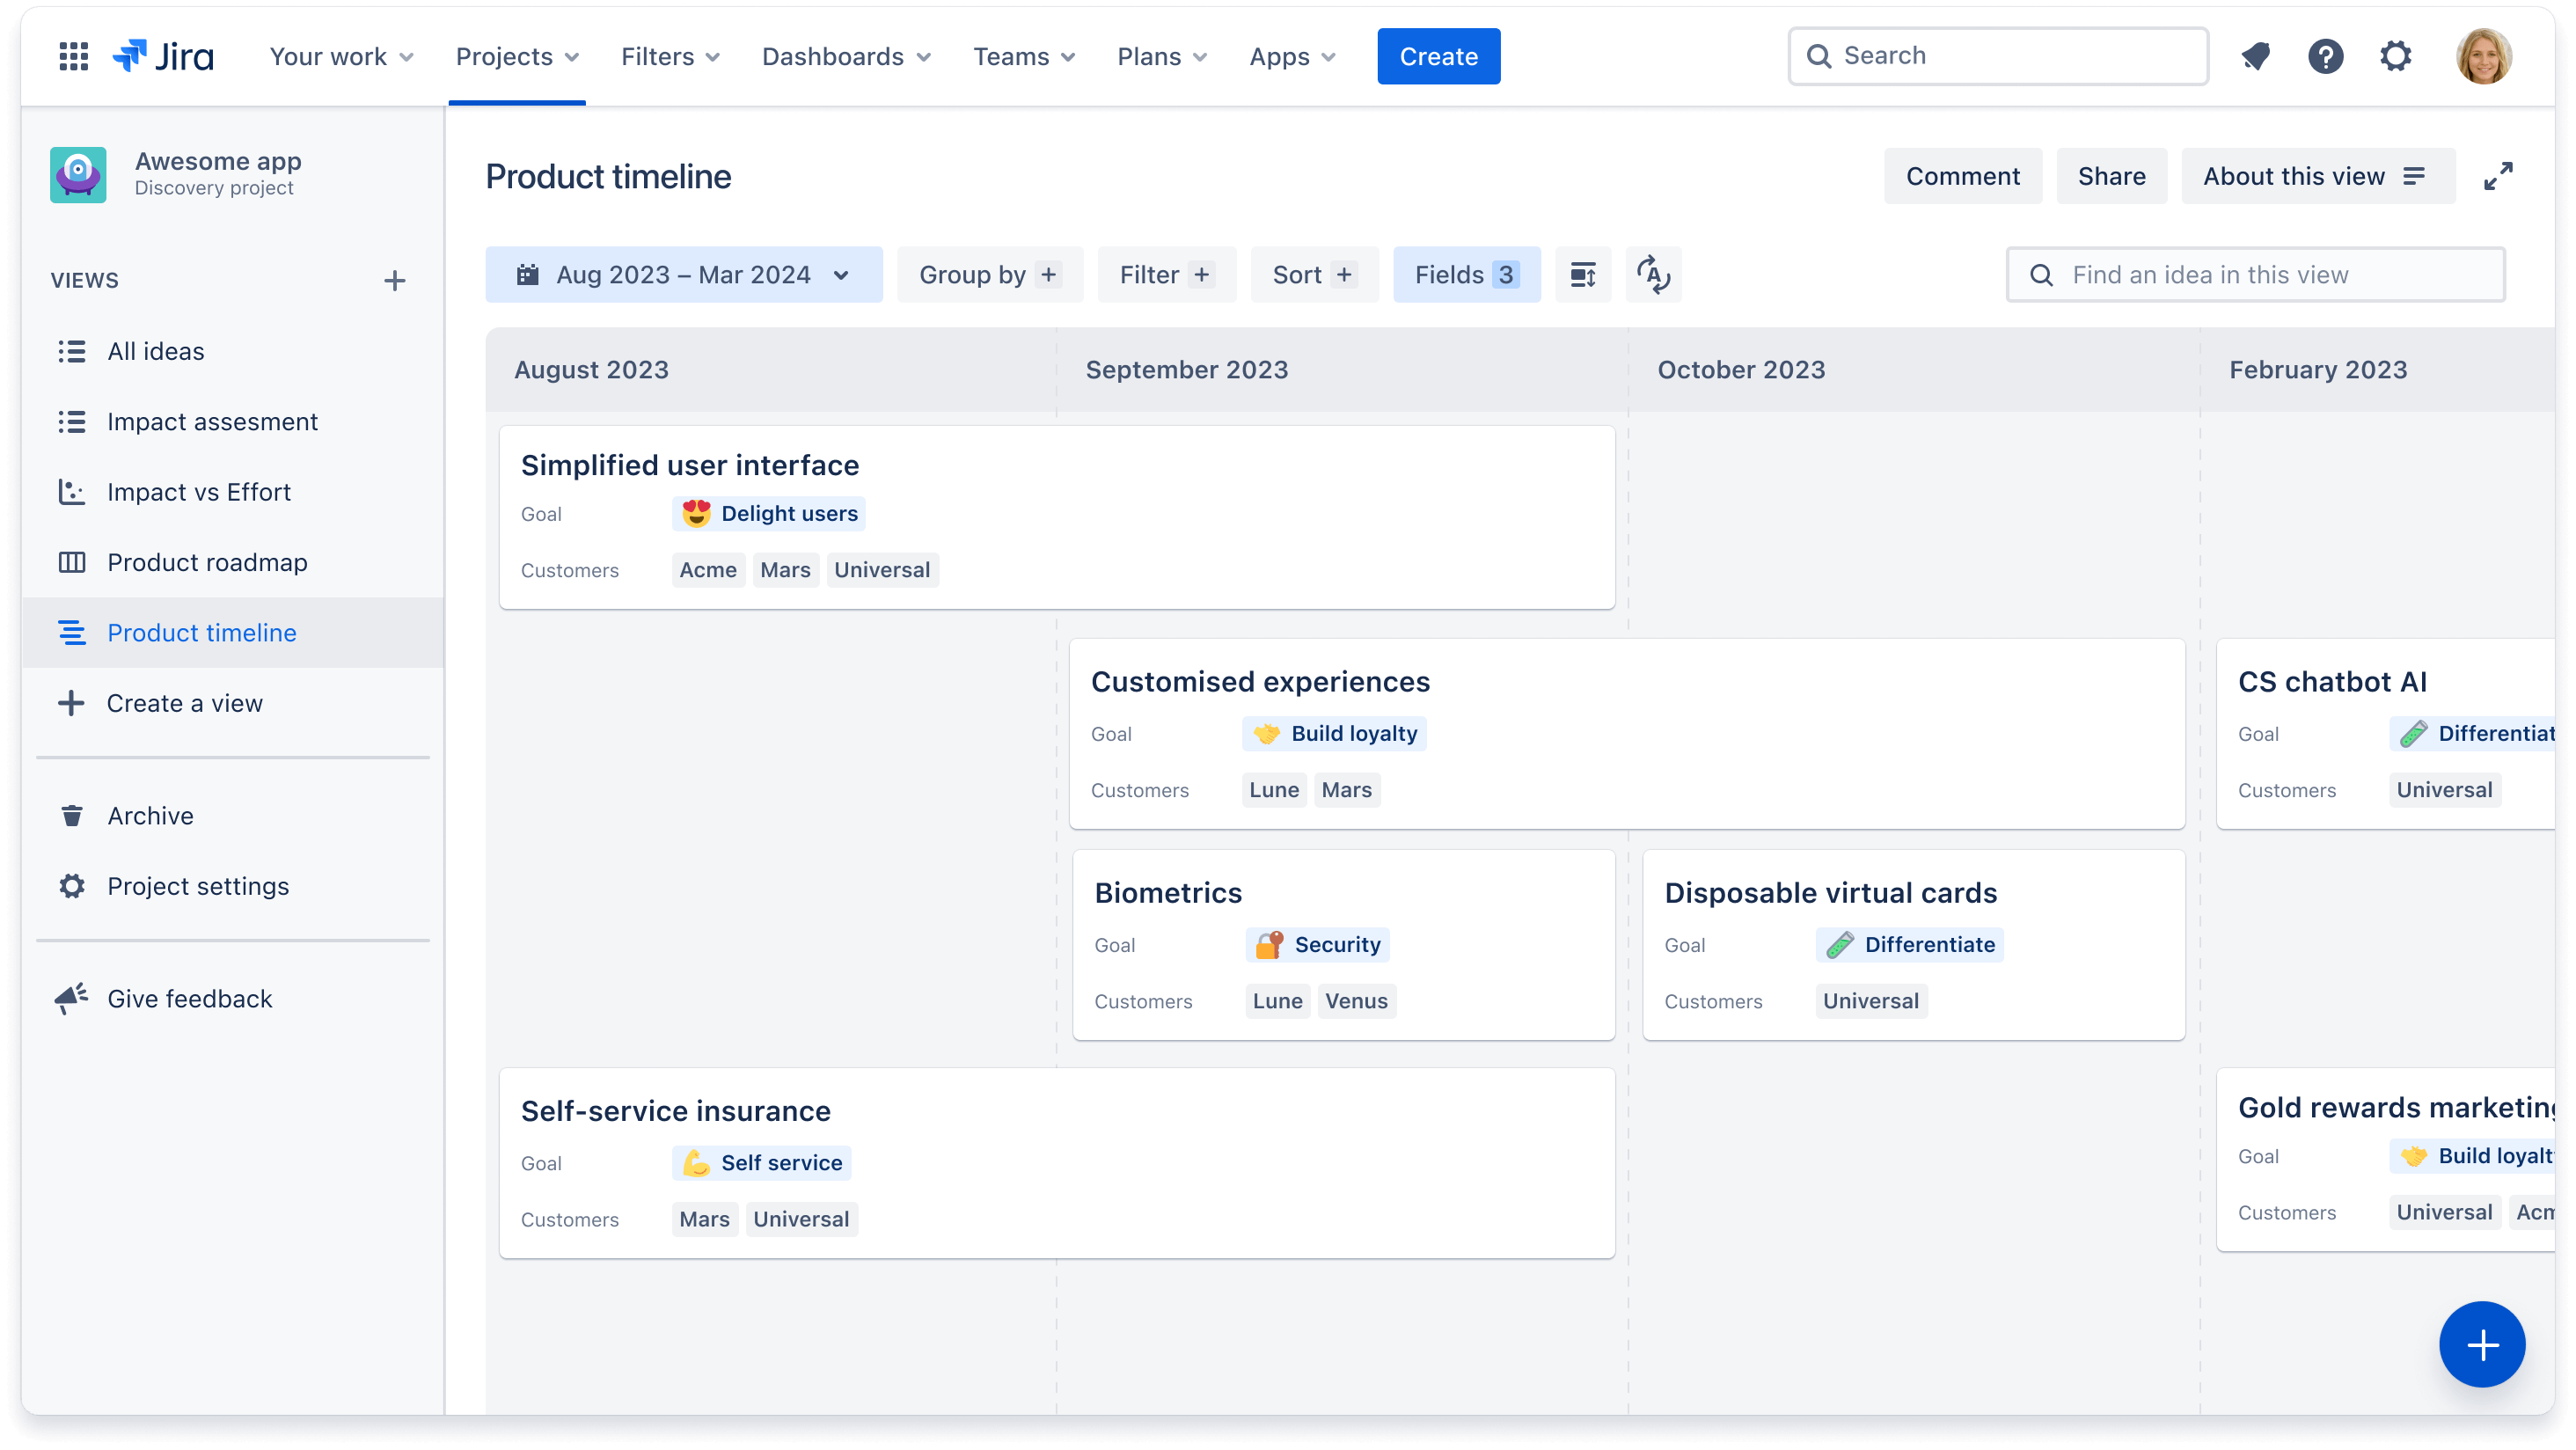
While some teams prefer roadmap discussions without a specific focus on timing, other teams need more detail about when certain features are going to ship. The timeline view displays ideas across a monthly or quarterly timeline. You can easily modify dates in this view by dragging cards to your desired timeframe.
When to use a timeline view
We recommend using a timeline view when you need to communicate rough estimates of delivery dates, in months or quarters, back out to the business. This can also help teams that may be dependent on ideas shipping to plan their own roadmap.
Similar to the board view, some examples of timeline views include:
- A sales-specific view that groups ideas by “Customer segment” to show which ideas have been requested by certain customer groups
A team-specific view that groups ideas by “Squad” to show which ideas will be worked on by which team or squad
Comment créer et gérer une vue ?
To create, edit, and manage views, you must be in a Creator role. To create a view:
- Navigate to your lefthand navigation and click + Create a view
- Select a view type or create a new section to organize a set of views.
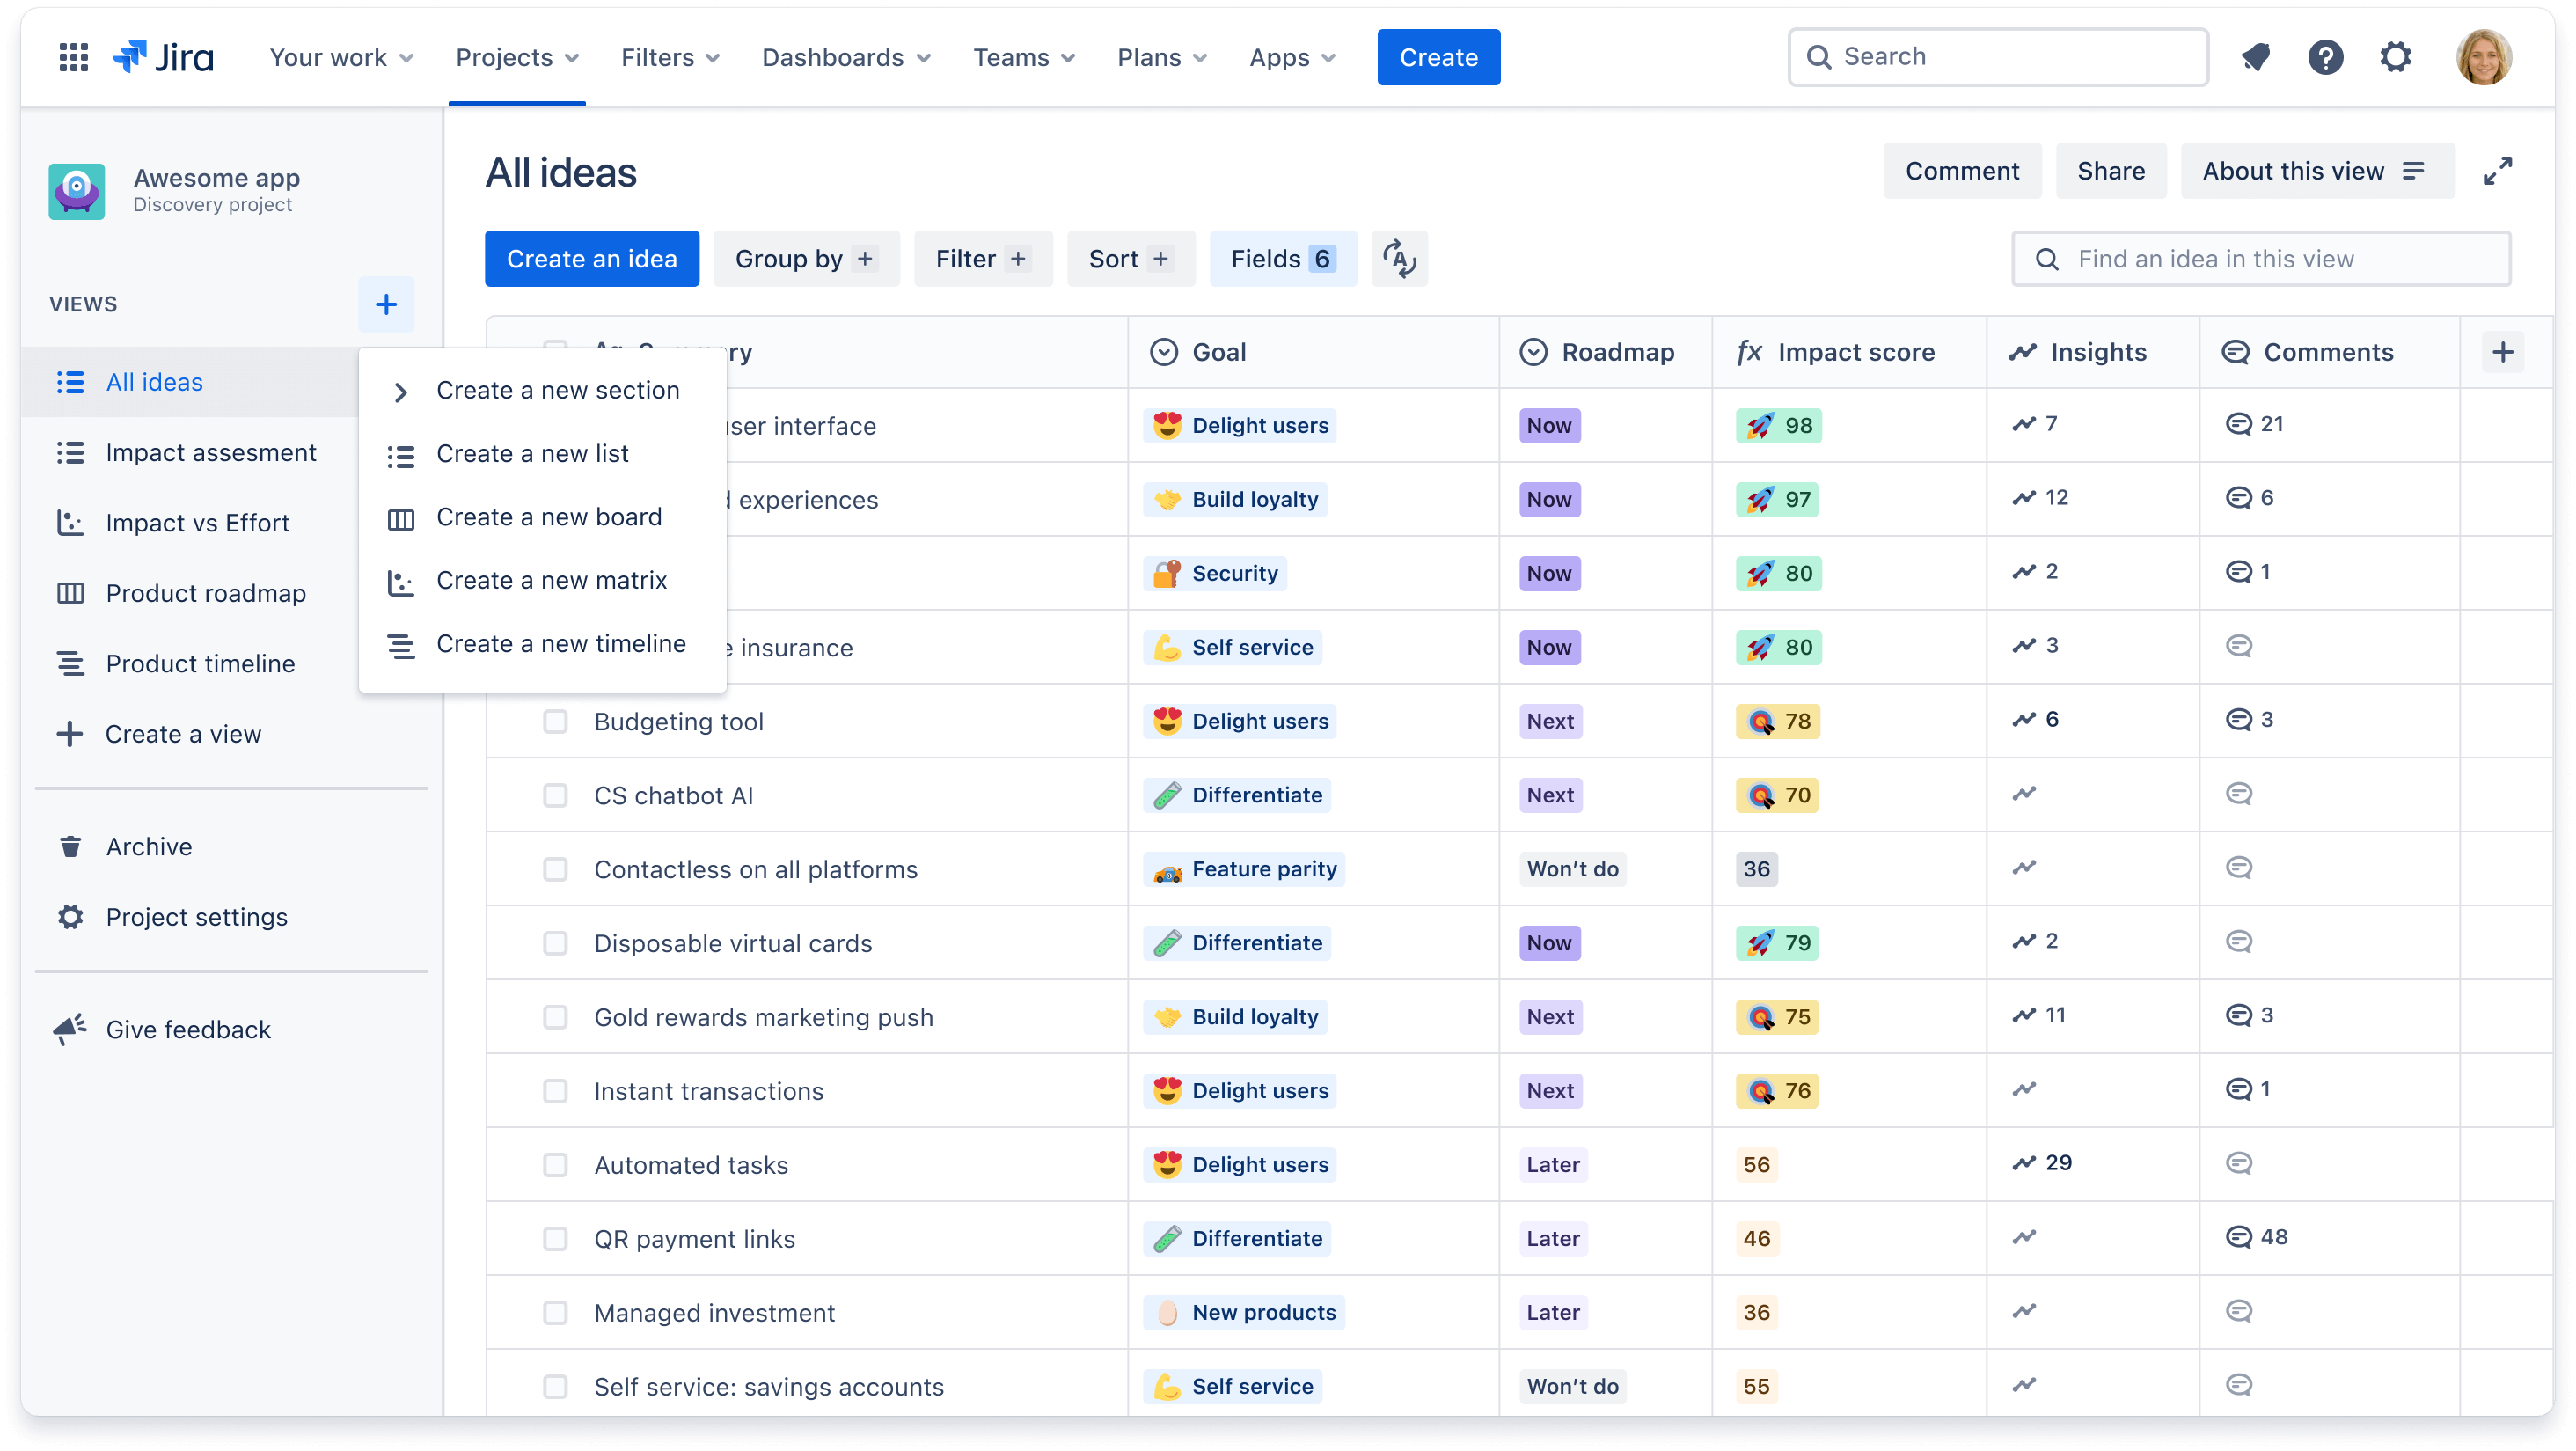
To keep your lefthand navigation organized, create sections (i.e by team or product) to house multiple views in an expand. Click on + Create a view and select Create a new section.
Did you know that you can comment on a whole view? This is best for when stakeholders have overall feedback or questions on a specific view. Learn how to comment on a view.
Sharing and exporting views
The main benefit of creating multiple views is being able to easily share them with your teammates or external stakeholders.
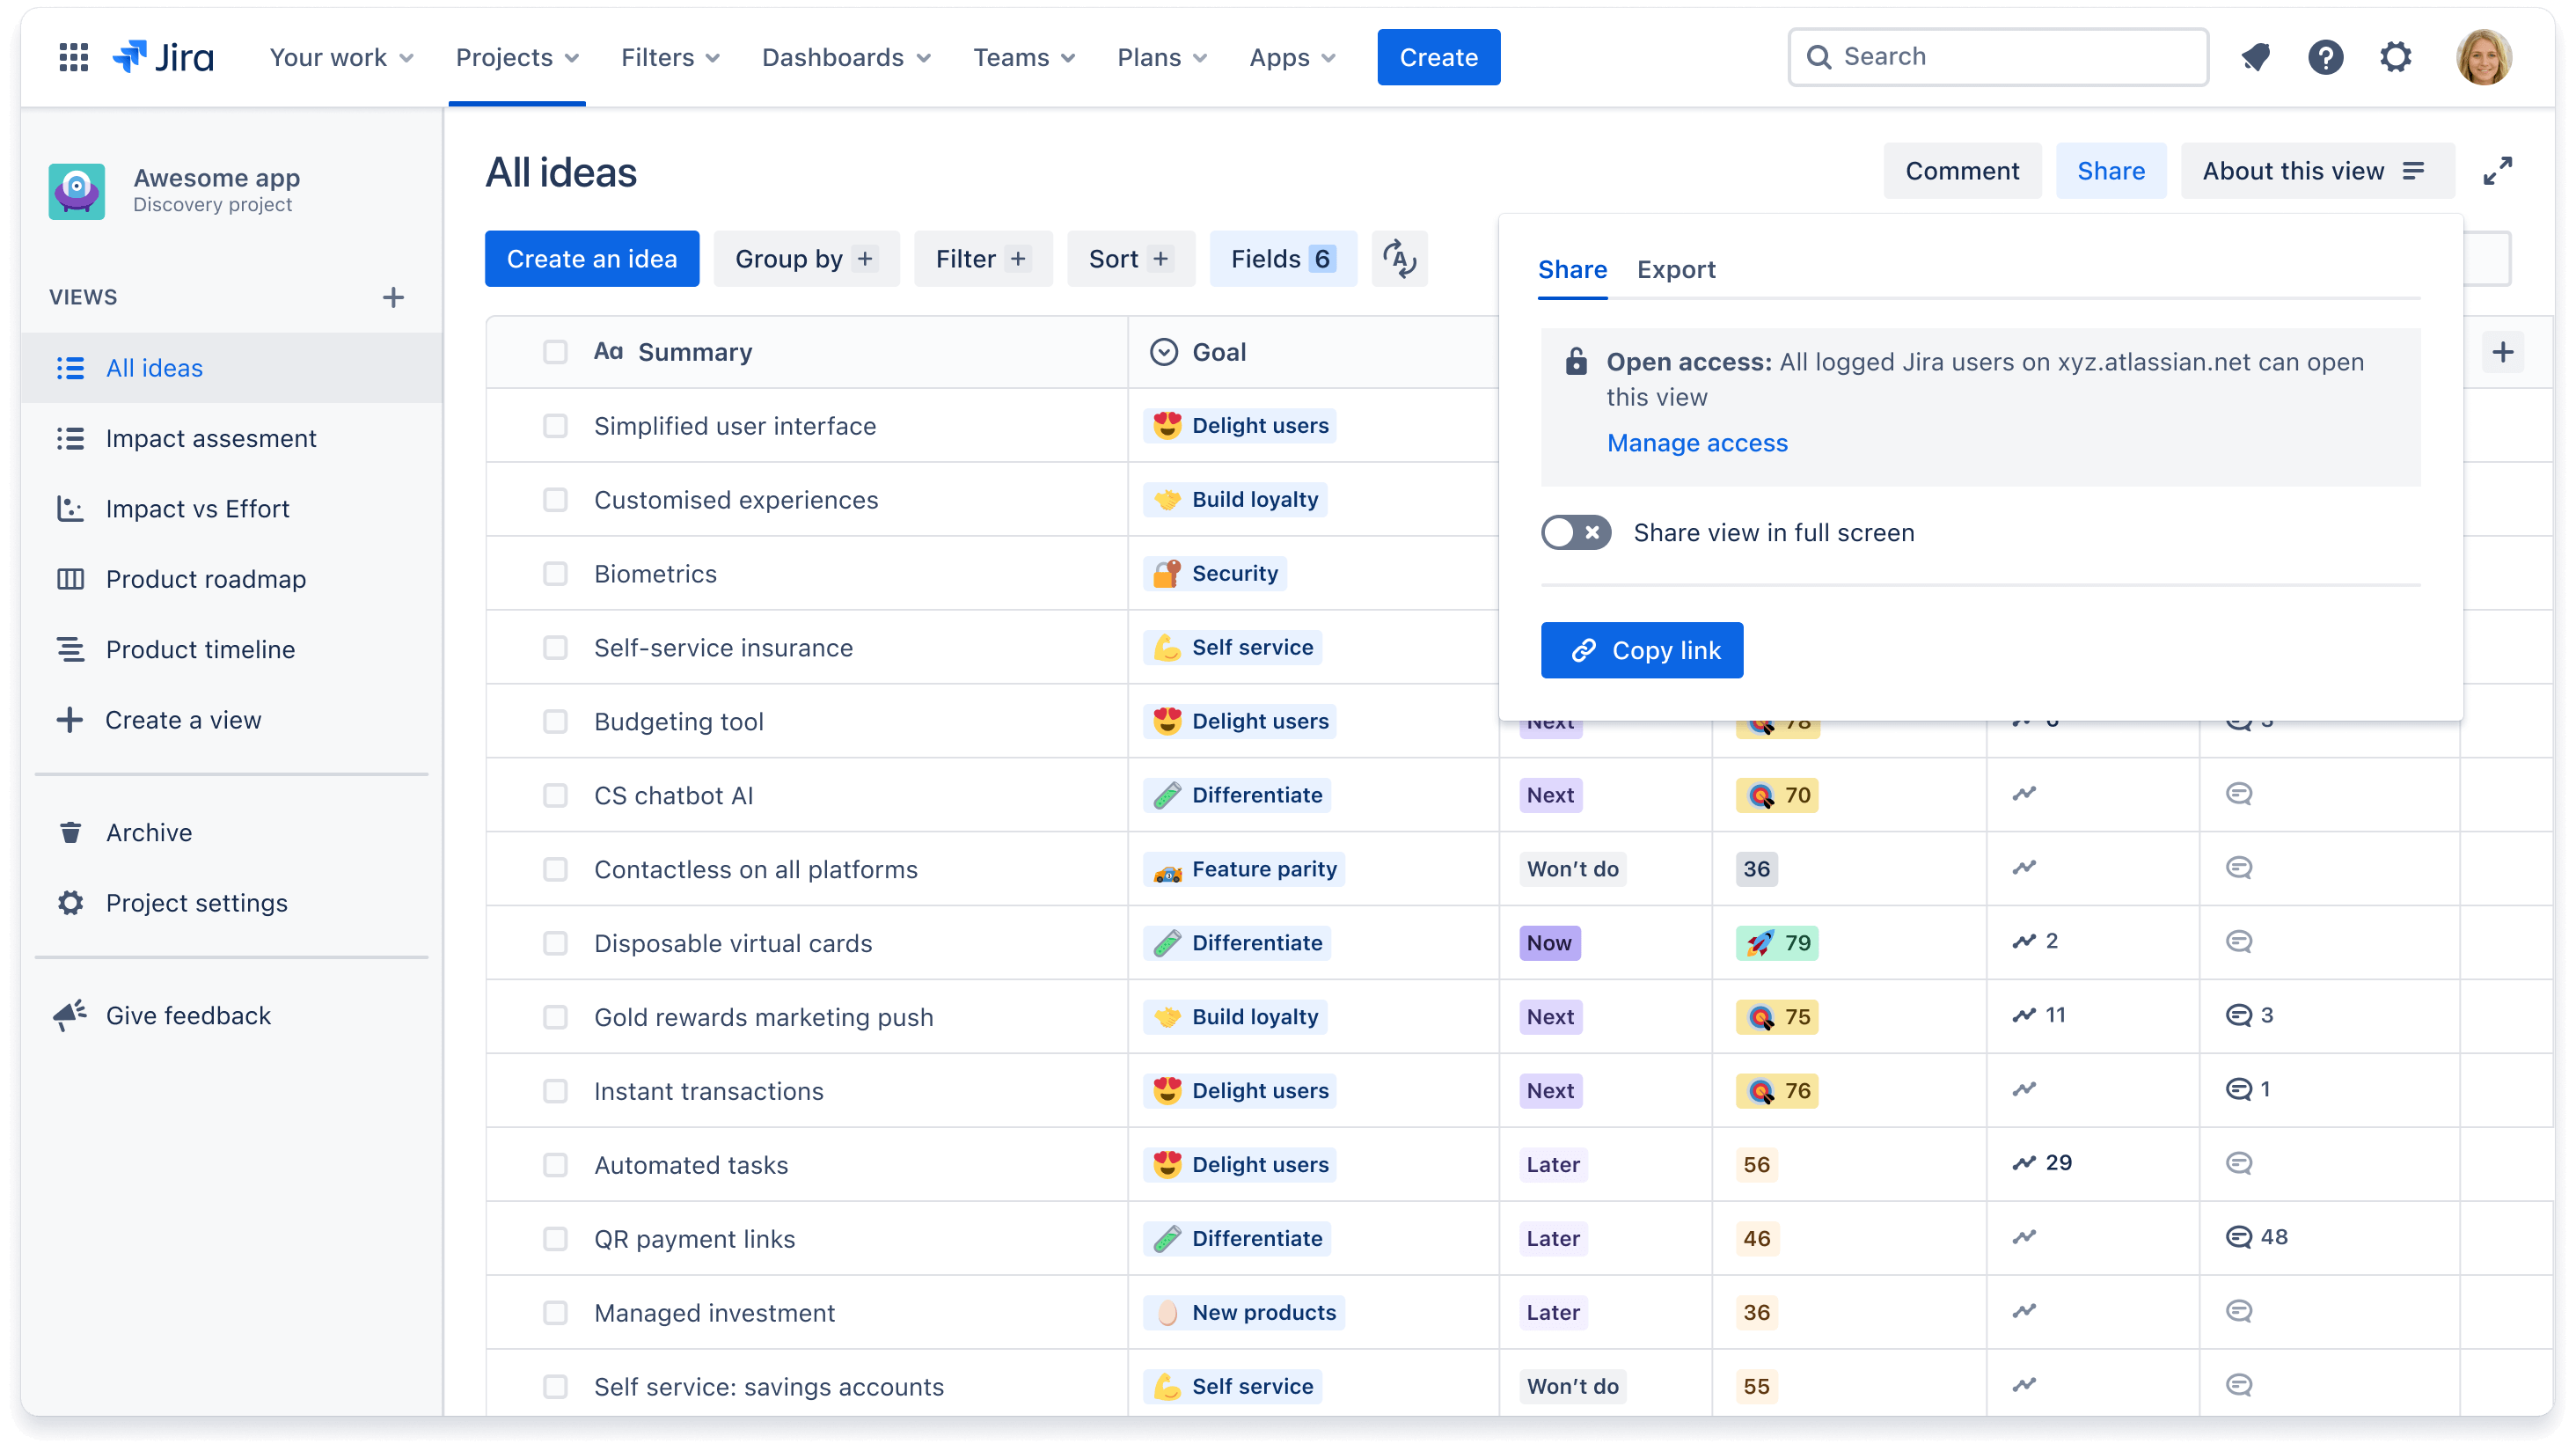
To share a view with your team (e.g. those who have access to your Jira site or other Atlassian Cloud products):
- Click on Share in the upper righthand corner of your screen
- Click the blue Copy link button and share an always-up-to-date link with your peers or export a static version of the view as a JPEG or CSV file
You can also embed these views into Confluence (watch a demo!), for example in a strategy document, so you can tell a story around your roadmap.
Visit our documentation for step by step instructions on exporting data into a CSV or gsheet.
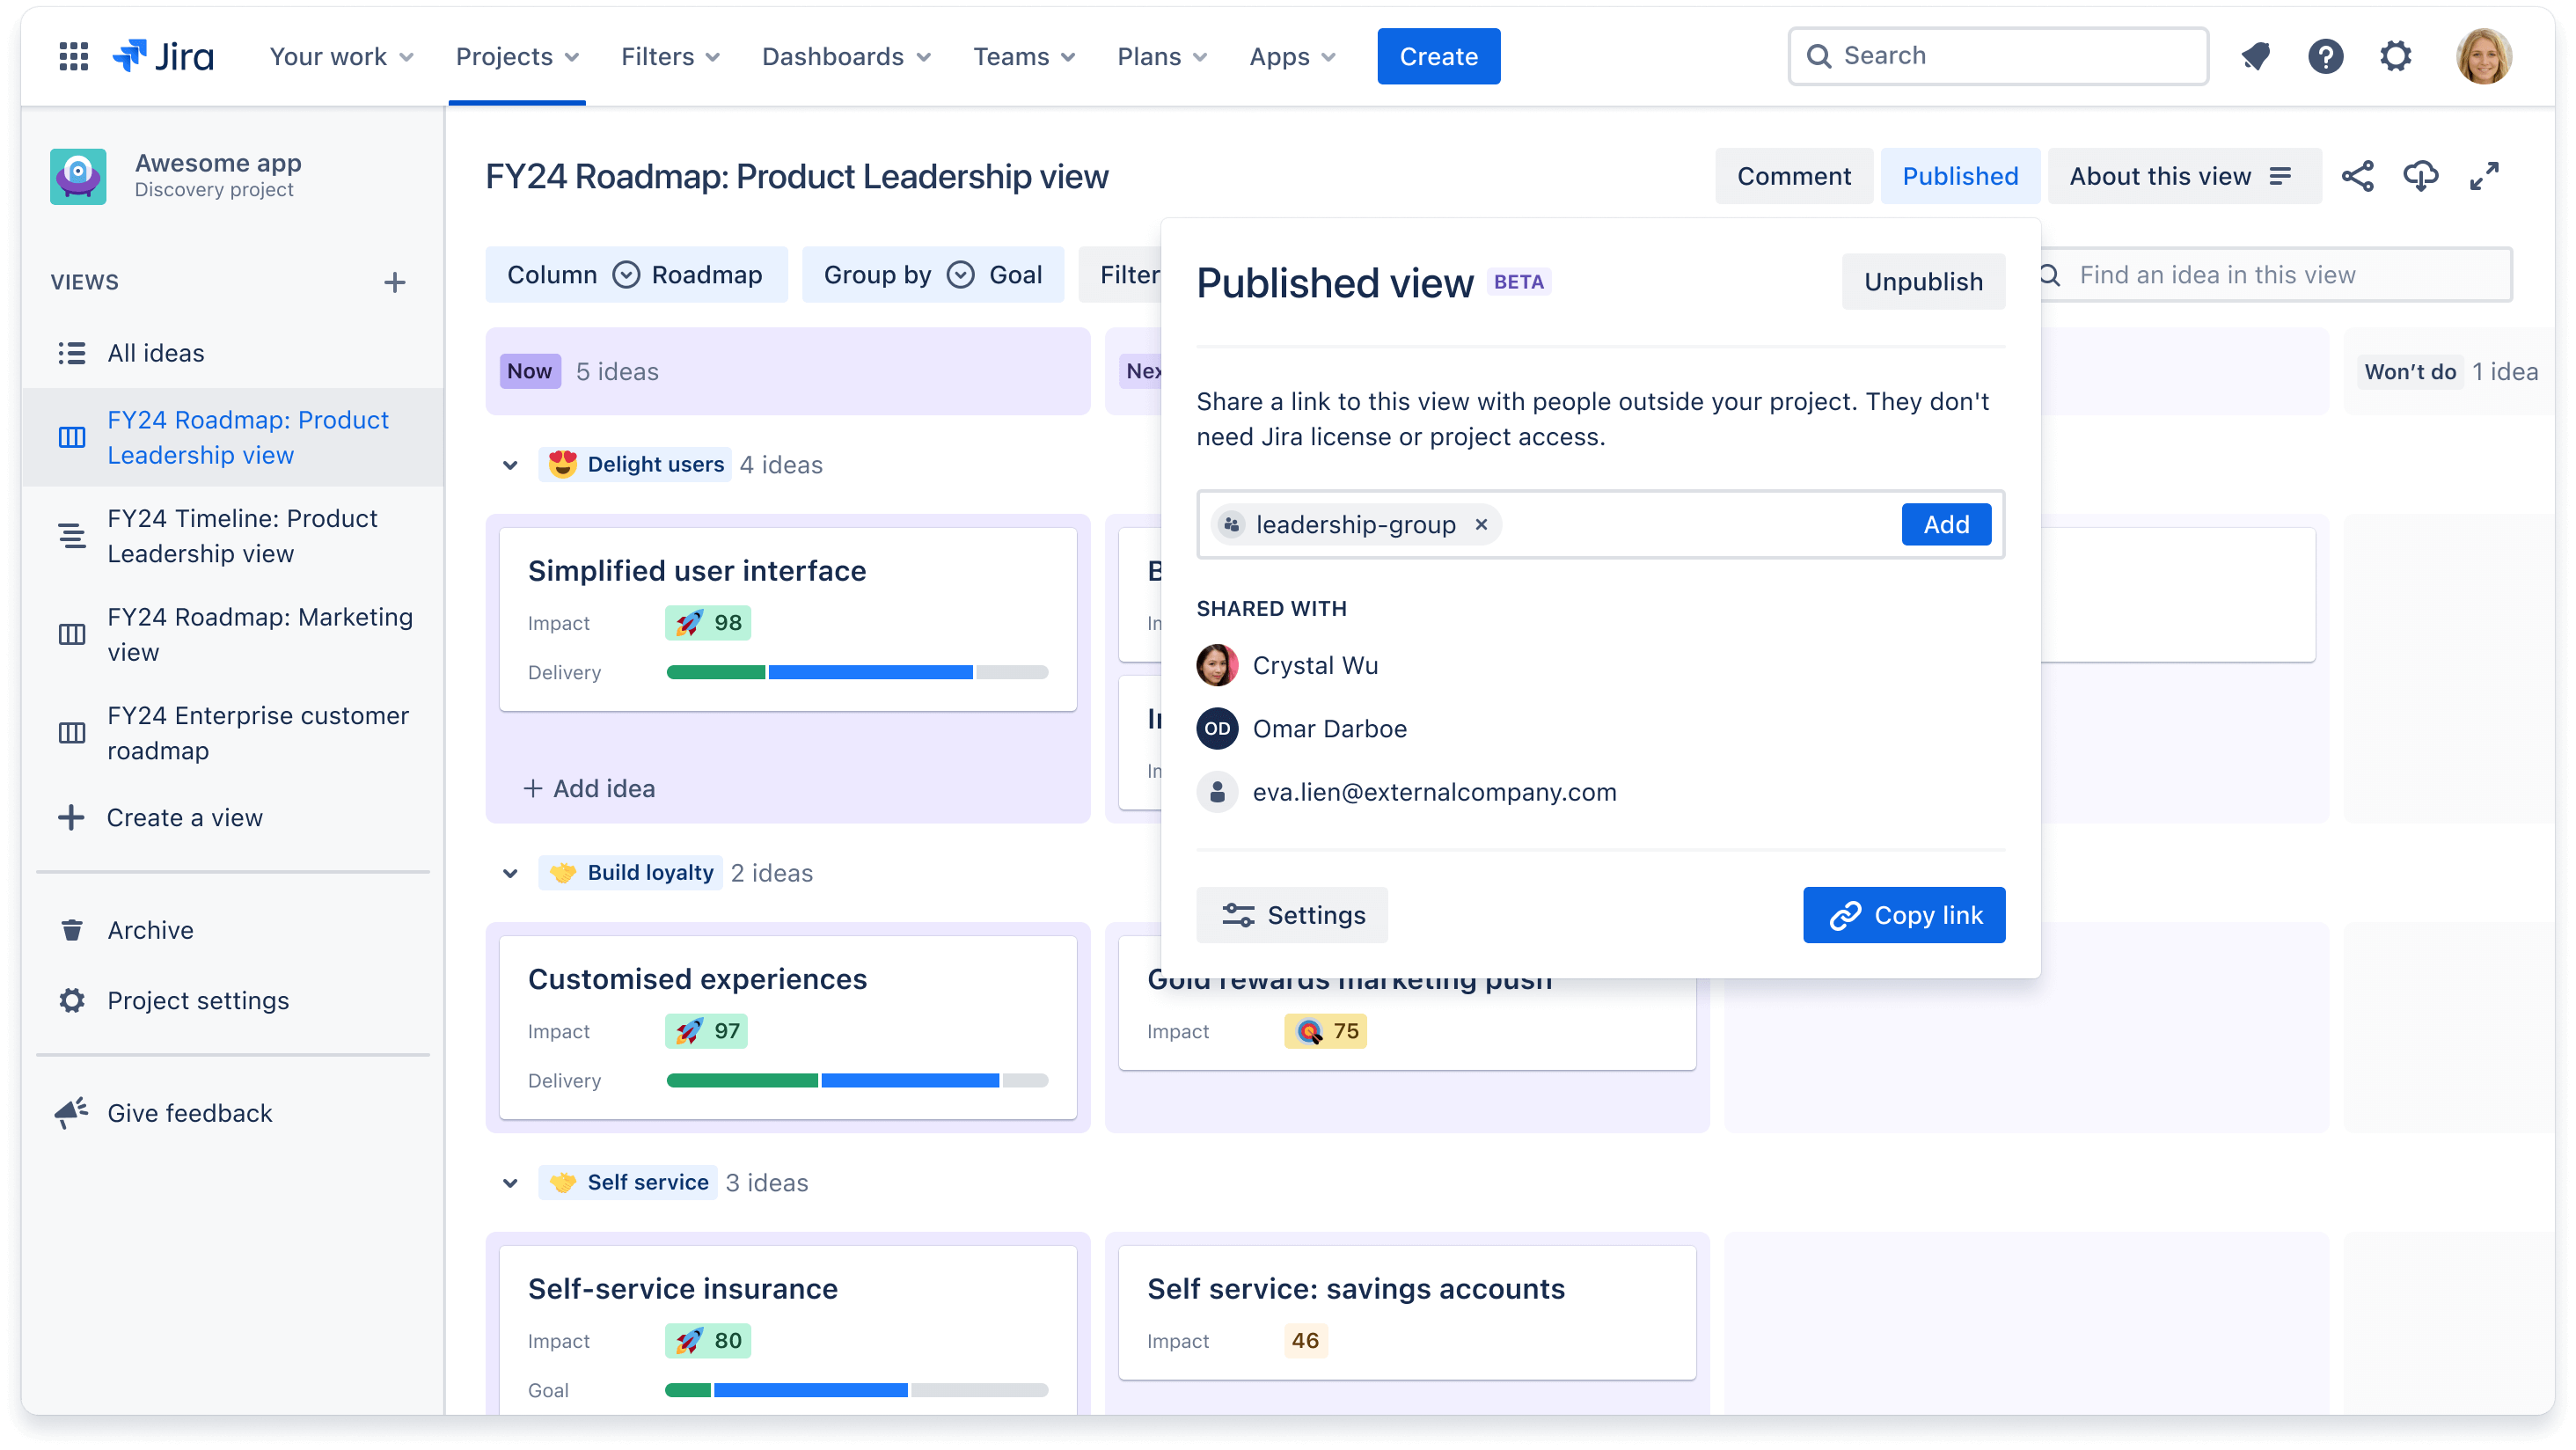
To publish a read-only view to those who don’t have access to Jira or another Atlassian product (e.g. senior leadership or customers):
- Click on Publish in the upper righthand corner of your screen
- Add specific email address or team aliases you wish to share with
- In the bottom left, click Settings, to configure which fields you want visible to your stakeholders
- Click Copy link to copy the published URL and send it out via email or messaging app
Si vous êtes créateur et que vous ne voyez pas le bouton Publish (Publier), vérifiez que l'administrateur de votre projet a activé les autorisations. Pour en savoir plus sur la publication de vues, cliquez ici.
Importing data into a view
To move information from one tool to another, or to consolidate into a single source of truth, you can import data into a view. There are two methods to import data:
- Import existing Jira issues into Jira Product Discovery - To import existing issues you can either do a bulk move or import using CSV file. Visit our documentation for step by step instructions.
- Import ideas from a CSV file - If you’re importing ideas from another software like Gsheets, Productboard, or Aha! you should use a CSV file. Follow these guidelines to import using this method.
Comment personnaliser les vues ?
The main reason to customize a view is to tailor the information presented for a specific purpose or a specific audience, like a view to show how ideas ladder up to each company goal.
Une fois que vous avez ajouté des champs à vos vues, vous pouvez les personnaliser davantage encore afin de présenter les données comme vous le souhaitez, en utilisant ces trois options : filtrer, regrouper et trier.
Filtrer les vues
La fonction de filtre vous permet de masquer certaines idées dans une vue. Vous pouvez filtrer par le champ « Équipe » afin d'afficher uniquement les idées attribuées à l'équipe A, ou bien filtrer par le champ « Initiative » afin d'afficher toutes les opportunités évaluées dans le cadre d'un workflow.
Pour filtrer une vue :
- Cliquez sur le bouton Filtrer + en haut de votre écran.
- Cliquez sur + Ajouter un filtre et choisissez le champ par lequel vous souhaitez filtrer
- Cochez la case correspondant à chaque option de champ que vous souhaiteriez voir. Vous pouvez également filtrer selon plusieurs champs
Regrouper les vues
Regrouper des idées vous permet de regrouper visuellement plusieurs idées en fonction d'un champ. Vous pouvez regrouper toutes les idées par personne responsable ou regrouper les idées par workflow pour faire office de swimlane. Lorsque vous regroupez des idées, vous pouvez également masquer ou élargir les groupes afin de désencombrer et organiser votre vue.
Pour regrouper les idées dans une vue :
- Cliquez sur le bouton Regrouper par + en haut de votre écran
- Cliquez sur le menu déroulant Sélectionner un champ et choisissez le champ par lequel vous souhaitez regrouper
- Vous pouvez choisir de masquer les groupes vides ou de masquer une option de champ
Tri des vues
Le tri des idées vous permet de comparer les idées, par ordre croissant ou décroissant, en fonction d'un champ spécifique. Par exemple, vous pouvez consulter les idées les plus demandées en utilisant le champ Votes pour les trier par ordre décroissant. Vous pouvez également ajouter un deuxième niveau de tri avec un autre champ.
Pour trier les idées sous forme d'une vue Liste, survolez le titre de n'importe quelle colonne de champ et cliquez sur les 3 points pour choisir l'ordre croissant ou décroissant. Pour tout autre type de vue :
- Cliquez sur le bouton Trier + en haut de votre écran
- Cliquez sur Sélectionner un champ et choisissez-en un
- Cliquez sur la flèche vers la droite pour l'ordre croissant ou décroissant