



Reimagining software development around an AI-native SDLC
AI is now a core part of how software gets built. 93% of developers use AI tools and nearly 30% of code is AI-authored [source]. Code generation has been the first breakout use case for developers but it is not the end of the story. The next chapter is AI at every stage of the Software Development Lifecycle (SDLC): Plan, Orchestrate, Code, Review, and Operate. That requires reimagining software development around a new AI-native SDLC, and building new measures to capture the impact AI is having on it.
In this analysis, we focus on the parts of that shift where we have the strongest data today: coding and review workflows in Rovo Dev, measured through PR throughput and developer time saved.
The role of the developer has changed already
Atlassian’s State of Developer Experience report shows how quickly the developer role is changing. In 2024, only 38% of developers reported saving any time at all with AI. In 2025, 99% of developers said they were saving meaningful time every week, and re-investing this time towards improving the broader system around code such as code quality, engineering culture and documentation.
But as AI accelerates building in the code phase, bottlenecks to the left and right of code become more pronounced. Clear planning, strong code review, testing, documentation, and operations matter even more when teams are managing a growing volume of agent generated outputs. The productivity challenge now for developers is how well they can orchestrate the entire system of work around the SDLC.
Next come agents at every stage of the SDLC
What comes next is AI doing meaningful work at every stage of the SDLC, not just code generation. We believe agents will partner with humans at every stage:
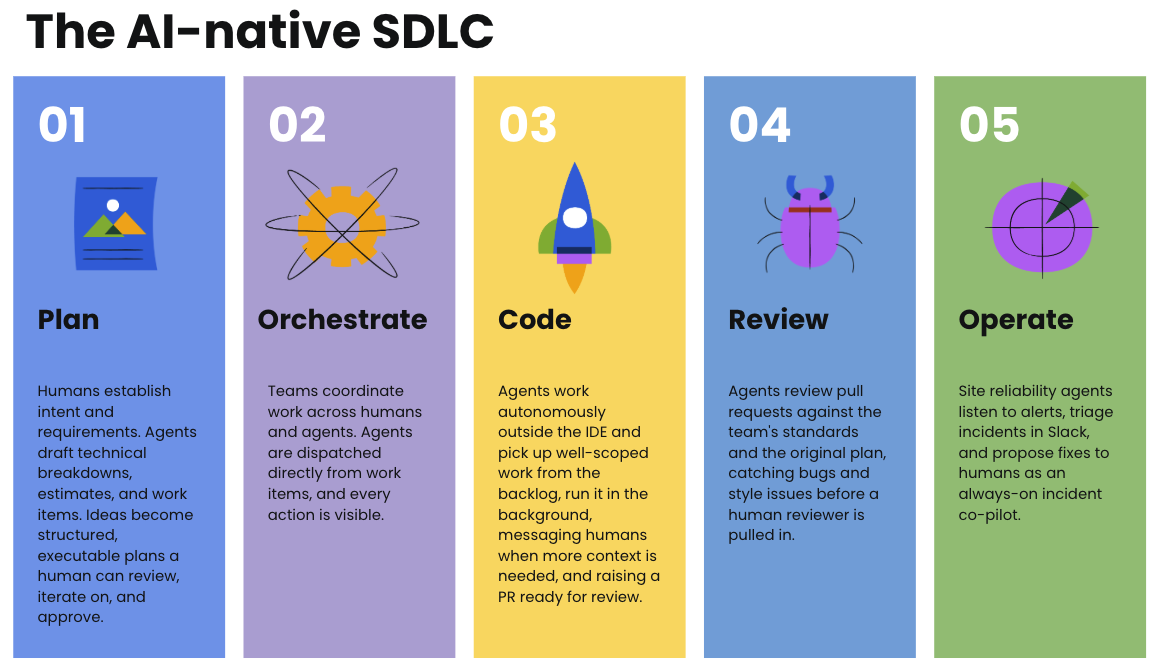
- Plan: Humans establish intent and requirements. Agents draft technical breakdowns, estimates, and work items. Ideas become structured, executable plans a human can review, iterate on, and approve.
- Orchestrate: Teams coordinate work across humans and agents. Agents are dispatched directly from work items, and every action is visible.
- Code: Agents work autonomously outside the IDE and pick up well-scoped work from the backlog, run it in the background, messaging humans when more context is needed, and raising a PR ready for review.
- Review: Agents review pull requests against the team’s standards and the original plan, catching bugs and style issues before a human reviewer is pulled in.
- Operate: Site reliability agents listen to alerts, triage incidents in Slack, and propose fixes to humans as an always-on incident co-pilot.
Put together, the SDLC stops being a one-way pipeline of human handoffs. Every stage now has its own loop of agents executing and humans reviewing. Developer productivity becomes a function of how well a team collaborates across a team of humans and agents.
Measuring productivity for an AI-native SDLC
AI is everywhere but is it increasing productivity?
With all these changes across the SDLC, AI has a measurement problem. Every engineering org has a dashboard tracking their teams’ AI usage and token consumption. Almost none have a dashboard tracking productivity gains from AI.
AI can create the appearance of productivity by producing output quickly, but if that output is low-quality, poorly scoped, or lacks context, initial productivity gains are lost to rework in review, refactoring, testing, and maintenance. AI works best when organisations first understand their system of work: how work flows, which tools teams rely on, and where data and knowledge live, so AI has enough context to create real leverage.
This is not a new problem. In 1987, Nobel laureate Robert Solow wrote, “You can see the computer age everywhere but in the productivity statistics.” Later termed the Productivity Paradox, it described how massive IT investment through the 1970s and 1980s failed to translate into productivity gains for the US economy until the 1990s.

How can we measure AI’s impact on developer productivity?
Today, engineering leaders are asking a similar question about AI. AI tools have so many promising productivity gains, but how do we measure their impact and know if they are worth the investment?
At Atlassian, we wanted to help answer this question for our customers. So we used our Rovo Dev cohort to test it: when adopting an AI-native SDLC, which metrics should customers care about and are they seeing positive increases in productivity?
Rovo Dev is Atlassian’s agentic AI for software teams, designed to reduce friction across the entire software delivery lifecycle. Today it focuses on two core capabilities: code generation and code review. Developers can use it from the terminal, inside Jira, in their IDE, and directly on pull requests in their SCM.
There are four dimensions that tell us whether a team is genuinely getting value from AI: speed, efficiency, quality, and satisfaction. Together they cover what gets shipped, how long it takes, how well it holds up, and how developers feel about the tools. These metrics provide a focused foundation for measuring the AI-native SDLC, and draw on the DX AI Measurement Framework.
| Dimension | What it measures | Primary metric |
|---|---|---|
| Speed | The velocity of an AI enabled engineering team | PR Throughput |
| Efficiency | Time savings from AI | Developer Hours Saved |
| Quality | How reliable AI code is once shipped to production | Change Failure Rate |
| Satisfaction | How developers feel about AI tools | Developer Satisfaction |
The first two metrics are the most straightforward to measure, and they’re what this blog focuses on. Together, speed and efficiency are where the productivity gains from an AI-native SDLC show up first and where we have the cleanest data to share today. Quality and satisfaction are next on our list. They take longer to measure properly, but they’re just as important.
Speed: teams merge 19% more PRs
One of the clearest ways AI should improve the SDLC is by helping teams ship more work to production (i.e. PR throughput). If AI is creating real productivity gains we’d expect to see a sustained increase in merged PRs for teams that adopt it.
We analysed 3,400 repos to determine if Rovo Dev was causing a change in PR throughput.
We sampled 3,400 repos from 2,500 customers to test whether repos that adopted Rovo Dev saw any changes to their PR throughput. The sample consisted of repos that had adopted Rovo Dev, our test group, and repos that had not, our control group.
Because we could not randomly assign some teams to use Rovo Dev and others not to, we used a quasi-experiment methodology. We compared PR throughput before and after adoption for the test group, then compared that change with similar repos in the control group. This helped us determine whether Rovo Dev adoption was associated with a statistically significant increase in merged PRs.
To make the comparison fair, we also used propensity score matching. This matched all the repos adopting Rovo Dev with similar non-adopters, allowing for an apples to apples comparison. It avoids the risk of comparing repos that were already on different trajectories, such as comparing a fast-growing team with a team whose PR activity was slowing down.
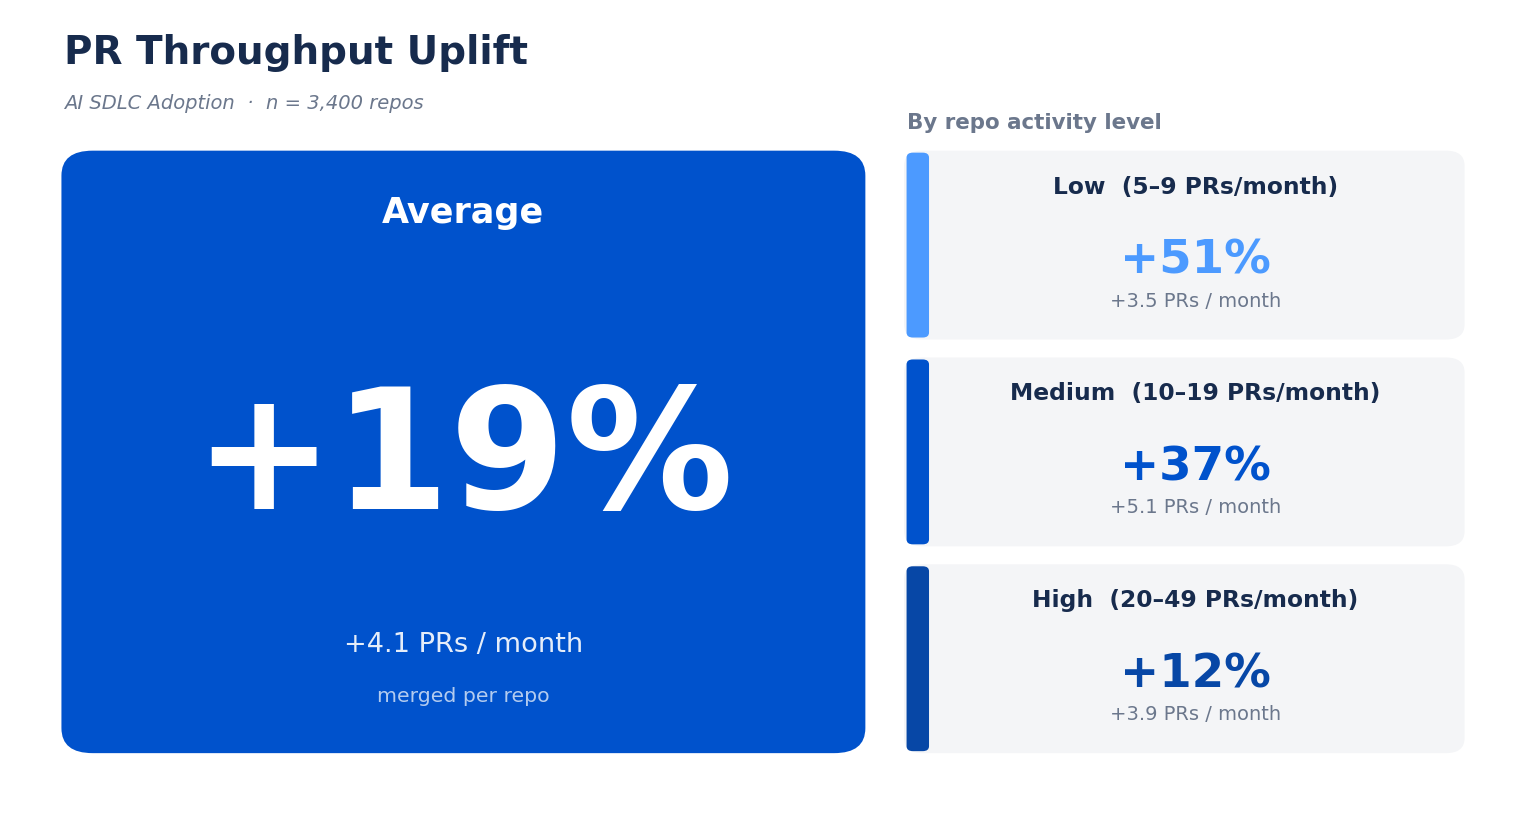
We found that Rovo Dev drives a 19% increase in merged PRs per repo.
The headline result of our PR throughput analysis found repos that adopted Rovo Dev merged 19% more pull requests per month than similar repos that had not adopted it.
Across a range of baseline activity levels, we saw repos that adopted Rovo Dev were merging an additional 3-5 more PRs per month. The relative uplift was greatest for the low and medium activity repos (5-9 PRs and 10-19 PRs per month) which saw a 37% to 51% uplift in their PR throughput. Uplift was statistically significant across all of the repository activity levels.
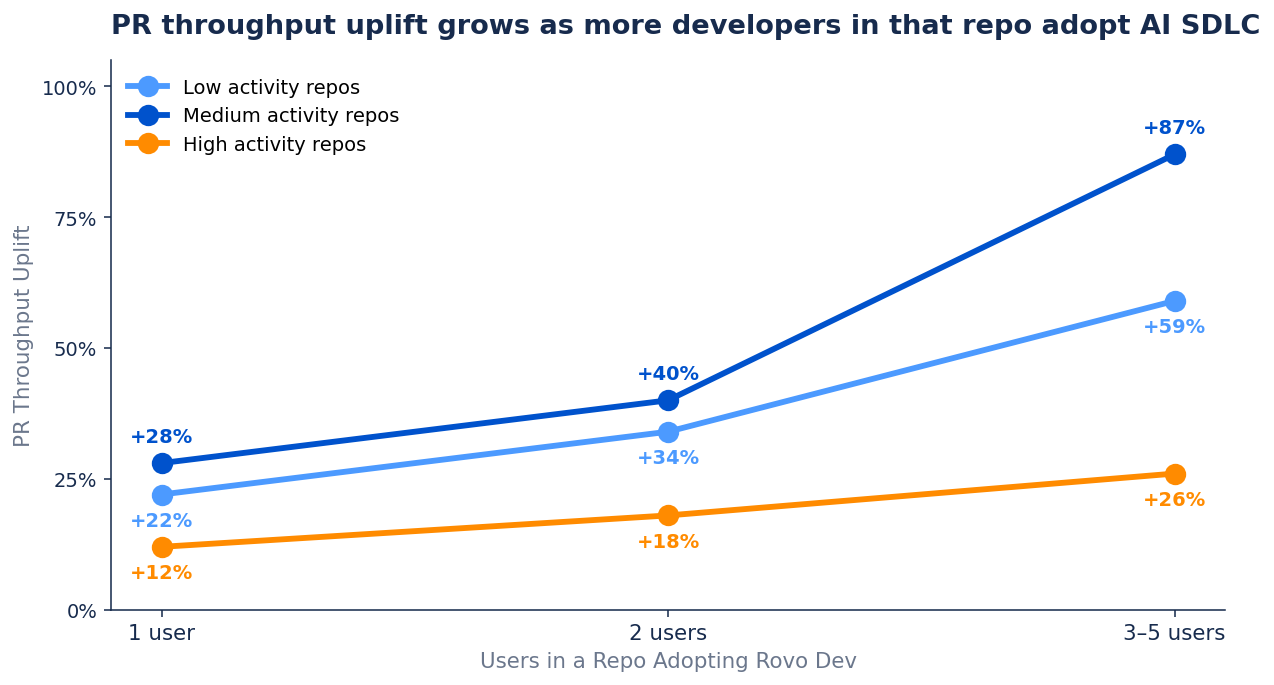
The benefits were largest when multiple users in a repo adopted Rovo Dev. For low and medium volume repos, PR throughput increased by 59-87% when 3-5 users adopted Rovo Dev, roughly double the lift seen in repos with 2 Rovo Dev users. That suggests Rovo Dev’s impact grows when adoption spreads across a team. It is not just an individual productivity tool, but a way to improve team productivity.
Efficiency: developers save 2-3 hours per week
Another area where AI should improve the SDLC is by giving developers time back across their day-to-day work (i.e. hours saved per week). If AI is creating real productivity gains, we’d expect developers adopting it to save meaningful time each week.
We surveyed more than 6,200 Atlassian developers to ask them how much time they were saving with AI code assistants
To understand time savings from AI coding agents, we surveyed more than 6,200 Atlassian developers and asked: “On average, how much time do you save each week thanks to AI code assistants?” Within the Atlassian developers cohort, 96% of the developers were users of Rovo Dev allowing us to measure the impact of using Rovo Dev as their AI code assistant of choice. Because time savings can show up across many different developer tasks, the survey gave us a simple way to capture a broader view of productivity. Self-reported data can overstate impact, so we used the time saved reported at the 20th percentile rather than the average as a conservative estimate.
We found that Rovo Dev saves 2-3 hours of developer time per week
Surveyed developers that use Rovo Dev reported saving 2-4 hours per week on coding and review tasks. This represents ~10% of the 24 hours developers typically spend on these tasks in a 40-hour week (industry baseline). Internally, we found developers have an average of 2.15 Rovo Dev assisted merged PRs per week, which means the pull request was either reviewed or coded by Rovo Dev. In comparison, our customers have on average 1.59 Rovo Dev assisted merged PRs per week. If we standardize the internal self reported time savings for external customers based on usage intensity then we expect Rovo Dev to save on average 2-3 hours of developer time per week.
For a team of ten, this translates to 20-30 hours per week reinvested into higher-value work — design decisions, debugging, collaboration, and improving code quality.
Internal Developer Self Reported Time Saving – March 2026
| Cohort | Users | 20th Percentile Time Saving | Median Time Saving | 80th Percentile Time Saving |
|---|---|---|---|---|
| Rovo Dev Users | 6,093 | 2-4 hours | 4-6 hours | 6-8 hours |
| Other AI Solution Users | 30 | 1-2 hours | 4-6 hours | 6-8 hours |
| No AI Usage | 94 | 0 | 0 | 0 |

What we learned and what’s next
The biggest takeaway from this analysis is that AI’s value in the new AI-native SDLC can be measured and managed. For engineering managers wanting to measure productivity gains from AI, that means shifting focus from usage based metrics (e.g. active users, token consumption) to towards developer productivity impact metrics (e.g. PR throughput, hours saved), in line with frameworks such as the DX AI Measurment Framework. The challenge is not getting developers to use AI. It’s turning AI adoption into measurable productivity.
That is how we answer the modern version of Solow’s productivity paradox. We can see AI everywhere. But is it showing up in productivity measures? In our analysis, it does. Teams adopting Rovo Dev are shipping more code and getting hours back each week.
There’s still more to measure. Directionally, quality and satisfaction look stable for Rovo Dev users, but the next step is to put rigorous measures in place for both, the way we did for speed and efficiency. Only then we can see if AI-native SDLC adoption is delivering full value to your organisation.
The AI-native SDLC gets more powerful when agents have the right context. At Atlassian we are seeing significant benefits from this. The Atlassian Teamwork Graph is providing a shared context layer across the SDLC that produces outputs that are more relevant, useful, and trusted. AI that is enriched by the Teamwork Graph delivered 44% more accurate results while using 48% fewer tokens [source].
There are multiple AI-native SDLC tools and our internal Atlassian engineering organization are heavy adopters of Rovo Dev with 1.35x more Rovo Dev assisted pull requests merged per week compared to customers. As heavy adopters, this gives us a tight feedback loop to make the product better for our customers.
If you’re thinking about rolling out Rovo Dev to your engineering team, our recommendation based on this data is start with a team, not an individual. Pick a repo with 3–5 engineers who will actively use the product. Measure throughput and time savings 2-3 months after implementation to ensure novelty effects have worn off and benefits are sustained.


