
Statuspage customers logged more than 104 years of collective incidents in 2017. We’re always interested in the ripple effects of downtime, and with a few high-profile outages taking place in 2017, we wanted to see what our numbers had to say.
To get a handle on this, we decided to look through our data on how many incidents we help our thousands of customers communicate. These represent anything from small interruptions or slowdowns in service to planned downtime for scheduled maintenance to full-blown outages.
Among the findings:
- Throughout 2017, Statuspage customers posted 104.5 years worth of collective downtime.
- Almost 175k incidents were posted during the year.
- 456,405 incident updates were posted through the year, meaning an average of about 2.6 updates per incident.
Add it all up and you have a string of events more than a century long.
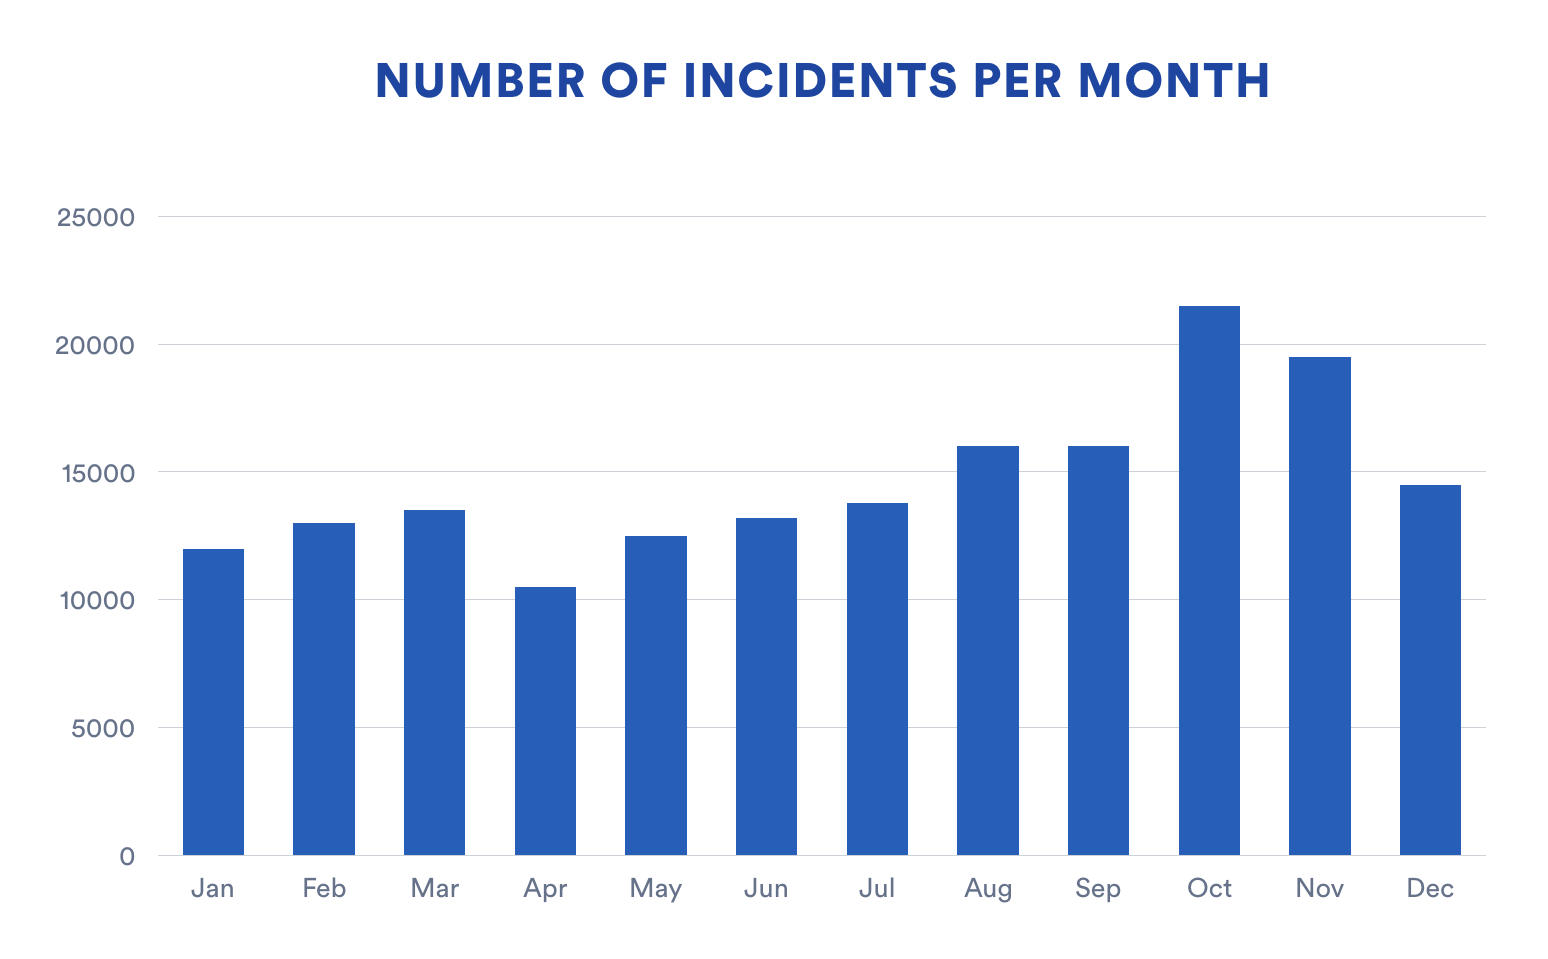
We can only hypothesize as to what accounted for the spike in October. Though we typically see more incidents toward the end of each year because more customers are joining our platform. More customers, more incidents. At the same time, however, December is typically a quieter month for us. One possible explanation — based on our own experiences — is simple seasonality. Dev teams may not be pushing the kind of big changes that could trigger an outage. With many folks taking time off around the holidays, a lot of teams use a late-December code freeze, looking to ride through the final days of the year with some stability.
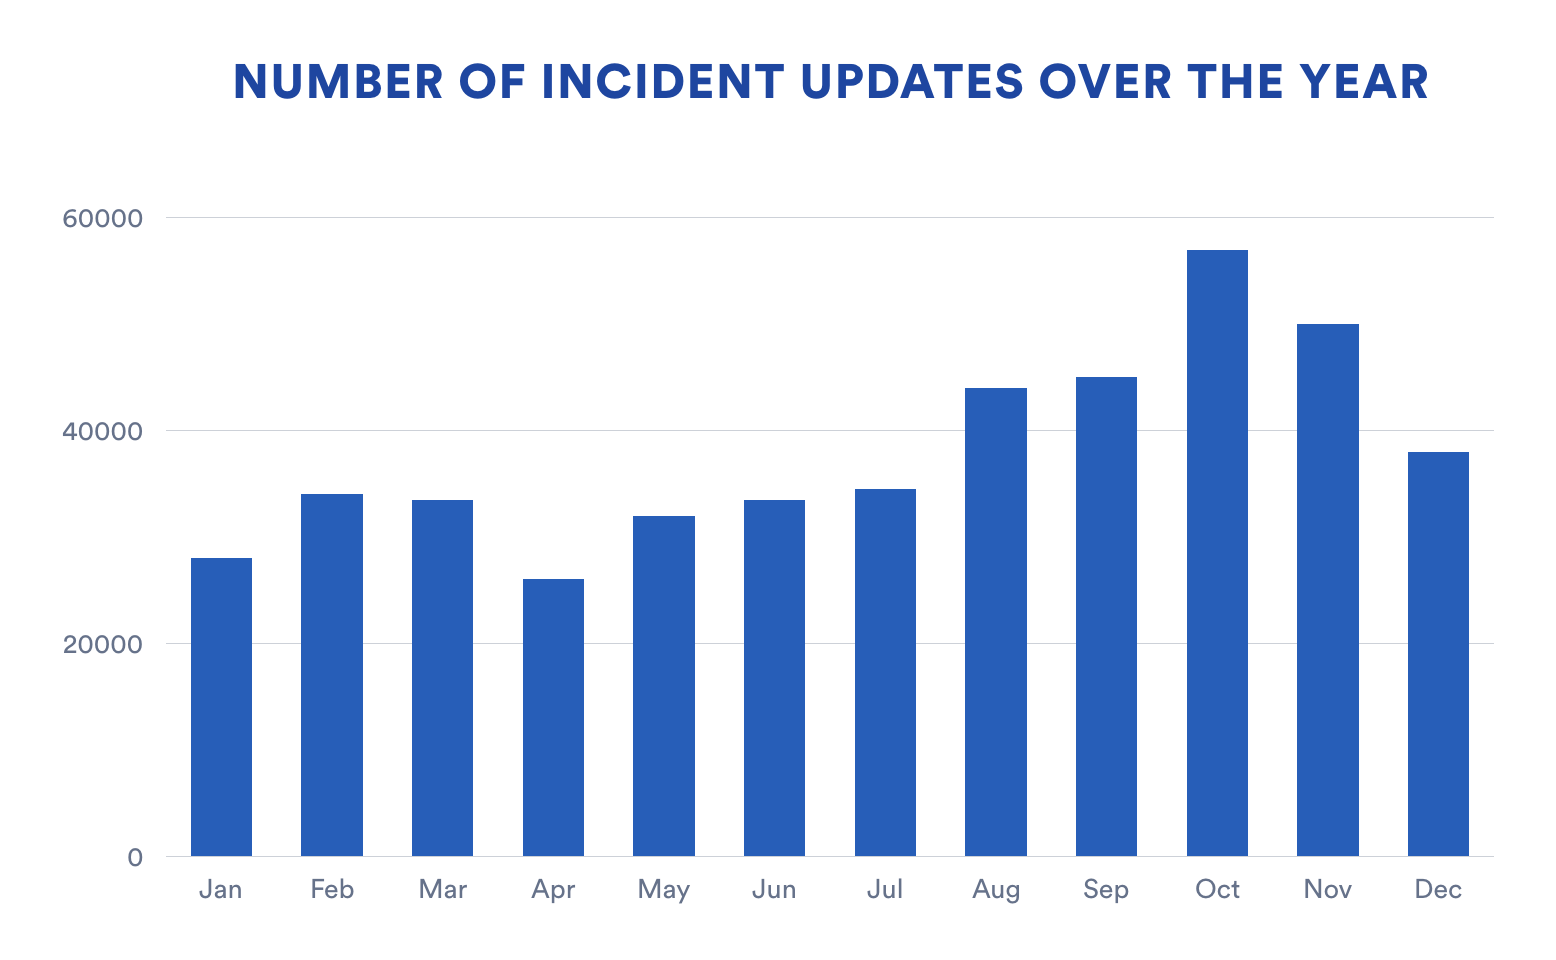
This chart shows the number of incident updates through the year. Notice how consistently it maps to the number of total incidents.
The day AWS S3 went down
The year’s biggest outage was by far the Amazon Web Services outage on Feb. 28.
Amazon’s S3 storage service went down in its US-EAST-1 Region for the better part of 4 hours, causing a snowball effect of outages across countless websites and apps that count on S3 to store assets. It was a very unusual outage and we saw those effects first-hand in our database.
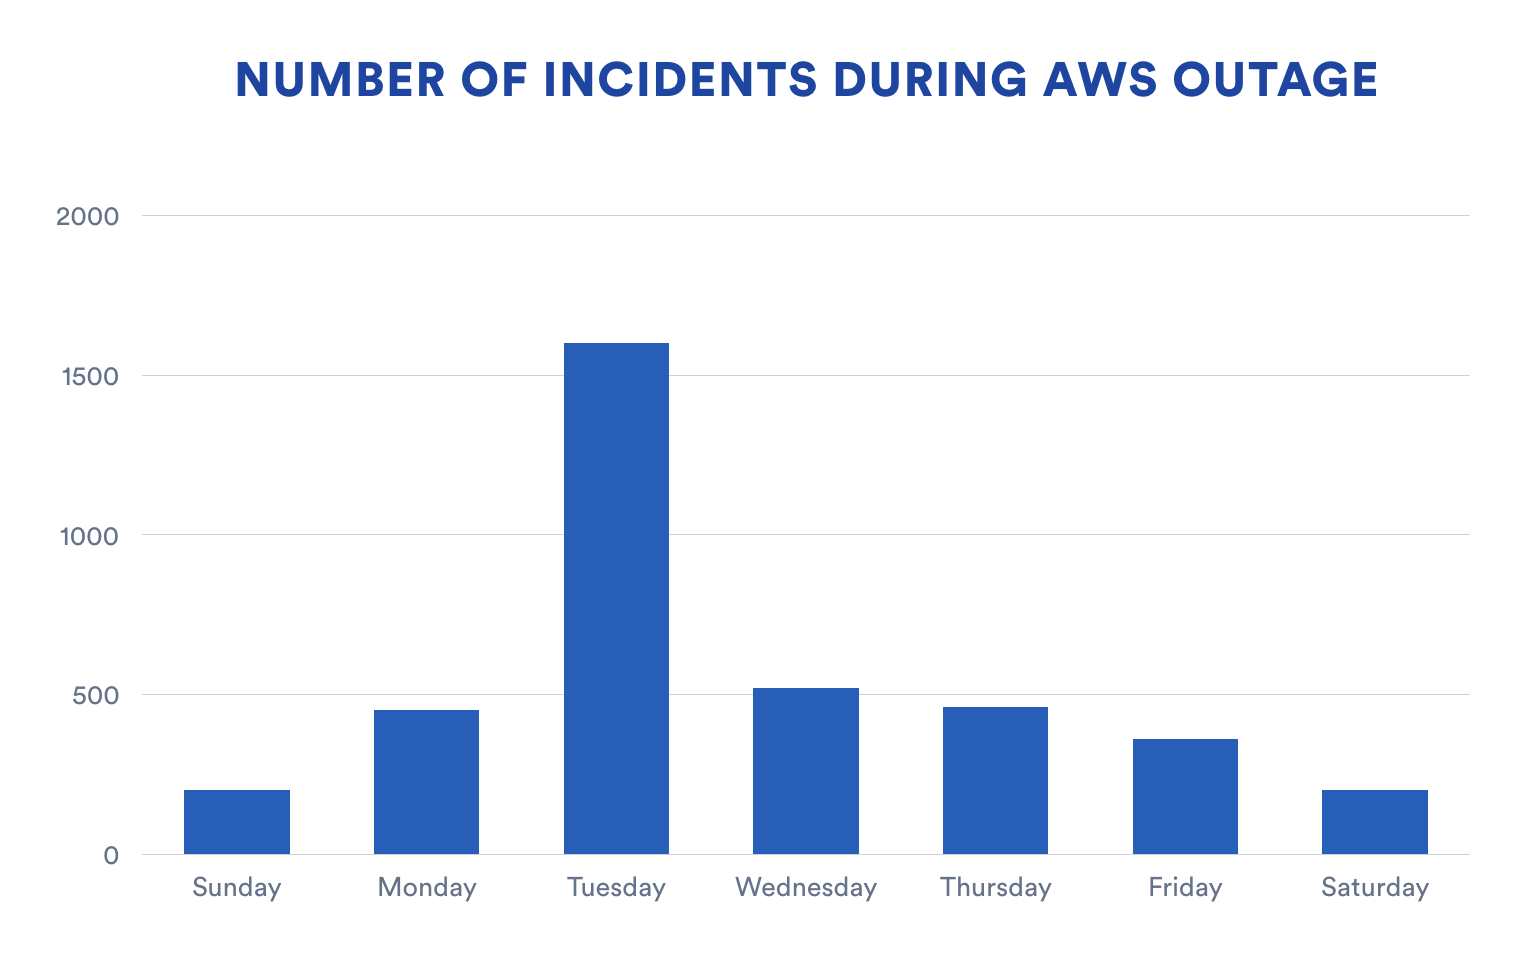
This chart shows total incidents open across all of our customers each day of the week AWS had its outage. You can see clearly the explosion of new incidents the day of the outage. It’s also notable to see the effects of the incident across the rest of the week. Even though AWS was back up and running within a few hours, it was a full three days before we saw incident volumes return to normal levels.
What’s also interesting about the AWS outage is that none of our customers was the official source of info on this incident. Only AWS knew the exact root cause at the time and only they had an idea of what had to happen for things to get up and running again. Despite the incident happening in a bit of a black box, many of our customers took the initiative to post incidents and update their users the best they could. Rather than adopt a “someone else’s problem” attitude while their users suffered, these teams took action and kept their stakeholders in the loop as best as they could.
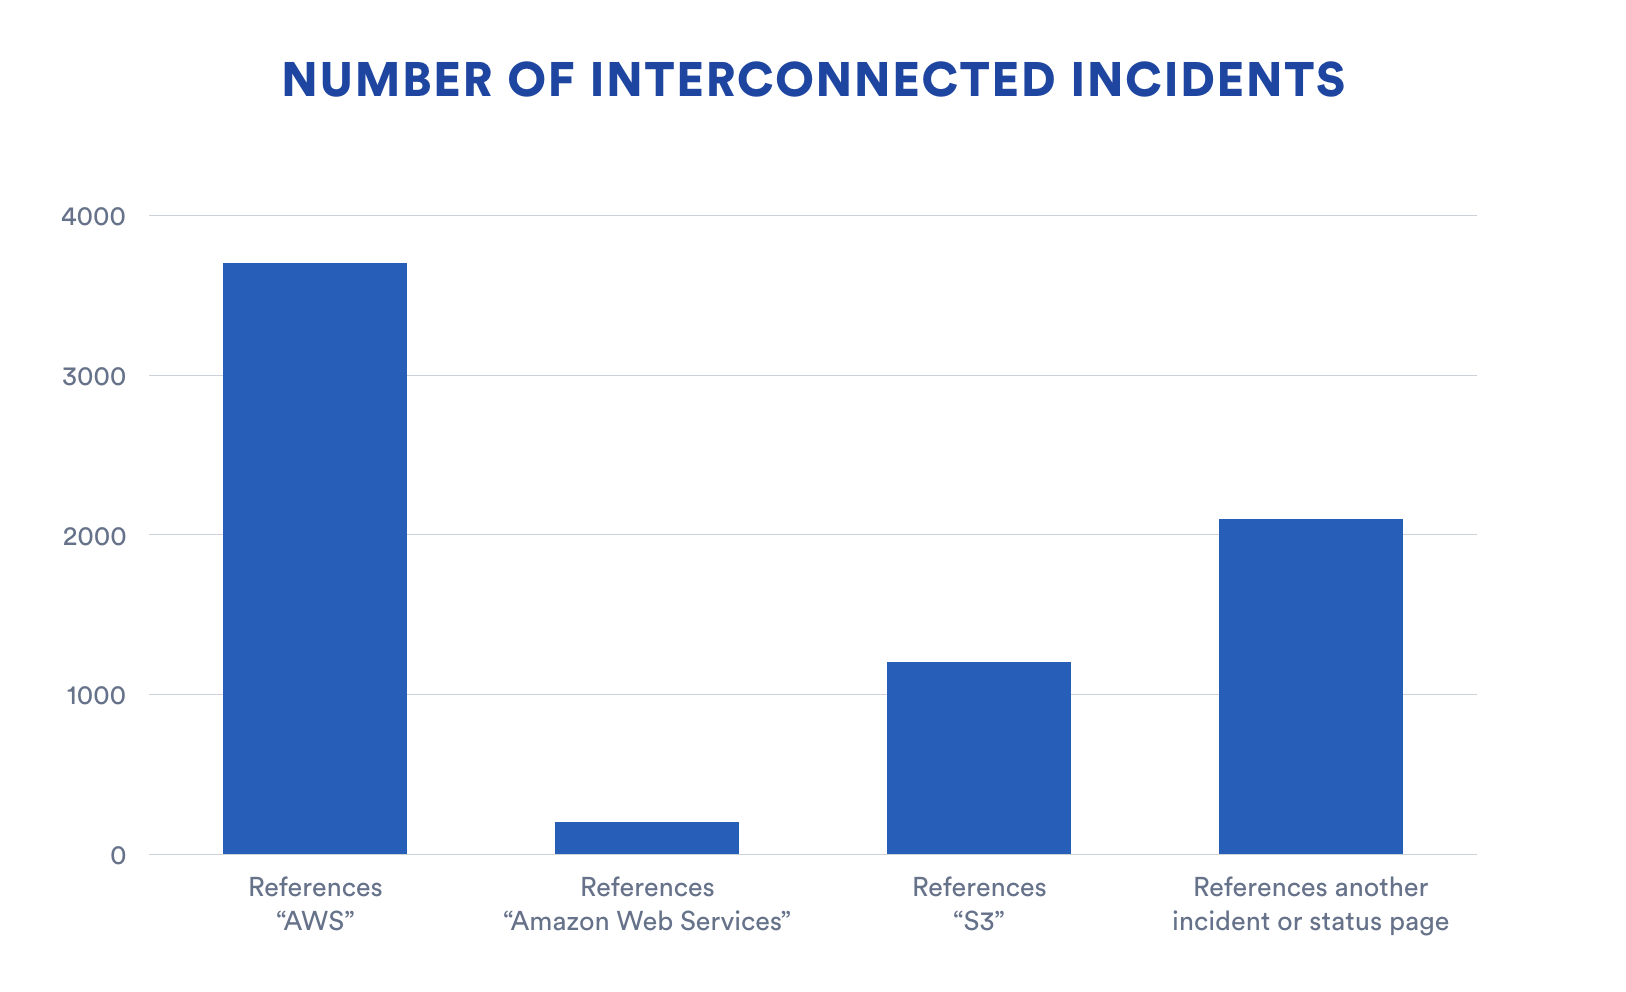
This chart shows how strong of an impact AWS has in general across the web. The data here represents incidents throughout the year that mention certain strings related to AWS. For example, it would include an incident with the description: “A spike in API calls is causing response slowdowns, we’re spinning up another AWS instance to handle the traffic.”
The fourth bar here is an intersting look at the interconnected nature of incidents. This shows the number of incidents that include a link to another incident or status page. Most likely this would be an incident with an upstream provider that’s causing an interruption in service.
What this all means to us
To us, this data, alongside our first customer survey, is proof that smart incident communication is more important than ever. Obviously this data isn’t a perfect representation of downtime all across the web, it’s tricky topic to pin down. But nonetheless it shows us some interesting behavior.
But what this does show us is that outages and service interruptions are a consistent, expected part of the cloud world. Day in and day out, there’s some service somewhere that should be online and isn’t. Meta events like the AWS outage cause an industry-wide spike, but even outside of these events, there’s plenty of downtime and service interruption going on.
It’s a good reminder that downtime is a fact of life. Learning from outages and developing thoughtful plans for dealing with them is worlds more effective than crossing your fingers and hoping outages never come. For more on how to set up a downtime communication plan, check out our guide here: How to prepare for and communicate during downtime


