Imagine walking into a status meeting knowing things are on track before anyone says a word. Or coming back from vacation and seeing detailed project updates from a quick glance, before even checking email. This could be you!
And what about when things (inevitably) go wrong? Know the moment a growing bug pile overtakes current velocity. Demonstrate which team members are critical to progress before they’re poached by another project.
Let’s create a killer dashboard in Jira! Keep an eye on progress and identify bottlenecks ahead of time:

Step 0: create a new dashboard.
Simple. Go to Dashboard, select ‘Create Dashboard’. Name it whatever you like!
Step 1: add these five gadgets
Start with the bare necessities: overall progress, work split by person or sub-section, and high-risk issues front and center. Add:
- Filter Results
- Created vs Resolved Chart
- Issue Statistics: add this one twice
- Road Map
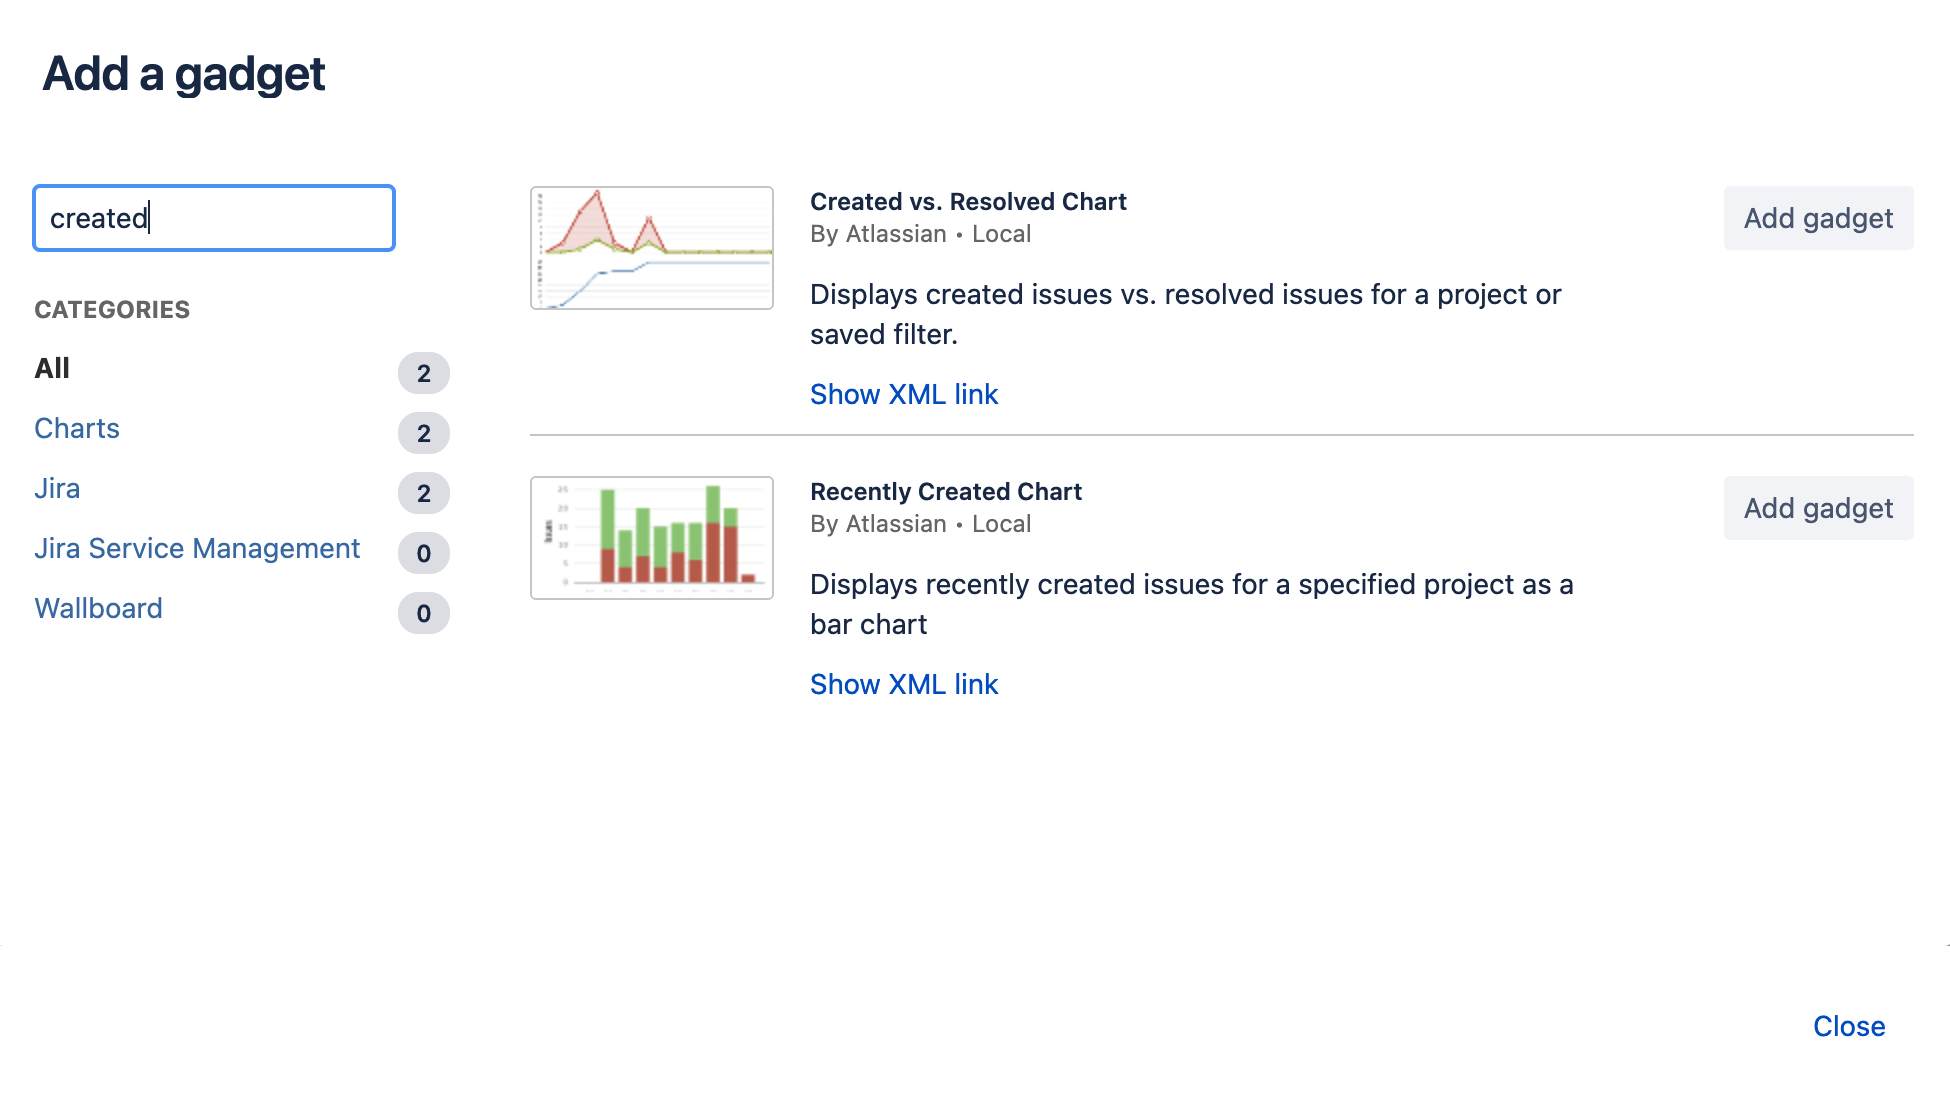
Once you’ve added all five, close the dialog.
Step 2: view progress at-a-glance
Every morning you come in with a ‘feeling’ about how things are coming along. Use the Road Map gadget to reaffirm your hunch each time you glance at the dashboard.
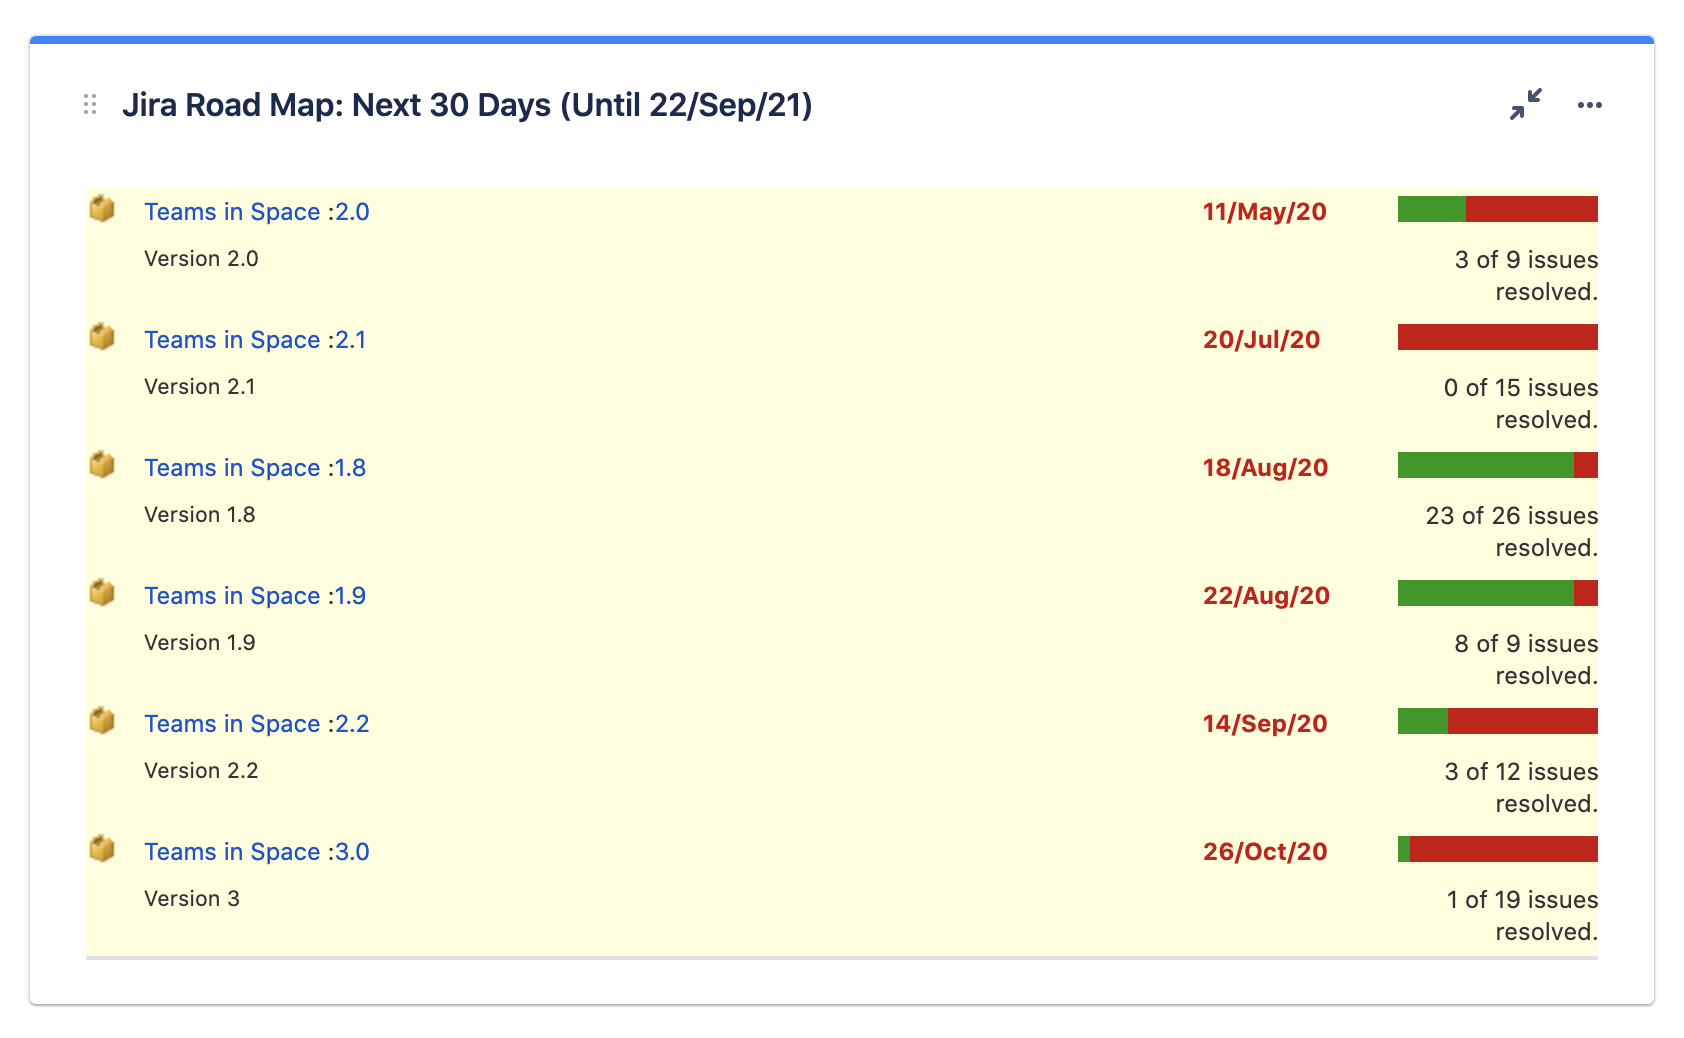
The Road Map gadget gives you a quick view of the number of issues assigned to your next release, and how many of those have been resolved.
- To keep things simple, configure this gadget to show just one Project (we’ll stick with this same project for the entire dashboard), and leave the other fields with the default selections.
- Click ‘save’ and you’ll see the aggregated progress of issues, based on the selected Fix Version. Note that the status of issues with no Fix Version won’t be reflected here.
Step 3: spot bottlenecks and problems ahead of time
Who’s carrying the weight
How much work will be pushed back if a team member calls in sick? What if someone gets pulled in to help on a side project? You need to know which team members have a larger workload, so you can demonstrate who is critical to your release and why, and maintain a back-up plan.
A visual indication of workload per person is critical to keeping a handle on team progress.
- For the first Issue Statistics gadget, pick the same project as above, and select to compare stats by Assignee.
- Set ‘Show Resolved Issue Statistics’ to No, because resolved issues aren’t going to affect future progress.
Which project areas require more effort

Naturally, some aspects of your project are more important than others. It’s up to you to keep your team working on the right parts: if the rest of the company is focused on onboarding first-time users, but your current work is weighted toward increasing performance with large data sets, you’ve got a problem.
Visualizing workload in the way your team categorizes sub-sections of your project, Jira Components, will let you see where the team is investing energy so you can be sure your project fits within the larger organizational goals.
- For the second Issue Statistics gadget, pick the same project again.
- Compare stats by Component (again set ‘show resolved issue stats’ to No).
Note that you can later change this selection if, for example, you want to monitor Issue Type to see the relative percentage of bug fix to feature work remaining.
Step 4: work for the current milestone
You want to know immediately when things get de-railed, so it’s critical to keep an eye on progress toward the next release. When bugs pile up at a higher rate than usual, or scope change adds new features after release dates have been set, you’re going to need to re-evaluate project milestones.

Watching how much work is being added is the way to ensure that target dates are realistic.
Jira dashboard gadgets can display information by Project, as we’ve seen above, and you can drill into more specific details by building a saved search, called a Filter.
- Go to the Issues tab in the Jira header, and switch to Advanced mode. Start typing and Jira will auto-complete search options for you!
- Select your project and add the parameter for Fix Version. The dynamic operator earliestUnreleasedVersion() will display issues based on the release dates you’ve set up for your project versions.
- Save this filter and give it a descriptive name, something like Issues in Next Fix Version.
- Go back to your dashboard to select your new filter, Issues in Next Fix Version, for the created vs resolved chart gadget. Leave the other fields with their default values for now.
Will you hit target dates?

If progress is on target, the number of issues resolved (work completed) should exceed the number of issues created (new work added). If surprise issues are popping up, running the risk of pushing back your release date, your chart might look like the one at the left.
The amount of work added (red) is increasing, while the amount of work completed (green) remains consistent. Either the team will need to step it up or the estimated release date will push back.
Step 5: watch out for high-risk items
There’s always a sub-section of project work that comes with extra risk. Issues with a large time estimate are known to be complex, and existing work that has been revised as a larger time-sink are red flags.
Modifying an existing Filter is a great way to drill down into a sub-set of current work. Go back to Jira’s search by selecting the Issues tab. The filter from Step 4 is probably still there, and we’re going to build on it (if there’s no search selected, find it in your search History list on the left, or in the Issues drop-down menu at the top).
- Select the Edit tab to create another advanced search. Add on the time estimate parameter:
project = "Angry Nerds" AND fixVersion = earliestUnreleasedVersion() AND originalEstimate > 4h
- Save this as a new filter, giving another descriptive name like Estimated over 4 hours.
Keep the big issues front and center
Go back to your dashboard and configure your new filter to appear in the Filter Results gadget.
- Select the Estimated Over 4 Hours filter, and add the Assignee field in addition to the four default columns that appear. You’ll want to see at a glance who is working on those large issues.
Finish your dashboard: clean-up and what else is missing?
This tutorial was designed to give you an idea of what’s possible. You’ll naturally spot areas where you’ll want to dive into a deeper subset of project work; a dashboard is a living page, and you should tweak and evolve things as necessary. Here are some ideas:
- Toward the end of a release cycle, bug fixes become critical. Edit the filter for the created vs resolved chart gadget to narrow your search to just Bugs.
- Keep an eye on orphaned issues: add a Filter Results gadget with a filter that selects all issues in your project where fixVersion changed to EMPTY.
- Some people like charts better than percentage bars, so display work breakdowns visually: try the Heat Map or Pie Chart gadget with your filter ‘Issues in Next Fix Version‘.