Making sense of your data is essential to the financial health of your company. It’s how you know whether your DevOps practices are moving the bottom line, and whether they’re actually helping your team ship faster or deliver better code. That’s why so many teams spend hours exporting data from dozens of tools, sitting in back-to-back post-mortem meetings, or slumped over the keyboard building dashboards. So why is measuring development performance still such a Herculean task?
Every company has data, but few have insights.
In our 2020 DevOps Trend Survey, we found that, while a majority of teams have seen a positive impact from adopting DevOps, half of them are still unsure of how to measure and improve their organization’s processes. So today, we’re announcing four new features in Jira Software Cloud that allow developers to visualize and measure progress from idea through to production across Atlassian and third-party tools, right alongside your issues.
More visibility and better insights with Jira Software Cloud
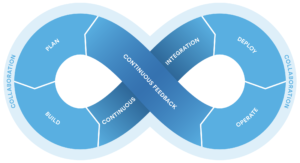
In the quest to reach that near-mythical land of “insights,” many teams mistake consolidation for control. But the challenge is not the number of tools; it’s the way they’re integrated. No single vendor will ever deliver all the products an agile software team needs, so the burden still lies on the team to manually connect the dots.
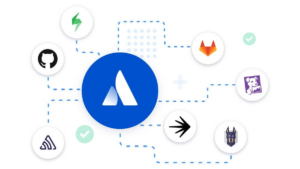
This is where Jira comes in. Jira is the backbone of your modern software development toolchain, where developers can plug in the tools they want while management and product can have the visibility and reporting they need. Each piece of work across both Atlassian and third-party tools – whether it’s an idea, commit, branch, or bug fix – is linked to a Jira ticket and ladders up into top-level visibility and insights. Whether you’re a business analyst working in Google Sheets, a designer in Figma, a developer in VS Code, or an engineering manager in GitLab, our mission is to empower you to work in any tool without the overhead of manual coordination.
Introducing:
- Code in Jira: Stay focused on your code and (almost) never be disrupted by another ping asking which team is working on what code and in which repo. With Code in Jira, anyone on the team can simply open this view to see the most recently active repos across Bitbucket, GitHub, GitLab, or Git Integration for Jira, automatically surfaced right in Jira.
- Deployments in Jira: Anyone on the team can get a real-time view of where a deployment is, across any CI/CD provider, as it moves through the pipeline – without having to ask a developer. Since every work item across Atlassian and third-party tools is linked to a Jira issue, you’ll be able to track and measure from idea through to production.
- Deployment frequency: We’ve taken the metric that high-performing software teams care about most and expanded it to track performance across any CI/CD provider. Jira automatically calculates how often your team is shipping value and how this is trending over time so that you don’t have to manually coordinate across tools or bug your ops team.
- Cycle time: Go beyond just measuring average lead time. Jira is the only tool that can track down to the granular view of each segment of the development workflow, since each piece of work across all Atlassian and third-party tools are tied to a Jira issue. Surface specific actionable insights on bottlenecks and optimize the team’s workflow as you go.
If you can’t measure it, you can’t improve it. Read on to see how you can turn your team’s data into actionable insights.
Code in Jira
With Code in Jira, anyone can self-serve all of the code being worked on across Bitbucket, GitHub, GitLab, or Git Integration for Jira, right within Jira. Whether you’re a project manager or a developer looking to collaborate with another team, Code in Jira helps gets you up to speed by showing the most recently active repositories in order of activity. Just add issue keys in your commit, branch name, or PR summary from your source code provider of choice, and Jira will automatically parse out the repo where that activity occurred and display it on the page.
Deployments in Jira
Wondering if your work has shipped? Or are you constantly being asked when something will ship?
A real-time view of customer value is often something that only operations and some blessed developers have access to. Lack of access to this information can slow decision-making and lead to more meetings and even duplication of work.
Deployments in Jira surfaces all deployment information, offering self-serve data showing what value was shipped to customers and when, across any CI/CD provider, from Bitbucket Pipelines to leading third-party vendors such as Jenkins, Azure DevOps, Circle CI, Octopus Deploy, and JFrog.
It’s especially important for fast-growing, agile teams to keep a pulse on what’s being deployed. Damir Prusac, VP of Engineering at Infobip, says that, as his organization grows, their number of deployments constantly increases, “[A]nd keeping deployments high helps us stay agile.”
Whether you’re a product manager looking to see which features have deployed to which environment or a team lead looking to understand the average time it takes for your team to go from idea to production within a certain project, you’ll find your answer in the Deployments in Jira tab. To turn on Deployments in Jira, simply include issue keys in your commits as part of your development process, and your deployments will automatically update in this view.
Tip
Take a deeper look at the Code in Jira and Deployment feature videos and join us for a live AMA with our DevOps product managers here.
Deployment Frequency
From talking to customers, we’ve found that 74 percent of teams measure success through deployment frequency. Deployment Frequency surfaces deployment trends to help teams understand how often they’re shipping value and how this is trending over time. Easily identify outliers in your deployment process, access how well your team is managing batch sizes, and find opportunities to reduce risk.
Cycle Time
Cycle Time surfaces current cycle time and historical trends to help teams understand how long it takes them to ship value, and how this is changing over time. Jira is the only tool that can track down to the granular view of each segment of the development workflow, since each piece of work across all Atlassian and third-party tools is tied to a Jira issue. Using the Cycle Time calculation, you can see which segments are taking longer than expected, identify bottlenecks, and determine where problems most commonly occur.
Stay focused on your code as Jira connects your dev, IT operations, and business teams with DevOps automation flowing through our first-party and third-party tools (over 1.4K integrations through our DevOps Marketplace). Through our unified data model, Atlassian handles the complexity of understanding data across a multi-tool world, giving you elevated control and visibility into a once-fragmented toolchain. And if there’s a tool you’re interested in but don’t see listed in our Atlassian Marketplace, you use Atlassian Connect to access our open REST APIs. We’re here to future-proof your DevOps practice, because reaching true transformation isn’t a big-bang change – it’s a lot of little journeys.