
Organization is key to any team with mounds of data to track – especially IT teams. One tool that can help keep your workflows on track is an information technology dashboard, or IT dashboard, an interface used to store and organize crucial IT-related information from several data sources and display them into a unified, easy-to-access platform. An IT dashboard can help project managers, chief technical officers (CTOs), chief information officers (CIOs), and other IT specialists identify issues before they snowball into larger problems.
One crucial function of IT dashboards is their reporting features. Certain key performance indicators (KPIs) track the quality of IT projects and can help optimize cost management, problem-solving, and ticket management for IT teams. A dashboard with the right IT KPIs simplifies your data by dividing it into smaller chunks of real-time visual information, making it easier to manage. These KPIs can help you determine what you’ve been doing right and where you’ll have to make improvements.
Here are four critical IT KPIs that will ensure your dashboard gives you an effective snapshot of your IT functions to keep things running smoothly.
1. Open tickets vs. closed tickets

Five ways to prioritize and resolve IT support tickets faster
We know what it’s like to work on a team that is continuously seeking ways to put out fires daily, reduce drive-bys, and find ways to reduce your support ticket queue. That’s why we’ve put together a list of ways to prioritize and resolve support tickets faster.
Often, a large number of pending tasks pile up, indicating a gap in your existing system. If you don’t keep up with the opened tickets daily, then the backlog will get out of control. Recovering from that point becomes challenging, so it’s necessary to track your ticket backlog regularly. One way to do this is to compare the difference between your open and closed tickets using a ratio, indicating whether your backlog is growing or shrinking.
This comparison shows how efficiently various levels of support are managing their ticket workload. Of course, your backlog will never be zero – ideally, you want as small a backlog as possible.
A higher number of open tickets for a specific support level, especially tickets that have been backlogged for more than a month, is a sign that something needs to be fixed. For example, it might make sense to adjust resource allocation across support levels or even hire more staff to resolve issues. Overall, this KPI can offer a general overview of the health of your IT support.
2. Number of critical bugs
New bugs and issues emerge on a daily basis, so teams have to prioritize their IT dashboards to monitor the most critical ones that are reported internally (by your team) and externally (by your customers). A critical bug is one that threatens a complete shutdown – for example, when a user logs into a website and causes it to crash.
If your customers report too many bugs, it can hurt your brand image, and they might end up looking to your competition for a better experience.
Every IT team knows that catching bugs and other issues early will help ensure that fewer resources are spent on addressing them. According to a study by IBM, the cost of fixing an error detected after product release is at least four times higher than an error identified during the design phase.
Tracking critical bugs can also help you draw conclusions about the following:
- Is there any platform that gets more bugs than others?
- How long does it take to resolve bugs?
- Are your quality assurance (QA) professionals providing any insights before these bugs reach customers?
3. Mean time to repair (MTTR)

Flip your thinking to find the right incident management KPIs
Figure out what you’re trying to learn, then see which metrics can serve you.
Have you ever wondered how much time your support staff spends on repairs? If so, this KPI can help. The MTTR measures the average amount of time from the moment an incident is reported to when it’s resolved and closed (an incident is resolved when the relevant system comes online again) and tracks the time that went into testing. MTTR offers a glimpse into your IT department’s performance (i.e., how reliably and quickly they are resolving IT issues).
To calculate MTTR, you need to measure it over a specific period (e.g., yearly, quarterly, monthly, or weekly), and record the time your support staff spends on fixes. Then, divide by the number of repairs that were completed during that time.
Mean time to repair = Time spent on repairs / Number of total repairs
For example, suppose your company spent around 15 hours monthly on repairs, and during that time, they worked on 12 different incidents. This means your monthly MTTR is:
15 hours / 12 total repairs = 1.25 hours
4. IT ROI
IT ROI (return on investment) is the profit an investor generates from their monetary contribution in an IT project. This KPI is used to measure the efficiency of your investment in IT projects, operations, and technologies.
The IT department is a vital cog in any organization, but its operation shouldn’t come at the expense of your organization’s financial health. The latest IT initiatives, such as the use of private cloud, can feel quite promising, but the cost of IT spending doesn’t always align with the benefits you get.
A KPI like IT ROI can help you refine your tech strategy by dropping projects and initiatives that are no longer financially feasible and minimizing costs. For example, you may find that your employees spend more time troubleshooting your automated email software than they spent writing emails in the first place. In that case, you can replace it with a more user-friendly tool to help them write emails faster.
By showing your IT ROI to higher management, you can defend the allocated IT budget and even convince them to extend it. You can show managers that you know what you’re doing, where you’re spending, and how smart your spending is, and justify the importance of your information technology investments.
Determining the right IT KPIs to track is just the first step
Coming up with the right IT KPIs can help align your IT department with the desired business goals at your company. This alignment enables management and strategists to answer important questions, including:
- Are IT projects delivered effectively and efficiently?
- How productive is your IT personnel in resolving issues?
- Are end-users and customers satisfied with IT support?
Using a trendy data analytics tool doesn’t guarantee success on its own. You have to make sure your dashboard implementation can visualize the information that’s most important for your business goals. If you haven’t set a KPI to measure IT ROI ahead of time, then there’s no way to assess the meaning of the data or to measure success for your projects.
Tools to get your IT dashboard started
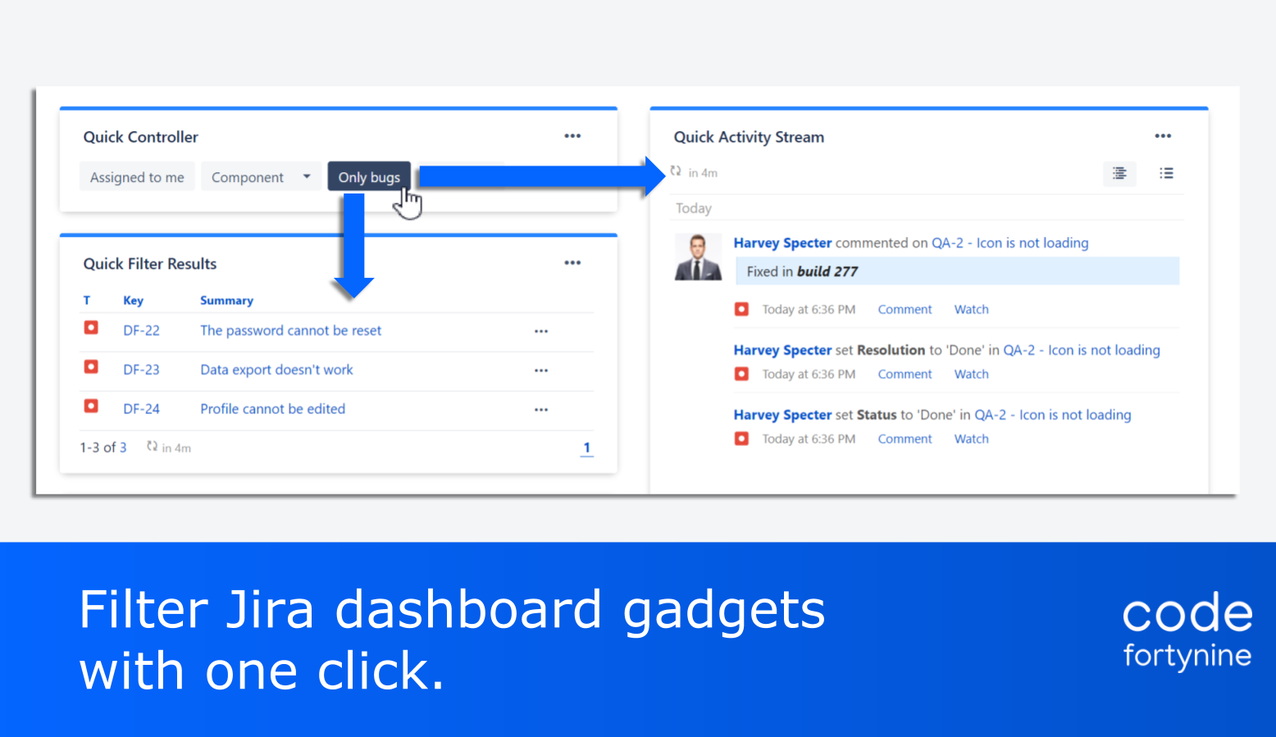
If you use Jira, Confluence, or Bitbucket, you can improve your dashboards with apps from Atlassian Marketplace. Here are a few examples to get you started: Quick filters for Jira dashboards: This app makes it easy to set up an interactive Jira dashboard, use advanced gadgets, create rich reports, and aggregate values from any number field.
- Quick filters for Jira dashboards: This app makes it easy to set up an interactive Jira dashboard, use advanced gadgets, create rich reports, and aggregate values from any number field.
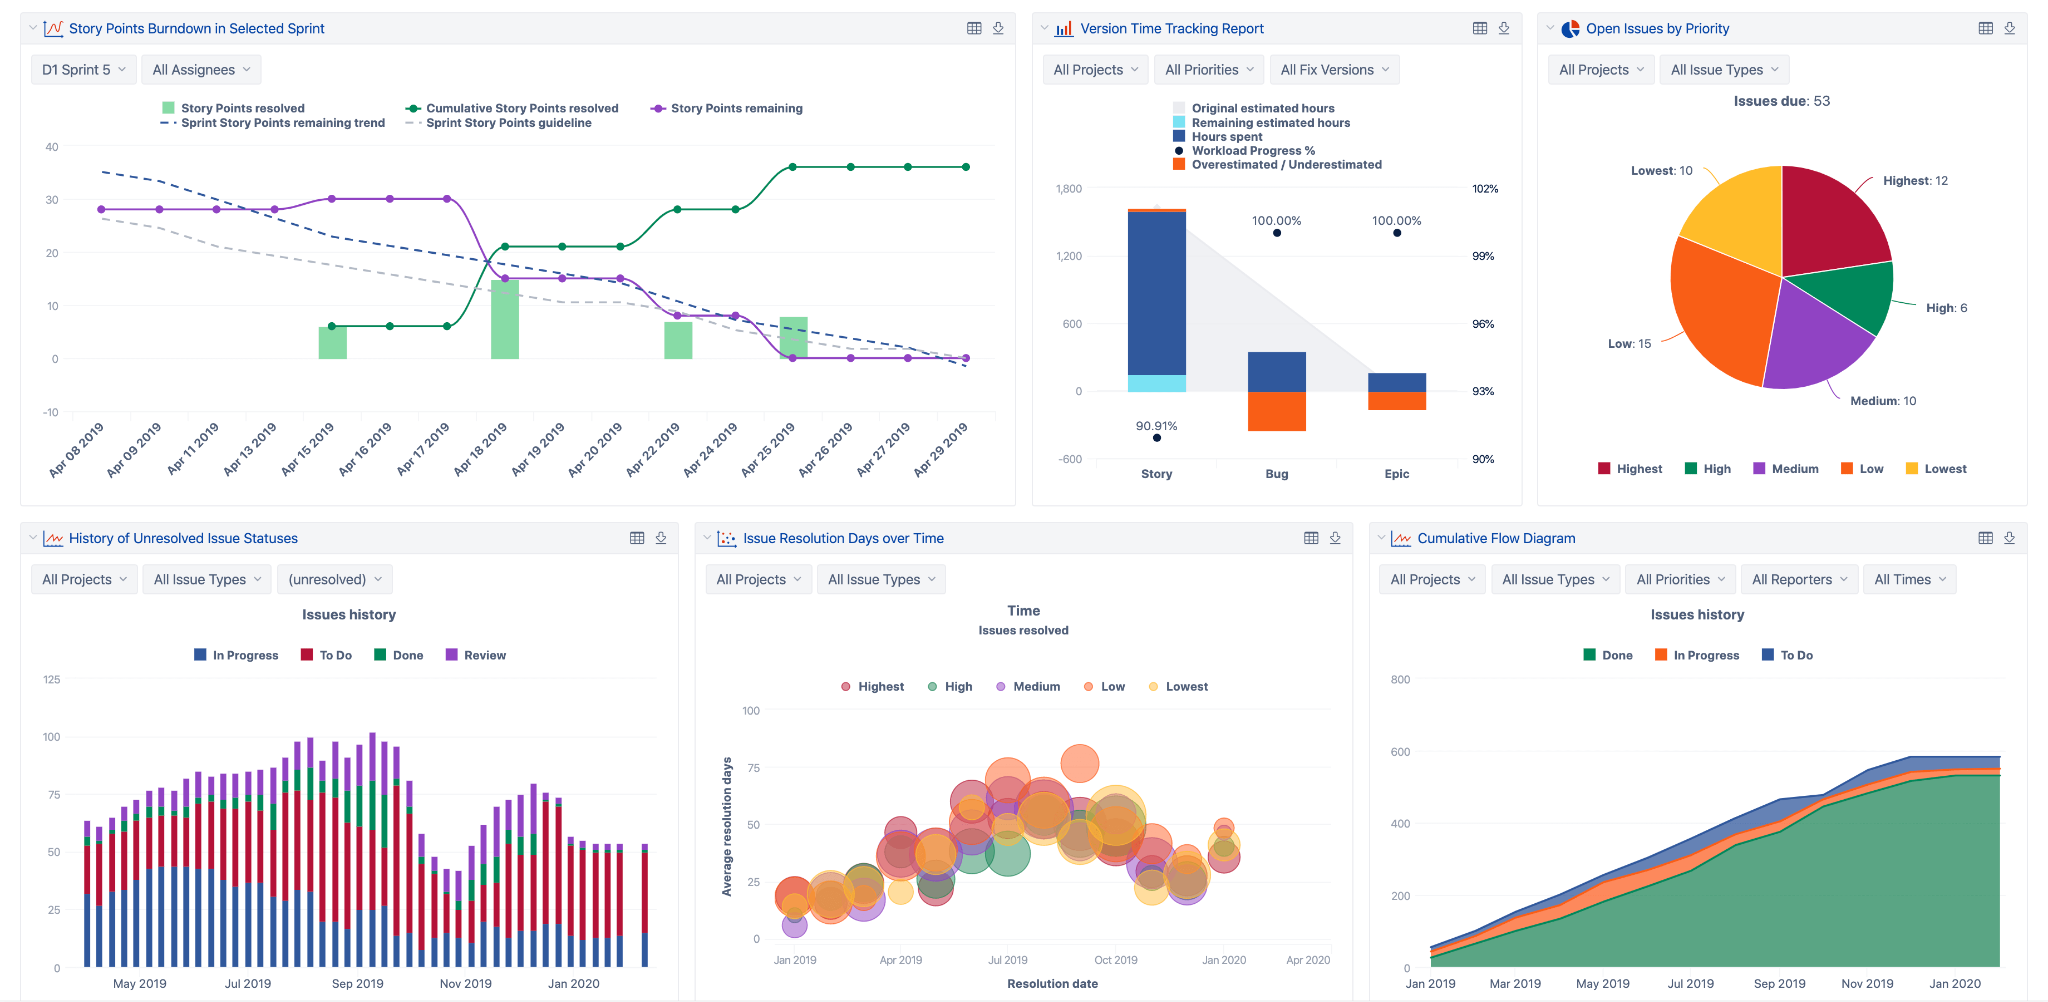
- EazyBI Reports and Charts for Jira: This is a flexible, comprehensive tool for reporting and visualizing data related to your IT and software project delivery. EazyBI is also available for Confluence.
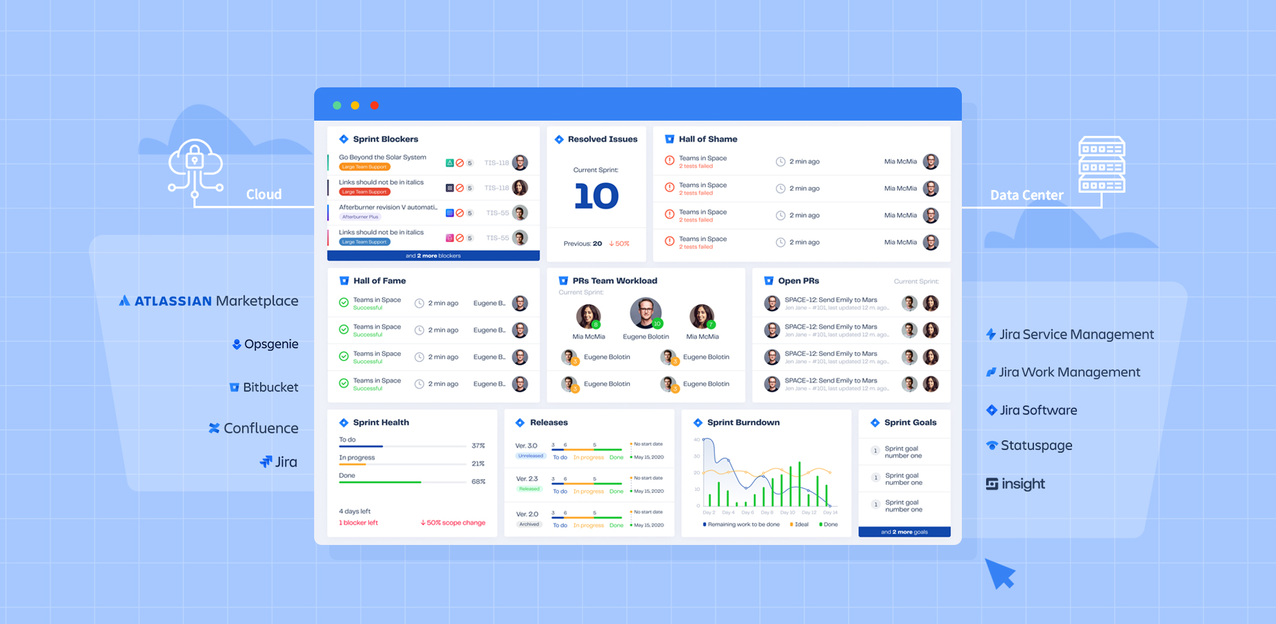
- Dashboard hub for Jira – You can use this application to create predefined dashboards for ITSM, DevOps teams, and Agile teams.
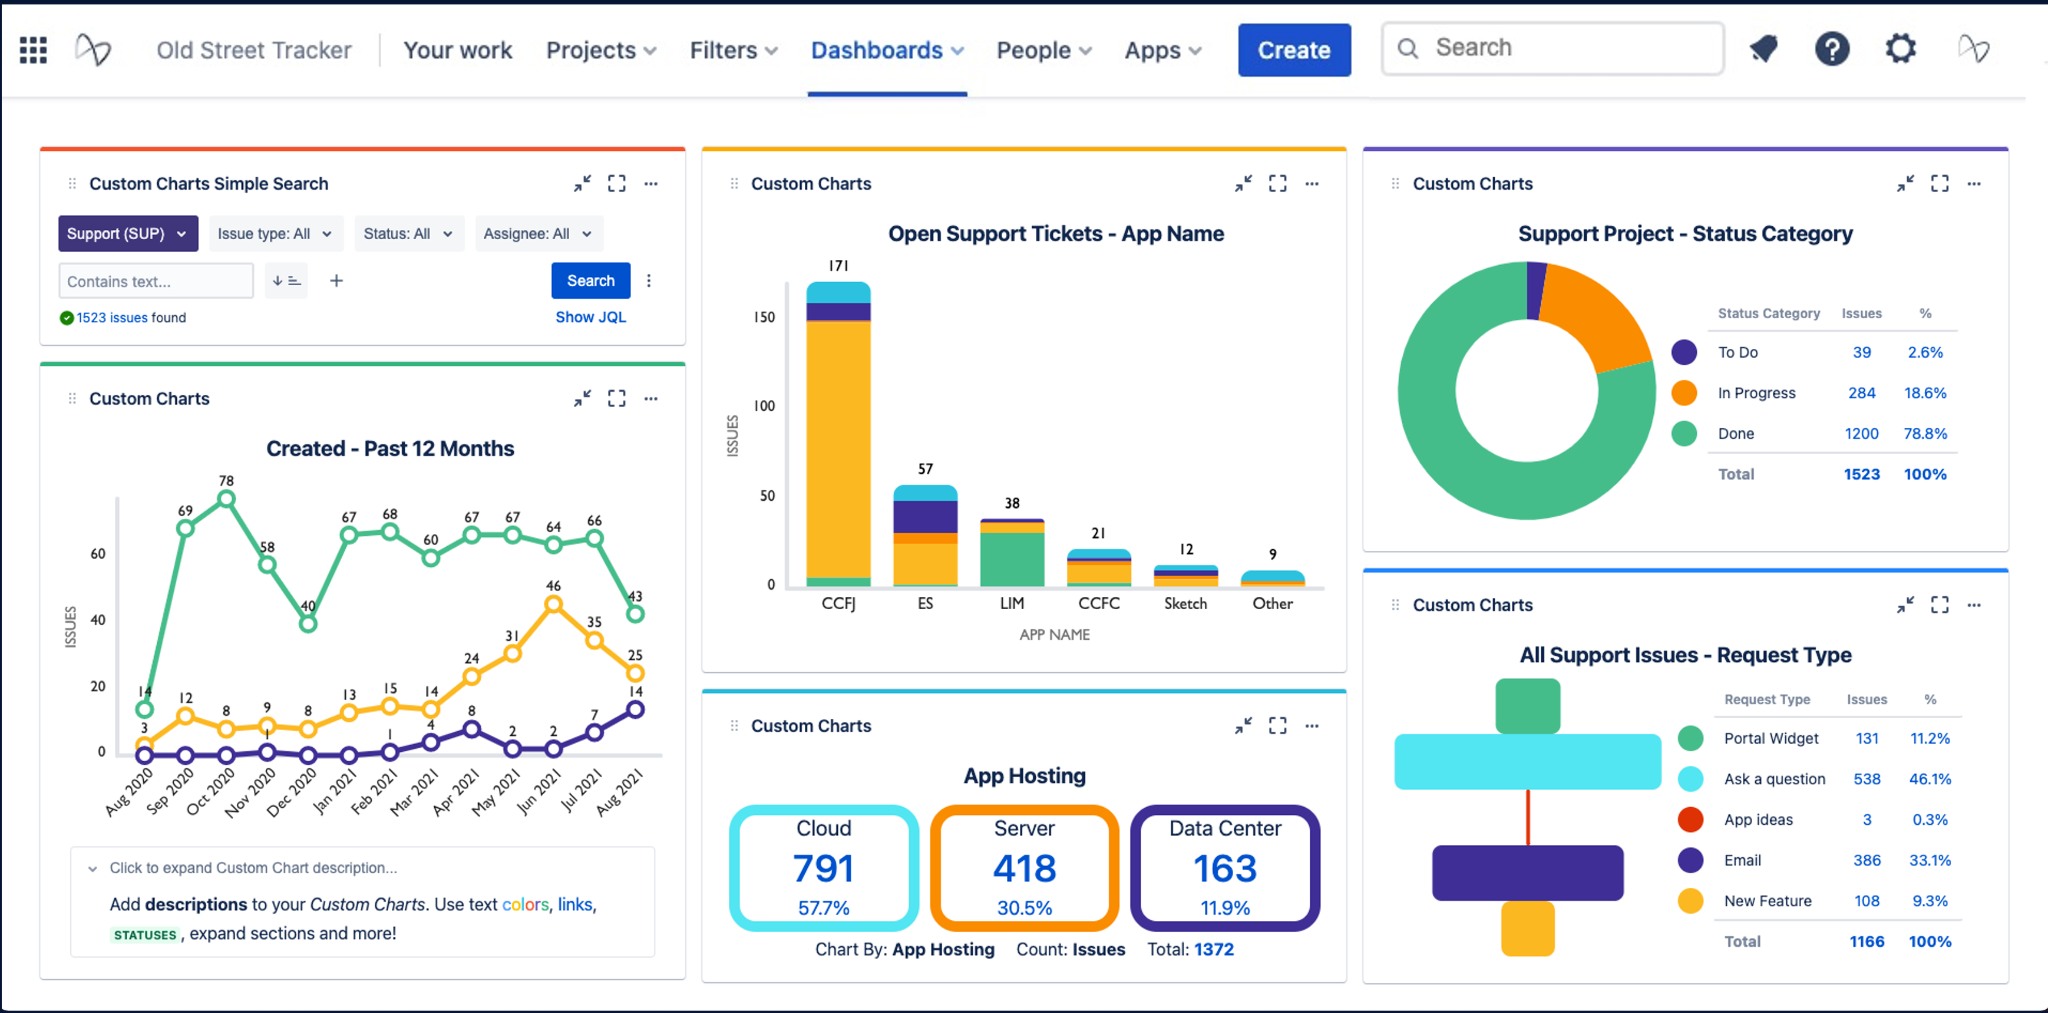
- Custom Charts for Jira: Custom Charts is a straightforward tool for creating customizable pie charts, bar charts, line charts, and more with a drag-and-drop interface in Jira.
To get more apps that can help you track KPIs and performance, explore the Atlassian Marketplace.