
Striking a balance between speed and quality in continuous delivery
This is a guest post written by Adam Wignall, Head of Quality Assurance & TM4J Cloud Product Manager at Adaptavist, a Marketplace Vendor and Solution Partner.
Over the past few years, we have accelerated into a fast-paced ‘everything now’ era. Endless tech-powered innovations are giving customers more choices than ever before. When developing new products and features, continuous delivery and rapid software release cycles are now the norms. Enterprises have to adapt, improve, and deliver solutions faster to stay competitive and meet changing customer needs.
How can product owners deliver at speed without increasing risk or compromising quality?
At Adaptavist we have experienced some of the challenges associated with moving to a continuous software delivery model. By selecting the right tools, we were able to simplify our processes, scale our delivery, and assure quality with every new release.
To bring this to life let’s take a look at how we develop new apps for Atlassian Cloud using a pipeline of continuous delivery. In this case, mitigating risk is particularly crucial as upgrades and feature releases are delivered ‘silently’ and are therefore invisible to the end-user. Our goals are to always ensure the best possible user experience with any new release and to reduce the possibility of the user experiencing a failed update or outage.
By using the right tools, let’s explore how product owners can strike the right balance between scaling delivery to meet demand with the need to ensure high-quality, low-risk releases.
End-to-end traceability for faster and better decision-making
In the following example, we use Jira to manage our backlog of development features and Bamboo to run automated tests as part of our continuous delivery pipeline. As a product owner, using multiple tools for testing can be painful and time-consuming. Using one solution, integrated inside Jira, dramatically improves testing efficiency and accuracy, ultimately leading to a higher-quality product release.
Some Jira Apps for Test Management can provide this ‘one-stop-shop’ for testing. By using the Rest API integrations for these tools, you can feed the results from your automated tests straight into Jira. The majority of Test Management apps provide traceability layers to help you visualize the overall test results.
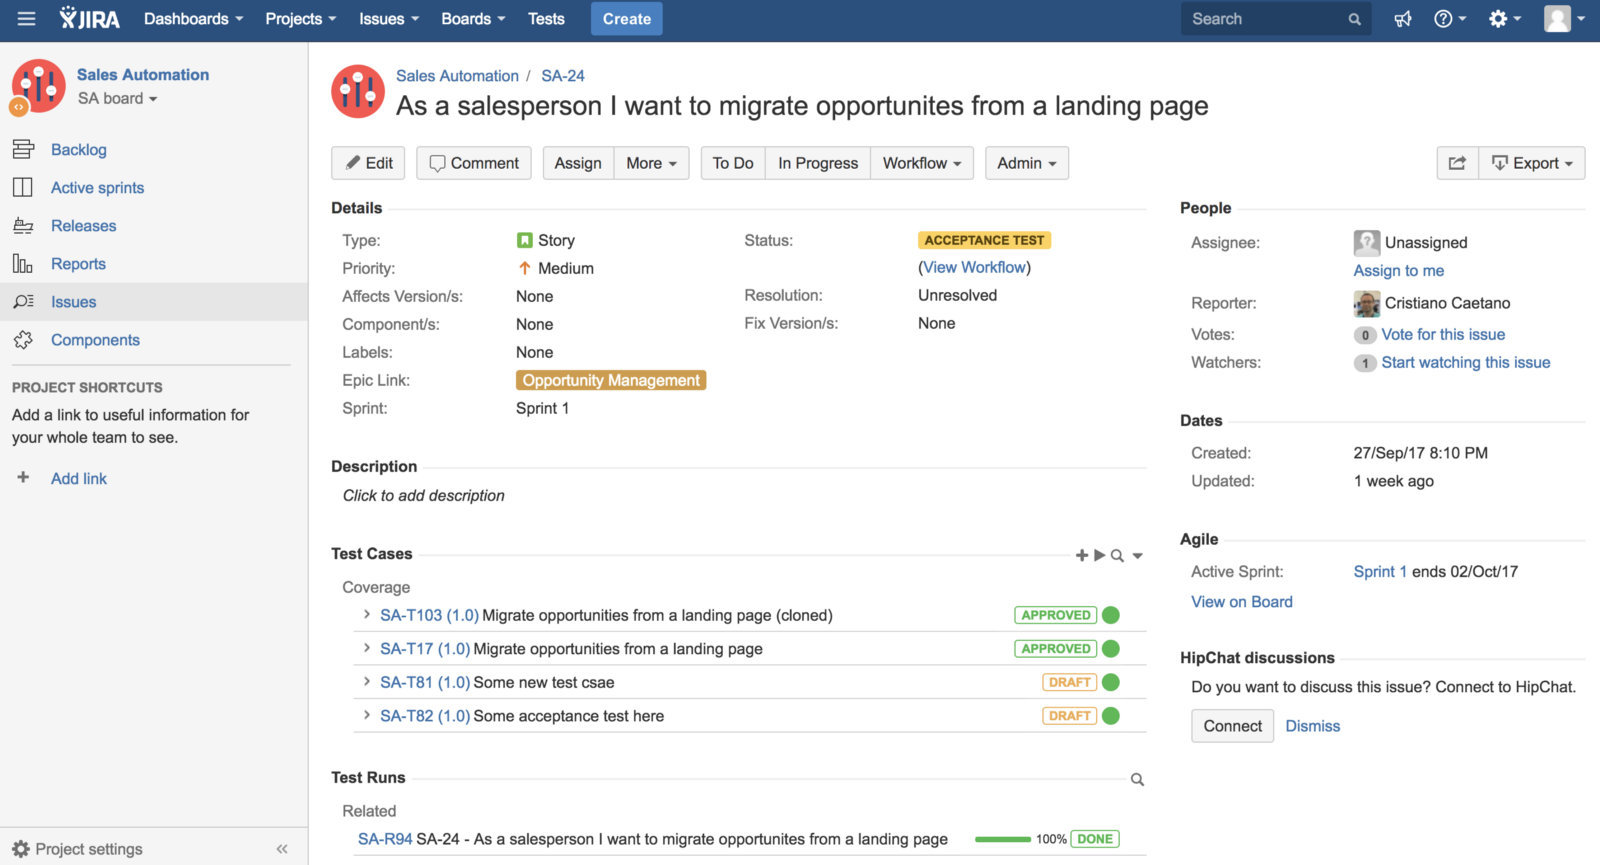
If all of the latest test results are green (passed) you can feel confident that all the acceptance criteria, defined before development commenced, have been met.
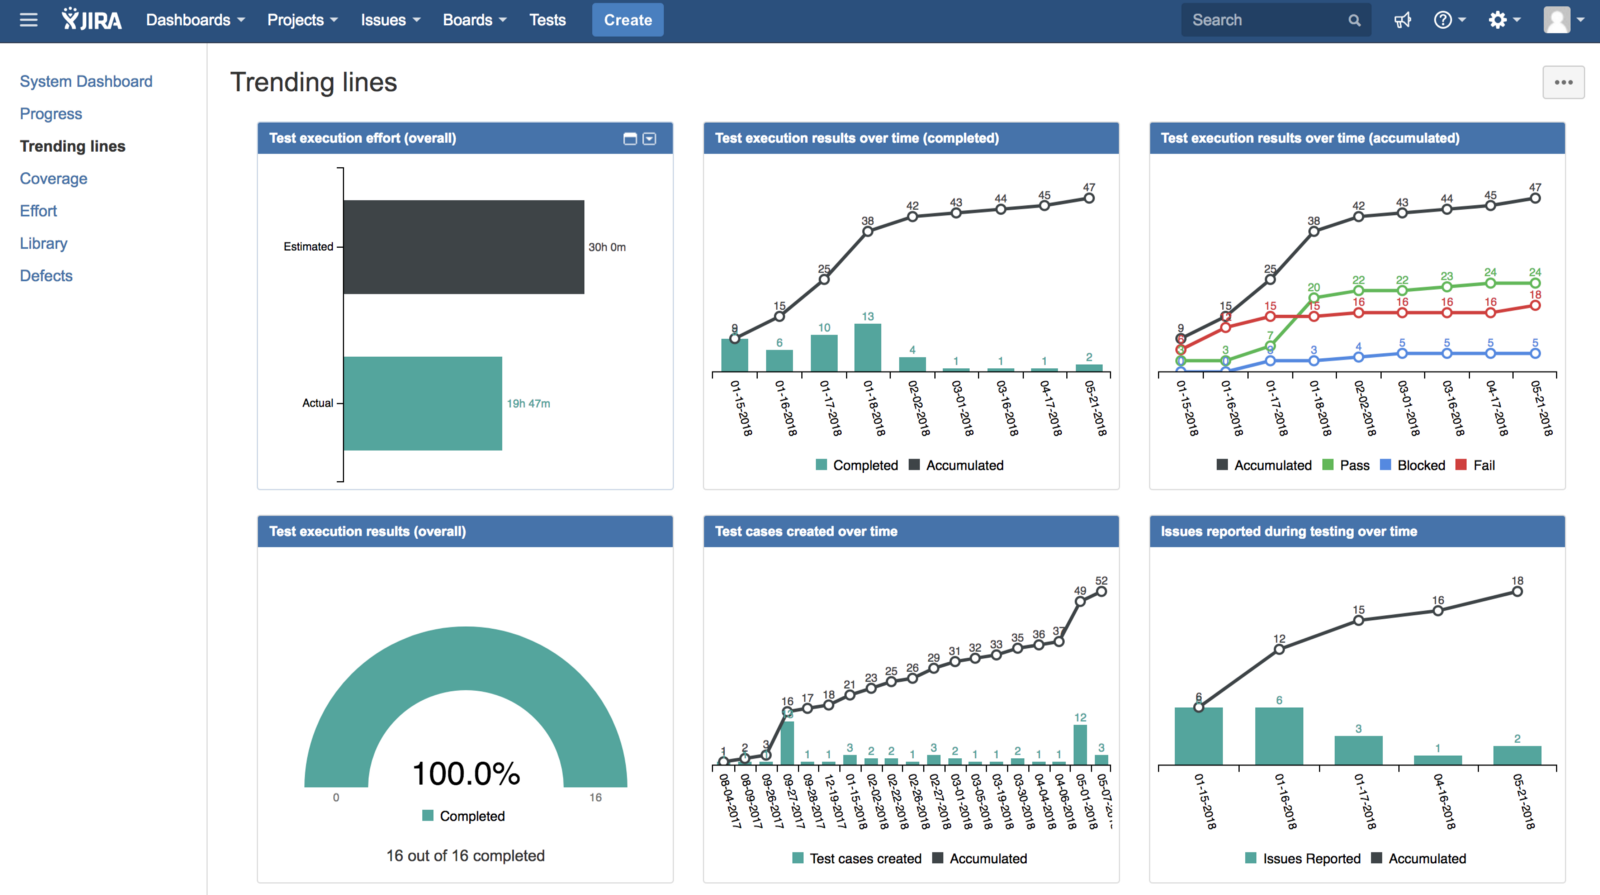
But what about the rest of the product? Is that still working as expected? To achieve a more holistic view of your testing you can either run specific reports from your test management app or use real-time dashboards to zoom into a specific view. Test traceability dashboards enable real-time visualization of your test cycle and help you make fast, informed decisions on whether to release or not.
Controlling rollouts using feature flags
To phase or control the continuous delivery of product features, it can help to deploy a tool to manage this process for you. There are several ‘feature management’ tools available on the market, but as we only have the first-hand experience of LaunchDarkly we will focus on this tool. In a nutshell, LaunchDarkly allows teams to control and phase the rollout of new features.
When Adaptavist deploys a new feature, we make it available to internal users first. Then through beta-testing, we gather feedback before rolling the feature out to a broader user group. Alternatively, we might adopt a phased approach so that just a percentage of the user base can access the feature.
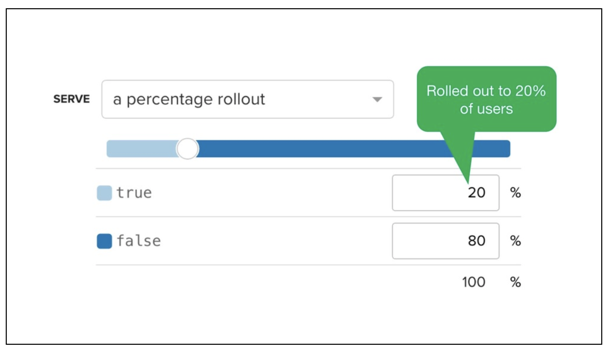
With either approach, if all the monitoring and support tickets indicate the roll-out has been successful, we’ll increase it gradually until 100 percent of the user base have the feature.
For a hot-fix, we can deploy to the instance that reported the issue and get the verification that the hotfix is successful before we launch to all instances. On a granular level, when an individual instance reports a bug, we will first verify the fix on the one instance before rolling out the fix to the rest of the user base.
Taking a more controlled and measured approach like this has a substantial impact on how we release to our cloud platform. When releases involve complex changes, usually involving existing customer data, a more phased and controlled approach ensures that new features can be introduced with minimal risks to customers.
When taking a more phased approach there is ultimately a trade-off between speed and rolling out a quality product. By using tools like LaunchDarkly, however, you can keep the momentum going, act on user feedback fast, and create a better product.
Leveraging powerful reporting and monitoring
Having robust application monitoring in place from the log files allows for real-time feedback on potential issues. As a product owner, having access to immediate and contextualized testing insights speeds up defect detection and resolution.
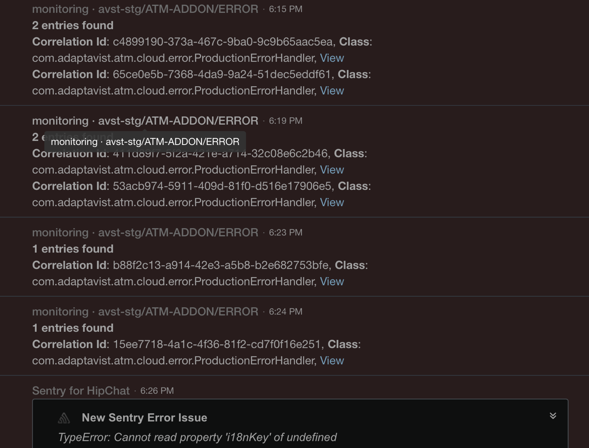
Feeding this real-time data into a project chat room enables the team to swarm on any flagged alerts to resolve issues quickly to create consistently higher-quality products.
A few of the reporting and monitoring tools we use to facilitate this are:
Sentry – this provides real-time reports of any errors on the client side JavaScript – it also offers the level of information required to diagnose and fix any errors reported. Alerts are immediately visible in chat rooms for the team to instantly assess.
Datadog – our main monitoring component, using agents and ingestion of metrics through integrations such as CloudWatch and Sentry, we create alarms and dashboards covering all the infrastructure that our cloud platform uses. If we see something like a CPU spike, this then gets flagged in a chat room for the team to be notified.
Kibana – we use Elasticsearch with Kibana for ingesting application logs, so any errors in the application logs are alerted into our chat rooms. We also ship counts based on log level, service, cluster, environment to the Datadogs dashboards.
Aggregating important information provided by these tools saves hours of investigative time on each potential issue, as there is no need to trawl through thousands of log files to pinpoint the issue. Accessing data fast means we are fixing issues before customers raise support tickets.
At Adaptavist we have the same monitoring in both our staging and production environments so we can highlight, assess, and fix issues before they hit production.
Deploying with confidence
As a product owner, leveraging the capabilities of these tools ensures that I and my team can keep up with changing customer needs. It helps increase our overall confidence in the delivery pipeline knowing that if any of our quality checks have inadvertently missed a potential issue, the likelihood of this impacting the customer is minimal.
Researching, defining, and deploying all the right tools to support your continual development pipeline is a significant investment of time and resources. Even though it may seem time-consuming at first, careful planning is critical to reduce risk, ensure quality, and save costly rework in the future.
The benefits of automating test processes (i.e. real-time insights, feature-flagging releases, and dynamic monitoring alerts) far outweigh any initial investment required.
Ultimately, increasing efficiency, lowering risk, reducing issues, and guaranteeing faster delivery times from code creation to production equals happier customers and even happier product owners!
Discover Test Management for Jira