

In a huge, multi-tenant product like Jira Cloud, a “small” change anywhere in the system can quietly make life harder for some of our biggest customers, long before our global metrics show a problem. Feature flags, gradual rollouts, and tenant-specific data and traffic shapes mean these regressions often only affect certain slices of Jira (e.g., one endpoint for admin users on three tenants), which makes them tricky to catch and even trickier to explain.
In this post, we’ll walk through how we built a per-tenant, per-endpoint detection system for Jira and wired it into Rovo Dev CLI so we can quickly find not just that something got slower, but exactly why. In the last few months alone, it’s already helped us detect and mitigate more than eight separate production regressions, preventing performance from getting worse while we continue to invest in making it better.
What is a regression, anyway?
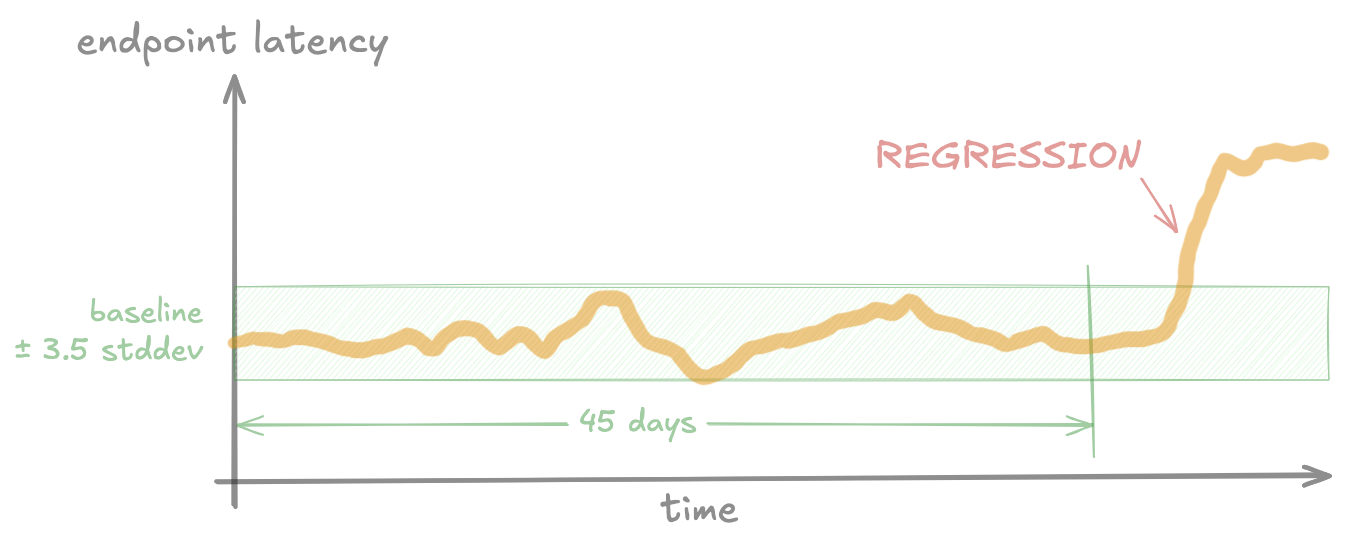
First, some definitions: A regression occurs when performance (e.g. endpoint latency) gets worse than its historical baseline. The baseline is the “normal” performance measured before the regression.
Jira performance varies A LOT per tenant.
Jira Cloud serves millions of tenants, and each tenant can look very different:
- Data shapes (issue counts, field configs, change history, etc).
- Traffic patterns (spiky vs smooth, global teams vs local).
- Add-ons and configuration.
- Networking and client hardware.
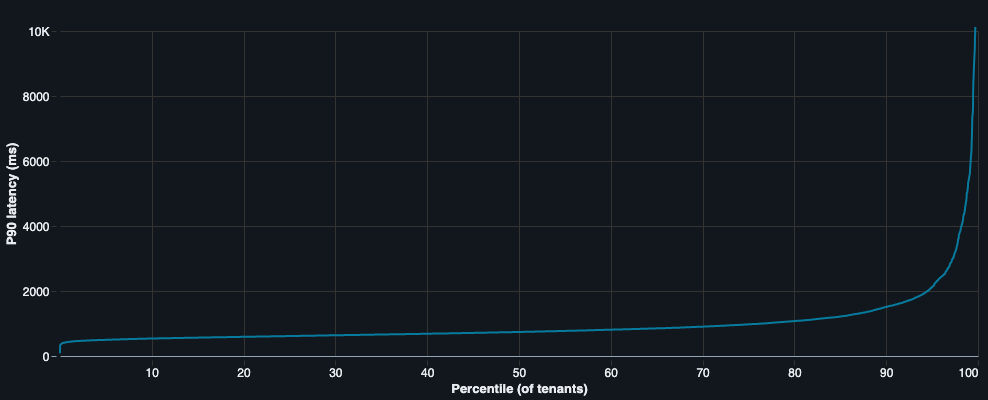
All of those differences mean that performance varies a lot per tenant and even per project. A change that’s harmless for 99.99% of tenants can be painful for the 0.01% sitting at the extreme end of the scale.
Many changes, all the time
At the same time, a lot is changing every day in Jira:
- Tens to hundreds of PRs are merged each day.
- Thousands of changes are made to feature flags each day.
- Infrastructure and dependencies constantly change.
- Customers increase or decrease usage, add automations, and install 3rd-party tools.
Each of these changes have a small risk of making performance worse, and some of them only hurt a small number of tenants: Maybe a handful of very large enterprise customers, or tenants with a specific combination of configuration and data. Whenever this happens, we still need to detect it and fix the regression, to avoid these problems accumulating over time.
Why “global” monitoring isn’t good enough
Most performance monitoring systems start from aggregated metrics:
- SLOs at environment, shard, or “XL customer cohort” level.
- Percentiles (like p90) computed across hundreds of tenants at once.
- Frontend metrics like “time to visually complete” (TTVC, a measure of page load performance) aggregated per environment/cohort.
Those are great for high-level health, but they can flatten out a lot of the problems we care about: Many regressions only affect a small handful of very large customers, so they’re often completely invisible in cohort-aggregated metrics.
Why fixed thresholds aren’t good enough
So why do we need to look for “regressions”, instead of just setting an SLO and detecting when it’s breached for each tenant? Given the amount of variation between tenants, here’s an illustration of what happens if we do this:

We hit two big problems:
- Tenants that regularly (or always) have performance worse than the threshold will constantly be alerting.
- Tenants that regress from “very good” (a long way below the threshold) to “good” (slightly below the threshold) will never get alerts.
We can solve either one of these by setting the threshold very high (above the worst tenant) or very low (above the fastest tenants) but we can’t solve both at once with a fixed threshold.
The bar we set
So the goal for our project was:
Detect regressions when an individual tenant or a small cluster of tenants gets slower on a specific backend endpoint, even when global metrics look fine.
To do that, we needed three things:
- Per-tenant, per-endpoint metrics at scale.
- A detection pipeline that compares each tenant to their own history.
- A way to quickly turn “something is slower” into “here’s a plausible root cause”.
From detection to mitigation: One regression, end-to-end
To make this concrete, we’ll walk through a real, production regression where our system:
- Detected a backend regression that wasn’t detected by aggregated metrics.
- Created alerts for the owning teams.
- Ran an automated root cause analysis (RCA) that correctly identified the responsible feature flag.
- Helped drive mitigation before customers raised complaints.
Around the end of October 2025, a Jira backend feature flag started rolling out across production. For some of them, it caused a significant latency increase on two backend operations used in issue view and boards. But for the rest of the tenants in production, this flag had little to no effect – so like many other regressions, it barely showed up on aggregated metrics.
Our system picked it up on 20 of our biggest customers, and sent off a JSM (Jira Service Management) alert to the internal teams that own these backend endpoints.
Automated root cause analysis (RCA) with Rovo Dev CLI
Having alerts is great, but there’s one big problem left to solve: Diagnosing and root causing performance regressions can be deceptively hard. It can take days to investigate the root cause(s) of a regression, and many investigations go unsolved due to lack of data or domain knowledge.
So we experimented with a way to solve this with AI. Once an alert is created, our system kicks off a root cause analysis agent built on Rovo Dev CLI. The agent:
- Follows a multi-step plan, which we tweak after each regression to incorporate new domain knowledge or investigation patterns. Importantly, this provides detailed context and specific patterns based on our existing manual investigation processes.
- Writes SQL queries against our high-cardinality production metrics stored in a data lake.
- Has read-only access to the source code that runs Jira, along with recent git history.
Before we dive into how it works, here’s the generated root-cause summary the agent generated for this regression:
Feature flag replace-metrics-check-ff was rolled out on 2025-10-30 at 23:42 UTC and introduced synchronous, uncached network calls to the Tenant Context Service (TCS) in the hot path of every database query. The code change (commit 07d429ba99) replaced a feature flag check with a call to EditionService.getProductEdition(), which makes a blocking TCS API call via TcsHttpClient.get() without any caching. This resulted in a 1016% increase in TCS client execution time (1.37h → 15.30h in profiler data), which directly correlates with the observed latency regression. The issue is further compounded by the fact that this call is made for every database connection and query, amplifying the impact across the entire request lifecycle.
Let’s have a look at the path the agent followed for this regression:
1. Gathering impact summary and timeline
The agent starts by looking at latency data for all tenants in the alert, to build up a timeline of when the impact started. This gets used later on for correlating to other signals.
2. Sampling profiler data
For Jira, we have an in-house sampling profiler which measures where time is spent in the backend (by class, method, tenant, endpoint, and more), and sends data to our data lake.
Like everything else in our data lake, the agent can query this data using SQL. This lets the agent compare profiles before and after the regression, and narrow down to specific methods that started consuming more time.
In this case, the profiler data revealed one particular method (TcsHttpClient.get()) that jumped up from 1.37h to 15.3h per day on the affected tenants, starting at the same hour as the regression.
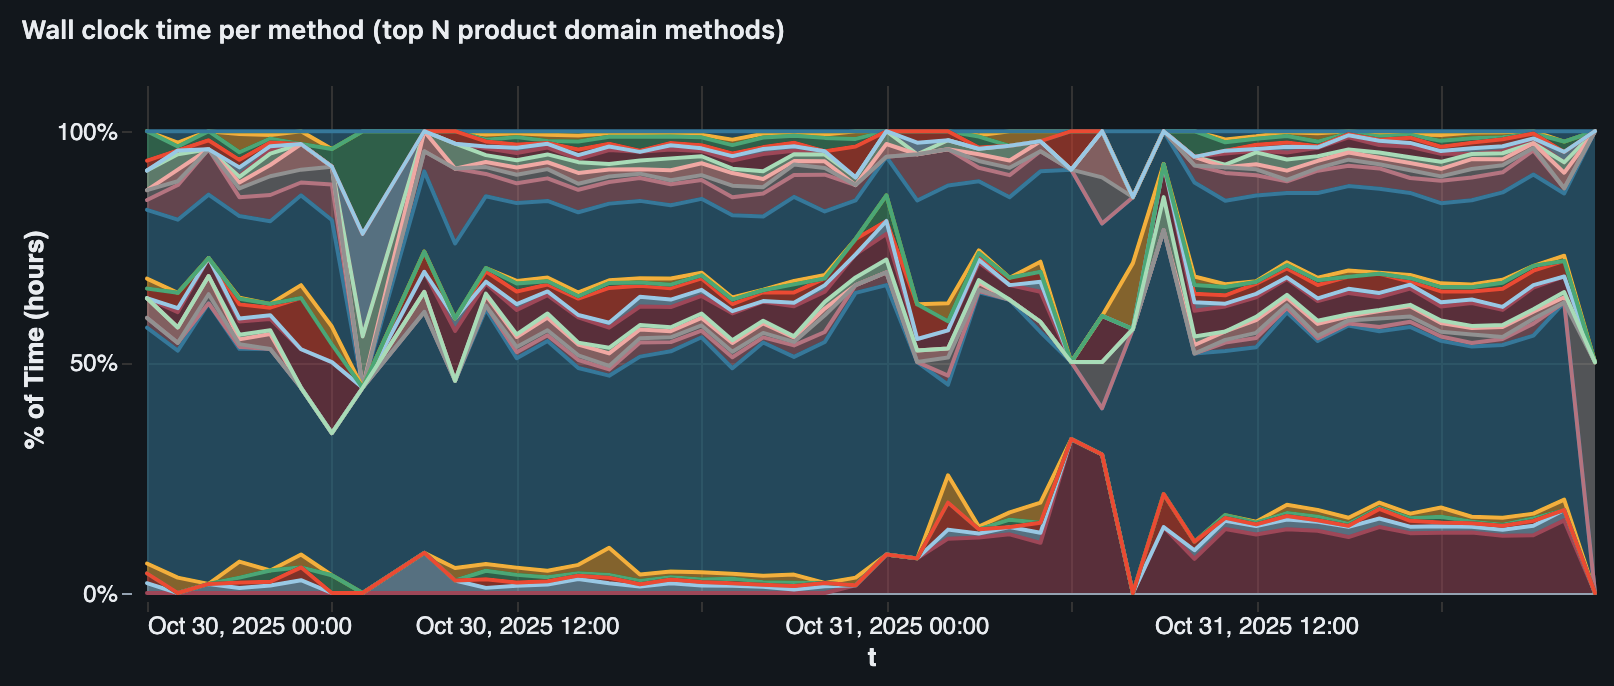
TcsHttpClient.get() (the red/maroon area at the bottom) correlating with the regression on one tenant.3. Feature flags
Next, the agent moved to feature flag evaluation data:
- We record per-request flag evaluations along with the performance metrics in our data lake.
- This lets us precisely find when flags changed on specific tenants (since flags use gradual, randomised rollouts across production) and backend endpoints.
- The agent writes SQL queries to find any flag changes that correlate strongly with the performance regression, cross-checking the timing with multiple affected tenants.
This surfaced three candidate flags. The standout was replace-metrics-check-ff, which had strong correlation (down to the hour) on multiple of the affected tenants.

4. Source code analysis
This step is where we really see the benefits of an agent over a traditional hard-coded flow. Given that we had already identified suspicious feature flags, the agent started by searching for usages of each feature flag to analyse the actual changes.
For replace-metrics-check-ff, the change was replacing
// pseudocode of the old path
boolean shouldEmitMetrics(String rds) {
    return queryStatsig(SLO_METRICS_ENABLED, Map.of("rds", rds));
}
with
// pseudocode of the new path
boolean shouldEmitMetrics(String tenantId) {
    Edition edition = editionService.getProductEdition(tenantId);
    return edition == ENTERPRISE;
}
The agent investigated the call tree of editionService.getProductEdition(tenantId) and found that it linked directly to the TcsHttpClient.get() method it saw in the profiler data, via a chain of 7 methods with no caching at any level.
5. Tying it all together
Now that the agent had fairly strong evidence of a root cause, all that was left was to write up a summary report and save it to Confluence. Our engineers reviewed this and switched the flag back off within hours, before any of the affected customers noticed the impact.
What we learnt
1. Detecting regressions is only half the battle
At the start of this project, we treated it mostly as a data engineering problem: How do we process such a large scale of data reliably and efficiently? This part was still difficult, but in reality it was far from the biggest challenge of this project: going from alert → mitigation.
To get value out of this system, it wasn’t enough to just generate alerts: we need to make sure they get sent to the right teams, get investigated (successfully), and get mitigated. This is as much a business coordination problem as an engineering problem.
The engineering part: This is mostly a problem of having the right data and tools to quickly root-cause a regression, and it’s the reason why automated RCA became so much more important than we initially thought. If it’s too difficult to investigate a regression, teams won’t do it and the regressions won’t be fixed. As well as the automated RCA, we built lots of more “manual” tools for doing RCA (e.g. Databricks dashboards for finding feature flag changes), many of which were evolved into automated RCA steps. This whole process was a continuous loop of finding regression → investigating → improving tools, and without being deeply involved in the investigation part, we likely wouldn’t have been able to build the right tools.
The business coordination part: Having one central team handling all regression alerts doesn’t scale long-term, so we needed a way to assign alerts to relevant Jira teams automatically. This is where we benefited from recent work to make sure all Jira endpoints and source files had ownership assigned to a specific team, which meant we always had a team to assign each alert to. We also needed to find the right balance between avoiding regressions and slowing down development too much: Sometimes it’s worth shipping an important bugfix now even if it introduces a small performance regression, and coming back later to improve the performance.
2. A good evaluation dataset is critical for building a complex agent
When we first started building the root cause analysis agent, we treated it as a short-term experiment and mostly tested it by using one-off manual runs and checking the output. Eventually, we realised this was massively holding us back: It was too hard to know if our changes were improving things, and too easy to accidentally over-fit for a single scenario we were developing for at a given time.
This led us to set up an evaluation framework to test the agent more consistently, which arguably became the single most important thing we did while building the agent.
To evaluate the agent realistically, we built scenarios around real production regressions rather than synthetic data. This lets us capture all the messy details that matter for a real investigation: noisy metrics, seasonality and traffic shifts, correlated signals, and overlapping code changes. Because our agent can run arbitrary SQL over metrics and inspect arbitrary code, we can’t cut corners here: the evaluation scenarios need to exercise the full path from alerts, to timelines, to code and deployments.
Each scenario records:
- Alert inputs from the alerting system: regression date(s), affected endpoints, and tenants.
- A commit hash from a few days after the regression, giving the agent a stable view of the codebase to investigate.
- Human‑validated ground truth: a concise description of the true root cause plus detailed evaluation notes. The agent never sees this; it’s only used for scoring.
Initially, we scored the generated RCA reports by searching for keywords (e.g. the ground-truth root cause feature flag key), but this quickly hit issues: It rewards the agent for just dumping every signal it found into the report, and doesn’t reward actual understanding and judgement about the true root cause. To fix this, we switched to using the LLM-as-a-judge pattern to score each run against the “real” root cause and evaluation notes we recorded for each scenario, which massively improved the quality of the evaluations. We feed the generated summary report to the judge and score it on two criteria:
- Recall: Does the summary correctly find the root cause and key signals of the regression?
- Precision: Does the summary avoid reporting incorrect or irrelevant root causes?
Here’s how we tie it all together in our evaluation harness:

Each scenario gets run in parallel, and optionally gets run multiple times to test consistency. Before starting, we check out the code repositories at the right commit. Then we run the agent, check its output with the judge, and compile all the results together into a report.
Looking forward
By combining per‑tenant statistical detection with an AI‑driven root cause analysis (RCA) agent, we’ve turned performance regression management from ad‑hoc firefighting into a repeatable, automated workflow that scales across Jira. The system now routinely surfaces regressions that global metrics miss, points teams to the most likely root cause, and helps them ship mitigations before customers feel the pain.
Next, we’ll push this system wider and deeper by expanding coverage to all Jira endpoints, pulling in richer data sources for RCA (from infra signals to product‑level context), and tightening the feedback loop between detection, investigation, and mitigation. As Jira teams continue to push for better performance across the board, we want this system to keep pace: spotting regressions early, explaining them clearly, and providing teams a direct path to fix them.


