
This is a guest post written by Kat Sandin, product marketing manager at Appfire, makers of the award-winning Bob Swift and Wittified brand Atlassian apps.
Reporting on key business data across different departments can be a difficult, time-consuming, and manual process. One department might use an external business intelligence (BI) tool or software platform (like a CRM or an email marketing tool), while other data may come from a spreadsheet or a database. This means someone, or many someones, must cobble together bits and pieces of information from several different sources on a quarterly, monthly, weekly, or even daily basis.
Instead of spending precious time on manual, disparate reporting processes, why not pull all this information together into one place — a place where your team is already working every day — Confluence! Confluence is a powerful tool for team collaboration and document management, but it can also serve as a central hub for robust and interactive business intelligence reporting.
Why is Confluence such a great tool for BI reporting, you ask? Here are four reasons:
- Your team is already using Confluence. (And if you’re not, you should!)
- You can pull in a variety of data sources and formats.
- You can apply specific access and permissions for users and groups.
- You can control the content, context, and organization.
Now, let’s dive into how you can turn Confluence into your BI reporting hub using a combination of native features and Marketplace apps.
Get your business intelligence data into Confluence
First, you’ll want to pull your external data into Confluence. You can use simple macros within apps like Excel for Confluence and Advanced Tables for Confluence to display data from attachments (such as CSV or Excel files) in a table with enhanced features like custom styling, sorting, totaling, and row highlighting. Both apps are also compatible with Confluence’s native Chart macro, which means you can turn tables into something more visual like a pie chart or line graph. And if you need to make any changes, simply upload a new version of the spreadsheet and the information in the table or chart will be automatically updated.
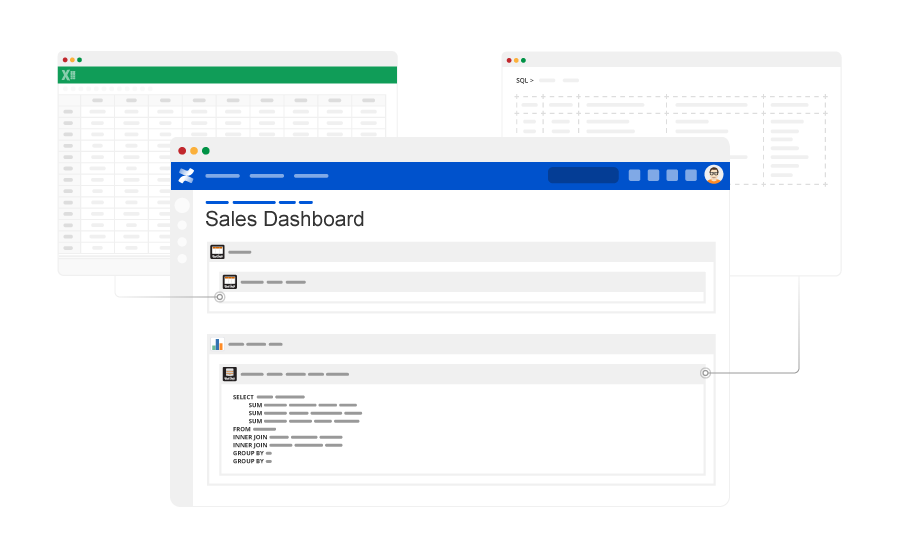
If you have data in an external database, you can display it right within your Confluence pages using the SQL macro available in SQL for Confluence. This app also works well with the native Chart macro, so you can turn all your SQL data into easy-to-read charts and graphs. If you need to combine different data points from multiple sources, you can merge that data together into a single table or chart for even more insightful reports. And since the data is dynamic, your Confluence page will reflect any changes that occur in your SQL database without anyone on your team having to lift a finger.
Build and optimize your reporting dashboards
Once you have the data you need in Confluence and you’ve determined the types of charts to use, it’s time to organize your dashboards. To create a true BI hub, you could show different tables, charts, and graphs along with contextual information, all on the same page. Or create a “dashboard of dashboards” that rolls up the highest level of data for your executive team by pulling data from different pages with more detailed reports for each department.
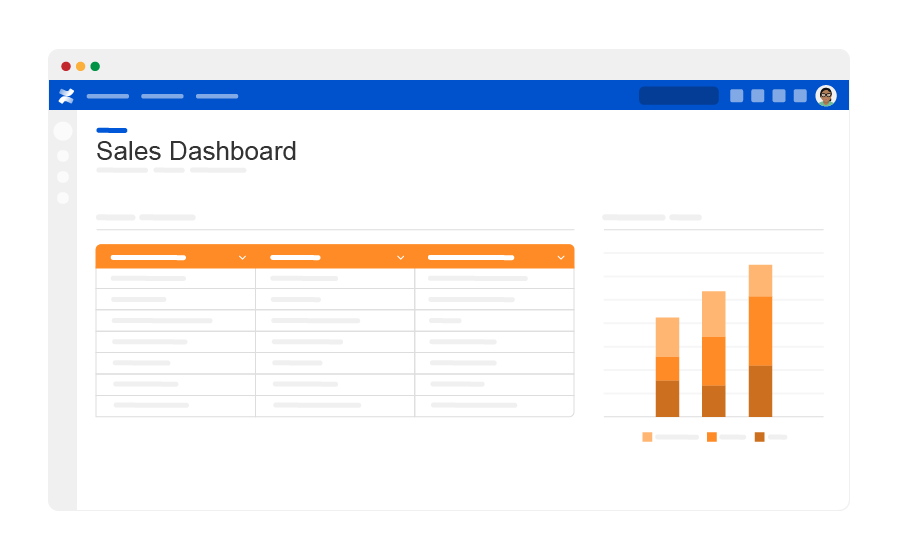
To organize your reports and display different visuals side by side, you can use Confluence page layouts along with native macros like Table of Contents, Info, Page Properties, Include, and Excerpt. This post has some really useful tips on formatting Confluence pages. There are also lots of Marketplace apps, like Composition Tabs & Page Layout, that can help you create clean, organized pages.
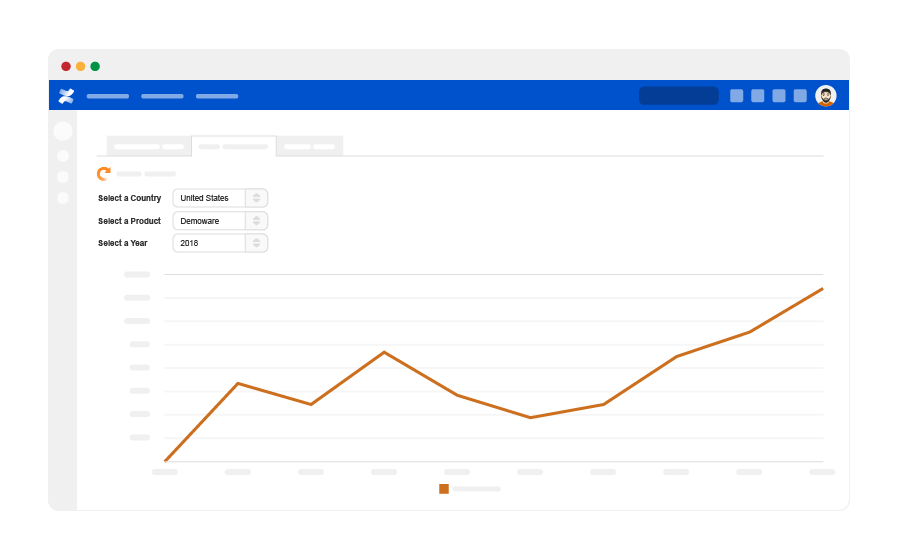
Many people within your organization will have different needs and uses for these reports, so you could consider providing a way for them to filter the data by any criteria they want, like time period, location, or product. Using Run Self-Service Reports for Confluence, you can build an in-page form so users can select a few simple parameters and see the specific information they need, instantly. By making your reports interactive and customizable, a single form can be used to generate many different personalized reports.
As you start to create more and more dashboards, these data-rich reports could have an impact on your page load times. We suggest limiting the number of large attachments and images added to your pages and consistently archiving pages, files, or attachments that are old or outdated. You can also use the Cache and Future macros that come with Cache for Confluence to prevent data-intensive content from slowing down your pages. By keeping data fresh, pages well organized, and load times fast, your team will be more likely to adopt and appreciate these helpful dashboards.
Secure your BI dashboards, and then share them
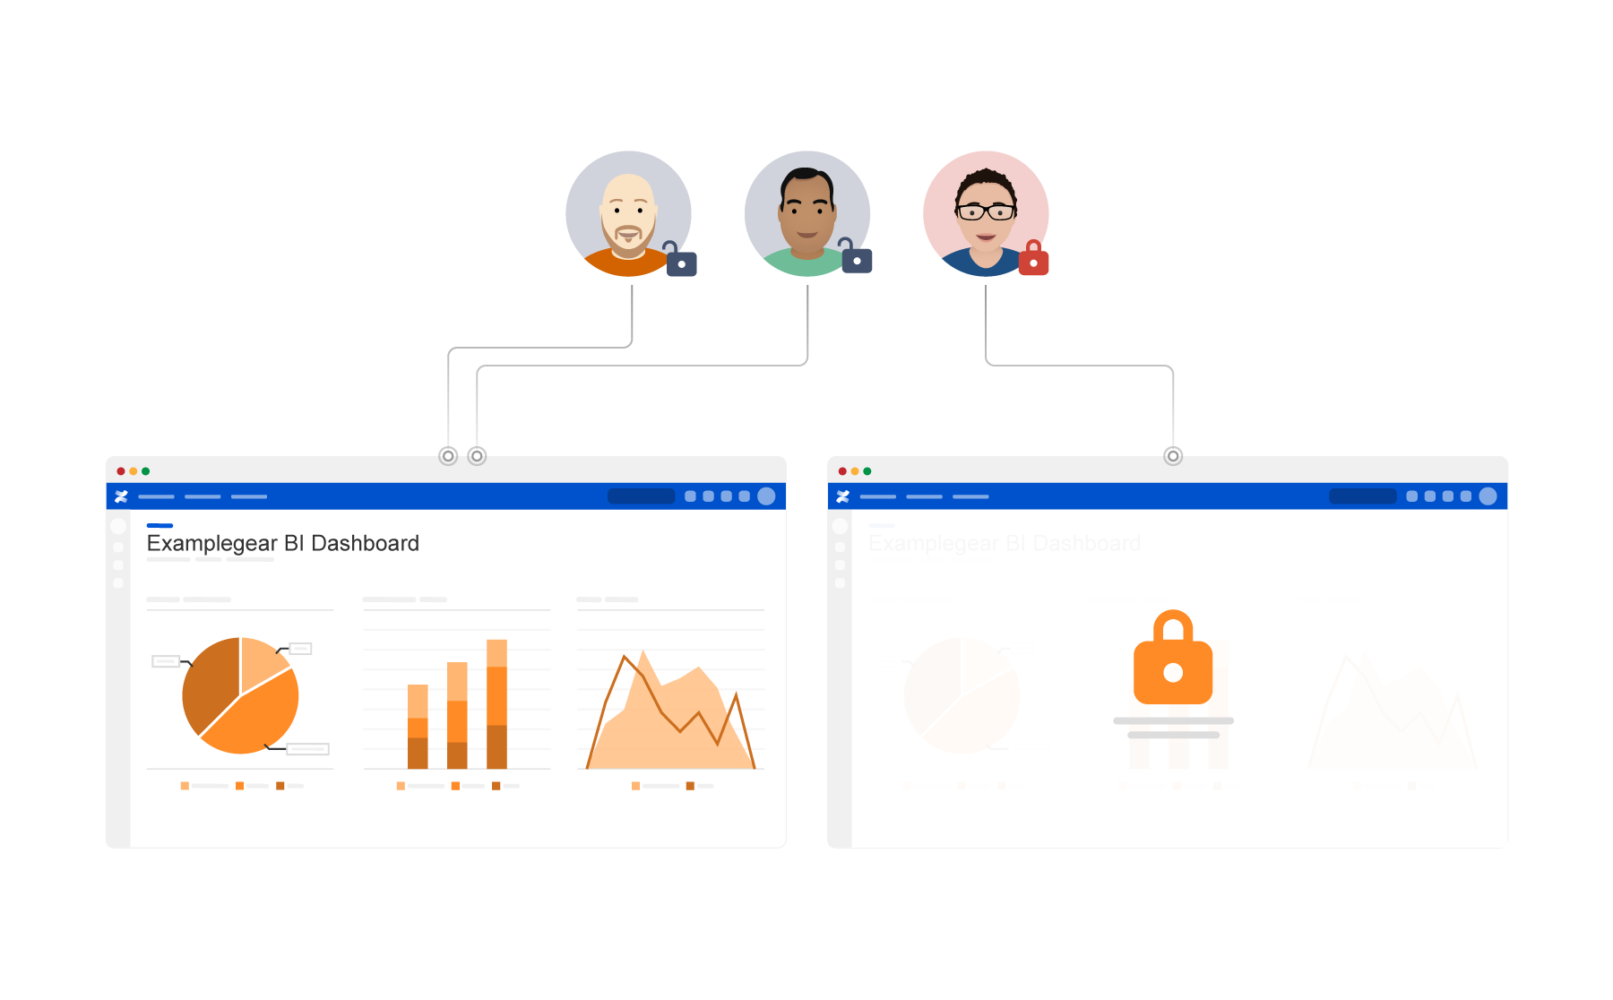
All your dashboards are built and ready to share, but first, let’s discuss how to keep your data secure. You can use Confluence’s built-in permission capabilities to make certain pages or spaces visible to only specific users or groups. If you want to get even more granular with permissions, especially for complex macros that connect to databases and pull in sensitive data, you can use Macro Security for Confluence to control which users can modify macro data and which users can simply view it. With the right safeguards in place, you’re free to share more data across your organization without creating security vulnerabilities.
Now you’re ready to share these amazing dashboards! To let everyone know when a new dashboard is available or one has changed, you can send a quick email or chat with a link to the page. For dashboards that are only meant for certain people or teams, consider using a communication tool like Announcer for Confluence to post a custom message right within Confluence that’s targeted to the specific users, groups, or spaces that are permitted to view that page.
If you’d like to get everyone on the same page (literally) when reporting on key business metrics, then it may be time to put these tips into action and turn Confluence into a business intelligence hub your team will use and love.
Discover Confluence apps from Appfire
Appfire’s award-winning family of Bob Swift and Wittified brand apps for Jira, Confluence, and Bitbucket provide solutions for automation, administration at scale, workflow customization, business intelligence, and more. Appfire is an Atlassian Platinum Top Vendor with more than 60 apps, 1 million downloads, and 10,000 customers in over 90 countries.


