
As part of our continuing series on Confluence for Business Intelligence, today we’re going to talk about the mechanics of getting data into a Confluence page. We need to know how to do this before we can start producing the fancy charts and dynamic reports that you typically associate with a Business Intelligence solution.
Static Tables
The most basic way to present data in a Confluence page is with a static table. Static tables may lack the dynamic nature of retrieving ‘realtime’ information from a database, but are an excellent means of sharing data with Confluence users without having to send documents via email.
A table can be inserted into a Confluence page using table markup. For example:

Users would then manually update the contents of the Confluence page to update the table. If that sounds like too much work for you, another option is to display the content of an attached Excel spreadsheet.
Attached Excel Spreadsheet
Many organisations have their key data stored inside of Excel spreadsheets. For example, you might have an Excel based report that you email around to your employees or executives periodically. With Confluence, you can upload that report and display its contents directly in a wiki page so you don’t have to email it around. For example, you might have an Orders.xls spreadsheet with key order date inside of it.
You can attach the spreadsheet to the Confluence page and use the {excel} macro to pull it onto a page:

If the data inside the Excel file changes, just re-upload the file with the same name, orders.xls, and the table will automatically update as well. You can even use the WebDAV plugin to browse to the Excel file as if it were on a shared network drive.
Data from An SQL database
Static tables an Excel sheets are great when you have the data in a spreadsheet or can cut and paste into a wiki page. But much of your organisational data is also probably stored inside dynamic databases like MySQL, PostgreSQL, Oracle or Microsoft SQL Server. For maximum reporting capability, use the {sql} macro to retrieve data from one of these JDBC-compatible databases. (Ask your Database Administrator if your database can be accessed via JDBC.)
A query can be sent to the database, which results in data being returned to Confluence: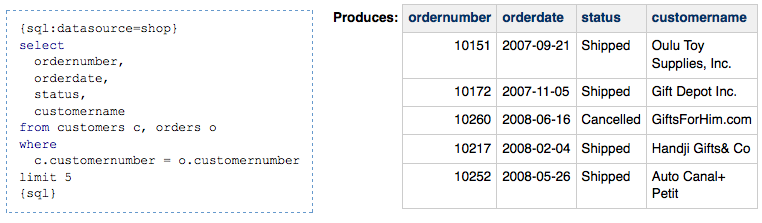
More Advanced Options
These are just the basics for retrieving and displaying tabular data inside of Confluence. All of the table macros – {csv}, {excel}, and {sql} – produce tables with some (slightly hidden) extra capabilities. For example, you can click on any column header to sort a table.
In the next post we’ll use what we’ve learned here to create graphical charts and formatted reports.