
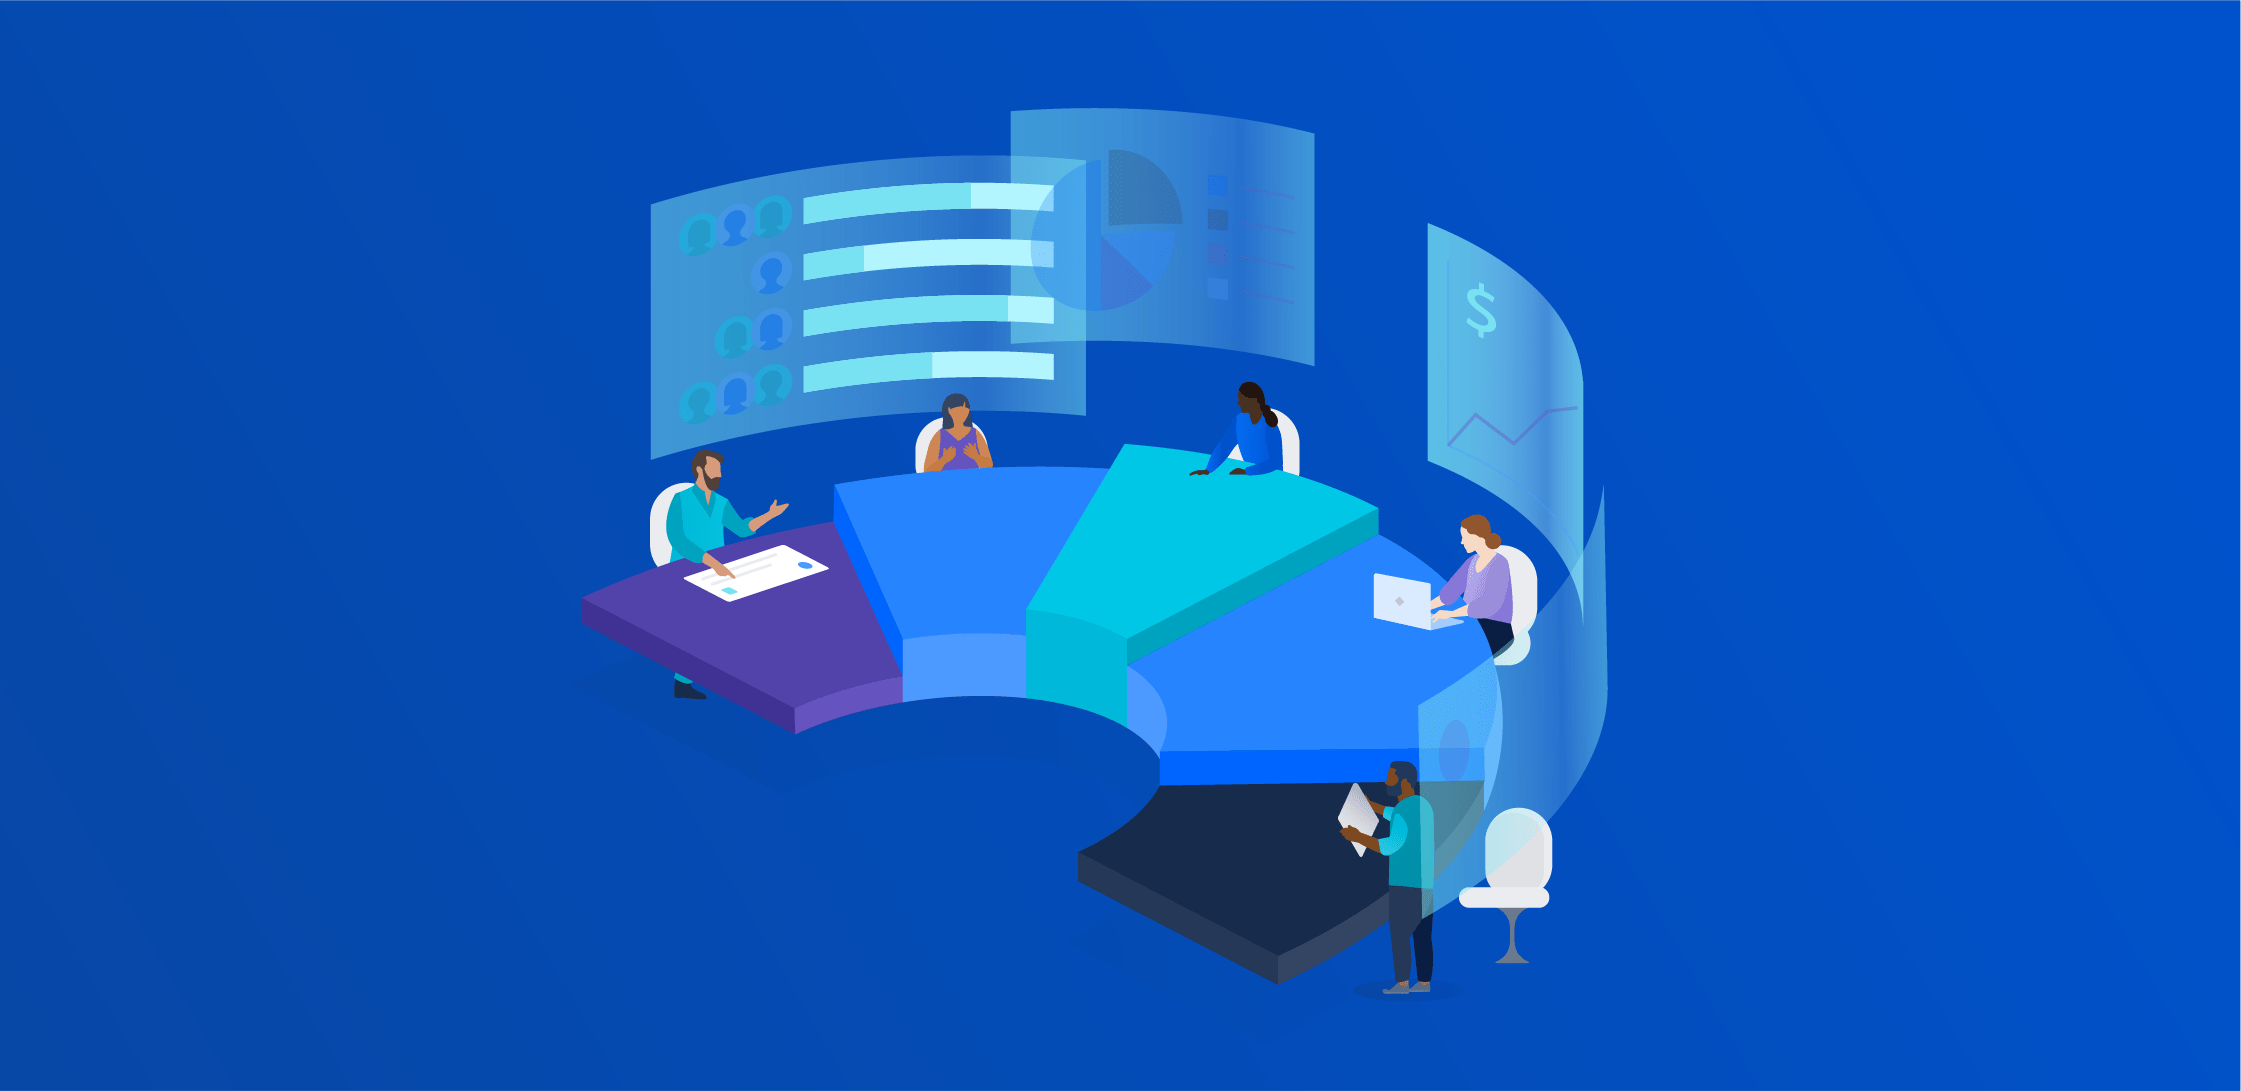
Companies spend a lot of time and money collecting data, but may not have the right tools in place to analyze the data. Jira Align’s Enterprise Insights brings program and portfolio data together, allowing companies to visualize trends and patterns in real-time in order to make better business decisions, including staffing decisions.
Before Derek Huether joined Atlassian, he worked for a large financial institution – and they had a problem: They couldn’t seem to hire talent fast enough to meet their development goals.
At least, that’s what they thought was going on.
Until Derek helped them realize that the real issue wasn’t talent acquisition. It was a shortage of information. They had the capacity they needed, but they didn’t understand where it was being spent. The lack of knowledge flow made it seem like they couldn’t keep up. But in reality, there was waste built into their systems, like duplicated work and bottlenecks, and complicated processes keeping them from delivering value to their customers. And because they didn’t have the right data and reporting set up, their actual problems were hidden.
This is the story Derek led with in his recent webinar on Atlassian’s Enterprise Insights. And it’s the story that taught him not to take problems at face value and, instead, dig into the data to ask where the problems truly stem from. If you think this might be what’s going on in your organization, you’re in luck. Here’s a breakdown of what Derek had to share.
The real problem: knowledge flow
In Derek’s story, what leadership saw as a capacity problem turned out to be a knowledge problem. And it happens more than you might think.
The proliferation of tools across different teams has made knowledge flow more difficult. There’s a lot of work getting done across the organization, but often in disparate places – spreadsheets and docs and presentations and systems that don’t sync.
So, leadership is in the dark and has to rely on short reports from managers, status check-ins, or a single data source that doesn’t have all the information or isn’t set up to showcase it in a way that’s useful.
The solution: access to information through data
With all that in mind, it’s clear that the foundation to solving this problem is two-fold:
First, you have to have the data. This means collecting data, syncing multiple systems, and investing in resources that allow you to store and parse that data as needed.
Second, you need a way to view the data so that it can be useful to leadership as they make real-time decisions about budget, capacity, bottlenecks, and project viability. You need reports, pie charts, side-by-side comparisons, and a visual hierarchy.
Visual hierarchies
In Jira Align, we call this the Objectives Hub, but the bottom line for any tool is that you need a visual representation of the hierarchy between related objectives and their overarching goals.
Are your objectives on track? At risk? When will each one be worked on? Who is in charge of getting it done? Their status should be visible and easily digestible for leadership (without clicking through 50 pages of reports and 10 different systems).
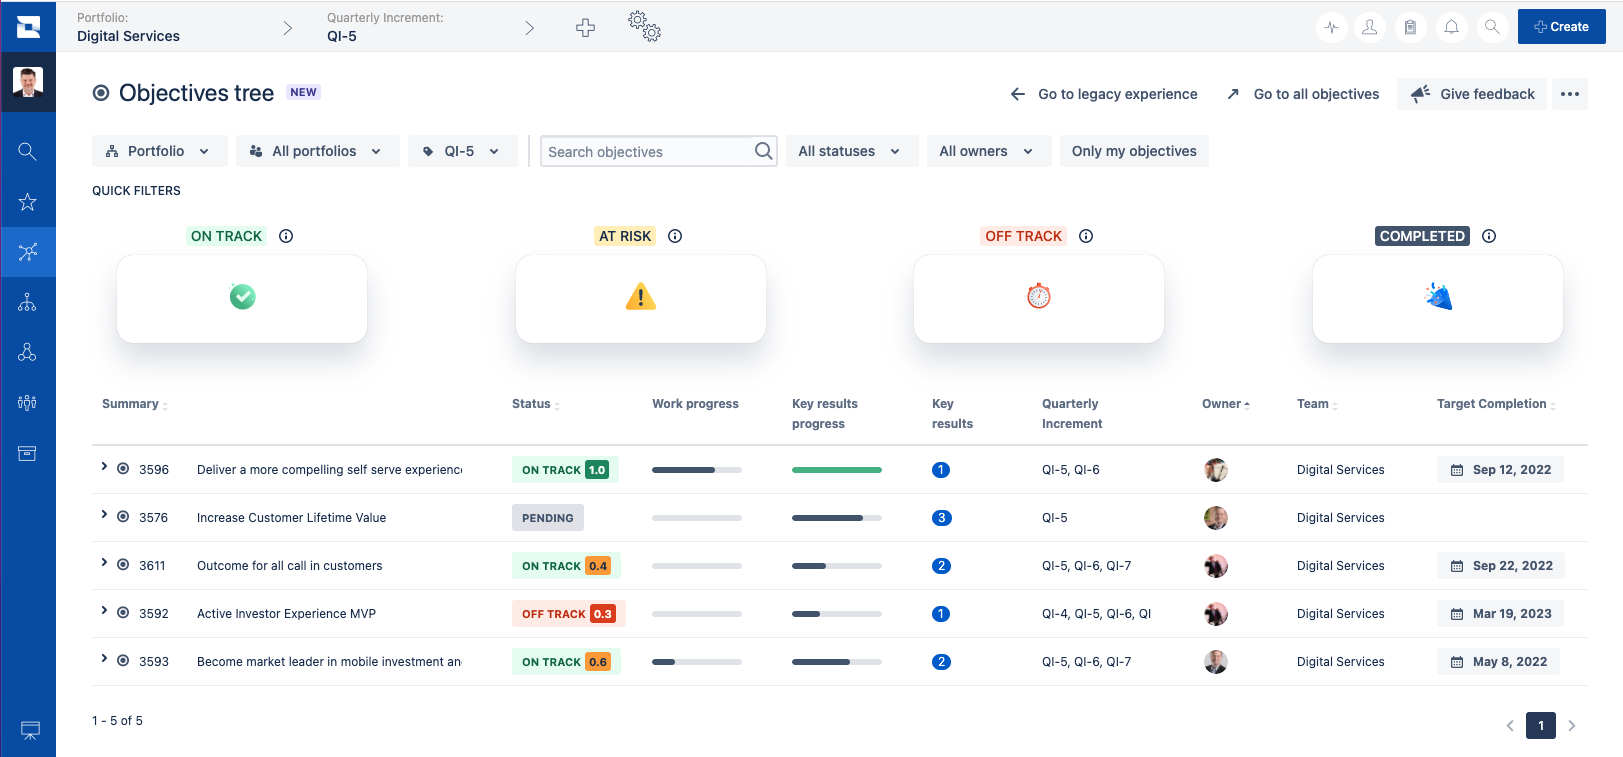
The key here is more than just tracking work progress. It’s tracking work progress alongside key results progress. Because it isn’t enough to simply get the thing done. The important question is whether the thing we get done is moving the needle on actual business goals.
Investment vs. spend
Going into each development cycle, we all have our financial plan. But if the only thing you do is toss a plan at teams and hope for the best, going off the rails is pretty much guaranteed. Because work is fluid. Roadblocks come up. Estimates shift.
What leadership needs is a clear view of funding allocations, estimated spending, and accepted spending – all in one report and in real time.
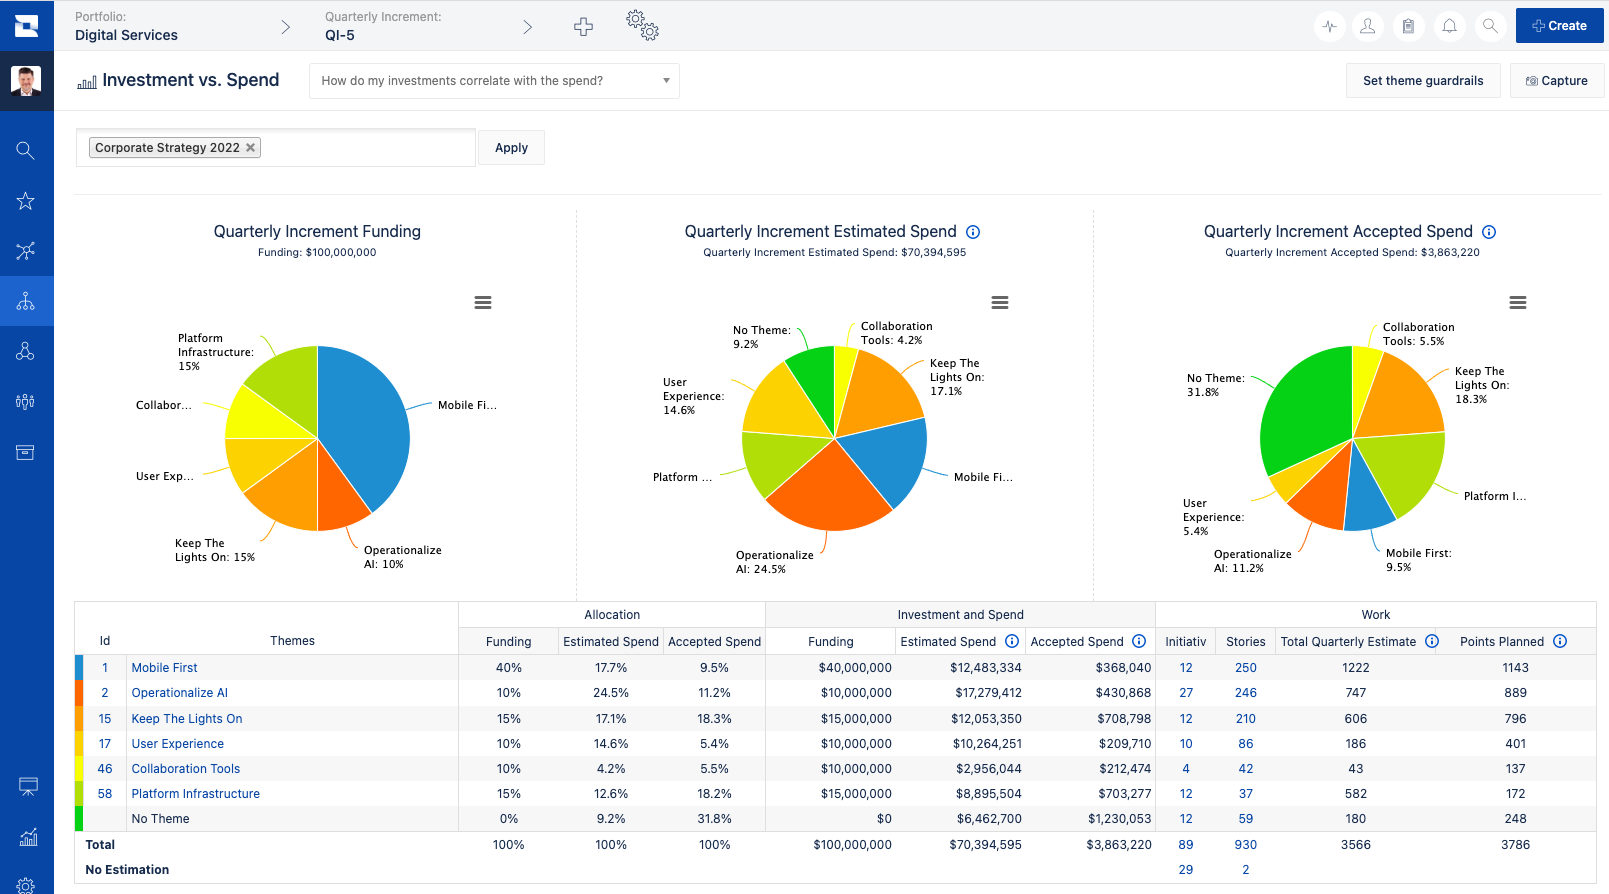
This real-time transparency allows leadership to see the facts – not just someone’s interpretation of them. If you see that your teams are estimating double the capacity to keep the lights on relative to what you’ve budgeted, you can intervene before things get dire.
Customizable data views
We’ve said it before, and we’ll say it again: every business is different. Which means that every business’s reporting needs are also different.
Are there reports we all need? Sure! Are there particular things most (if not all) businesses should look at regularly? Absolutely.
But for each business, there are also data points you need that other businesses simply might not. That’s why having access to all your data is important. Not just the 100+ reports in Jira Align. But the data lake where you can mine whatever niche information your specific use case requires.
This is what Enterprise Insights is: a data mart that you can pull into whatever tool you want in order to view whatever knowledge you want. You can sync with other reporting platforms. You can embed your external reports back into Jira Align. You can pull reports into Confluence. Wherever your leadership and teams can best access and use the data to make decisions: there the data will be.
Ready to dig deeper?
Check out Derek’s webinar for a deeper dive into how Enterprise Insights surfaces the information above and how your business can take advantage of the ever-deepening pool of data to avoid bottlenecks, optimize processes, flag incorrect estimates early, and otherwise, avoid wasting time and money.
