
IT service management (ITSM) is an umbrella term describing the processes used to create, deliver, and support IT services to customers. As such, it can encompass anything from basic tasks such as replacing a broken keyboard to implementing highly complex business software applications. But across these various activities, IT is seen as a service that is delivered to customers within an organization.
A key focus in ITSM is processes: creating and enforcing a set of rules for how an IT service desk operates, and how it interacts with customers, in order to increase the efficiency, pace, and quality of responding to support tickets. Processes can be set as guidelines for staff members, but are more easily enforced and monitored when they can be modeled within the software used to manage IT service desks.
Software tools such as Jira and Jira Service Management are key to implementing an effective ITSM strategy. Atlassian’s Jira Service Management is ITIL compliant and, thanks to Marketplace apps, organizations can customize Jira Service Management to match their chosen processes. Jira dashboards are your Service Management command and control center, and the main benefit of Jira dashboards in ITSM is the ability to consolidate and surface the health status of all your service projects quickly and effectively, to prevent problems before they occur.
In this blog, we’re laying out four ITSM best practices and how to implement them in Jira Cloud dashboards using built-in gadgets, JQL functions, and the Enhanced Search plugin.
Stay on top of incoming requests using the Created vs Resolved gadget
A service desk may be handling several hundred requests during a working week, all with different requirements and subject to different SLAs – it’s good practice to ensure tickets don’t get lost and address new ones as quickly as possible. Many studies have shown that time to response in digital apps is critical, with 69 percent of users likely to give up if it takes more than 15 minutes to resolve a service disruption.
The Created vs Resolved gadget gives you a visual indicator of how your team is doing when it comes to answering new tickets, and allows you to immediately see when a backlog is forming.
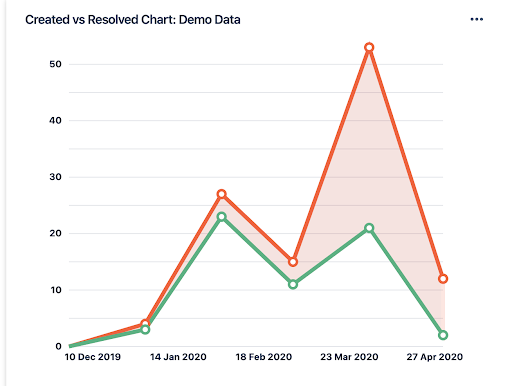
We want the green line, which represents resolved tickets, to closely track the red one, which represents tickets created. In the example above, the team was doing quite well, but an influx of tickets in March 2020 has apparently left many issues unresolved. This could be a sign that intervention is needed to reduce the number of tickets or resolve them more strategically.
Find tickets that have breached SLAs (or are about to) with filter results
An integral part of effective service desk management is setting and meeting reasonable SLAs. While most organizations do not achieve 100 percent ticket resolution within SLA periods, breaches should be avoided whenever possible.
One way to do this is to always surface issues that are about to go overdue in order to address blockers and keep relevant stakeholders informed. We can do this using Jira filters and the filter results gadget.
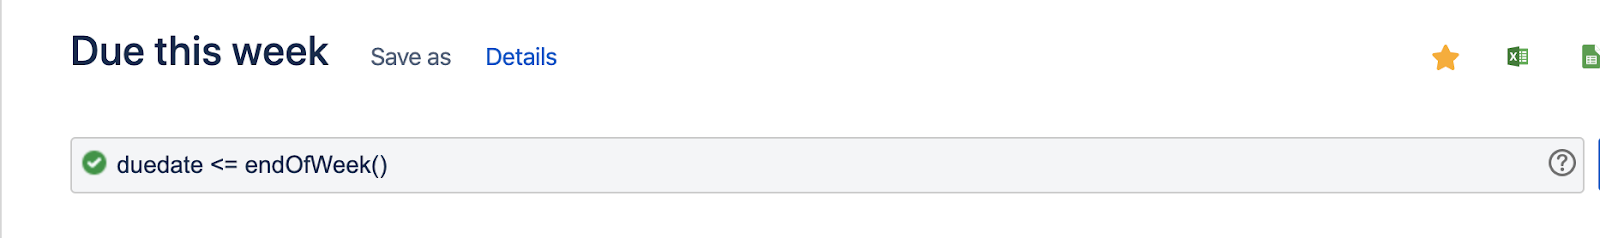
To use this gadget, we must first define a filter. In this case, we went for a very simple query to return issues that are due before the end of the current week:
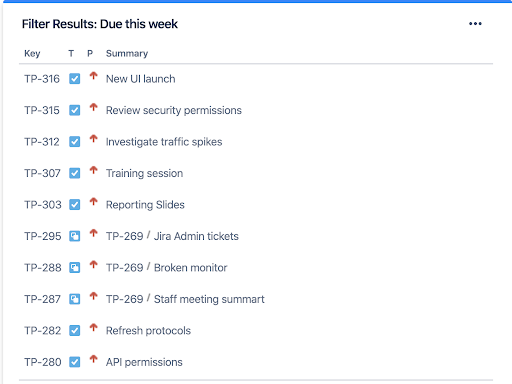
Once we’ve created our filter, we can see a visual representation of our query results in our dashboard, along with other relevant information, such as the priority of the issue:
Allocate resources with two-dimensional filter statistics
In many organizations, IT teams are responsible for mission-critical parts of the business, and we want to ensure that technical resources are allocated such that the most important issues are being resolved quickly.
The two-dimensional filter statistics gadget gives a bird’s-eye view of multiple projects, allowing users to make more informed decisions faster by identifying which project has the most unresolved high-priority issues.
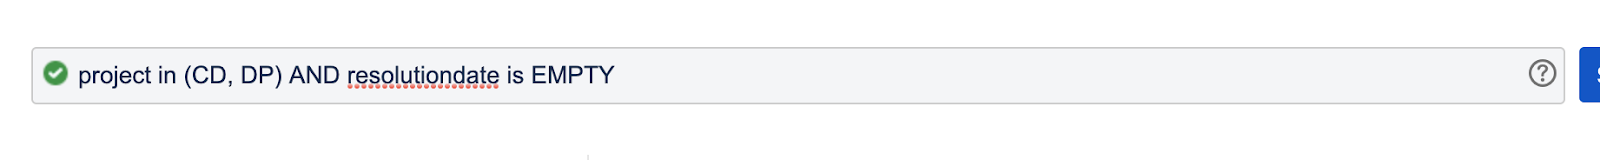
Start by creating a filter to capture all the relevant projects and issues you want to compare. In this case, we’ll look at the customer dashboards and internal support tickets projects, and the unresolved issues within these projects.
Once we’ve defined our filter, we can use the two-dimensional filter statistics gadget to see the breakdown of issues by priority across these two projects:
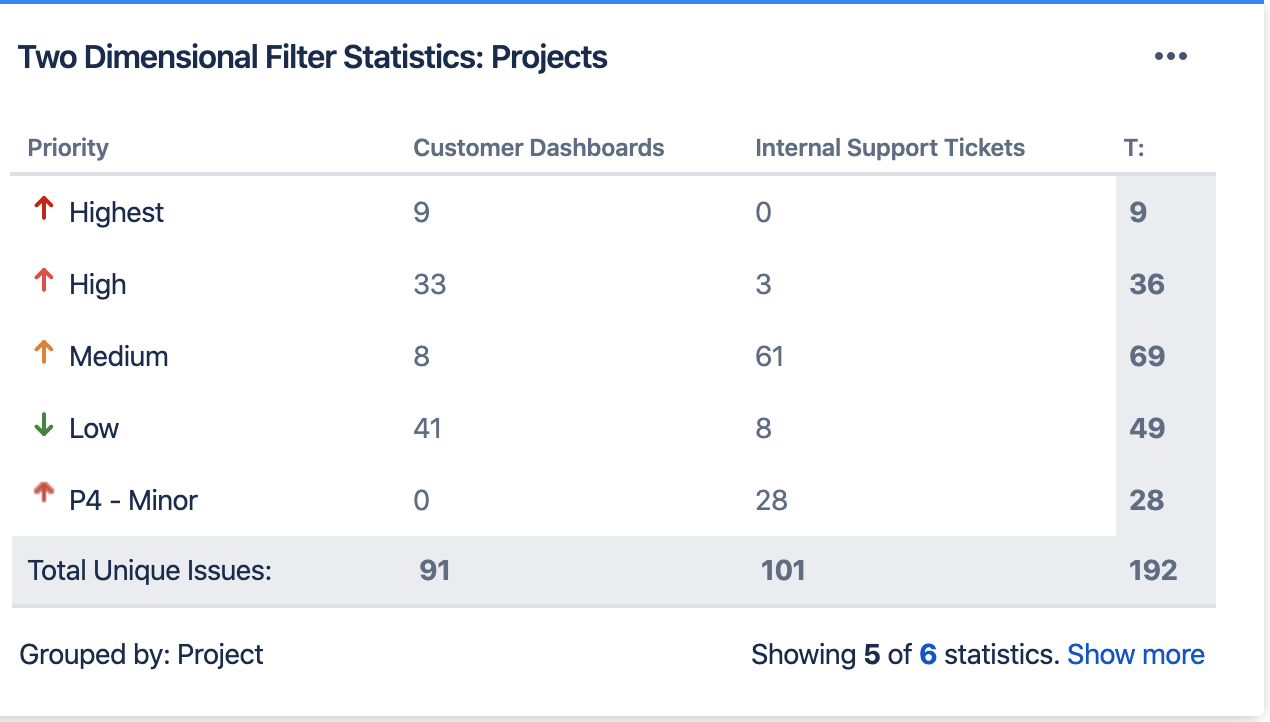
So, while there are more overall issues in the internal support tickets project, those in customer dashboards are higher priority, which should influence the resources allocated to the project.
Drill down into blockers with Enhanced Search
Another way to avoid breached SLAs and similar complications is to continuously monitor blocked issues – tasks that we cannot start before we complete other prerequisite tasks. We want to see which issues are stalled by blockers, and then determine whether they can be solved by some kind of intervention.
While Jira allows us to define blockers for specific issues, creating a list of issues that are currently blocked is a bit trickier. This query will give us issues that have blockers:
But in many cases, it’s possible that these prerequisite blockers have already been resolved, and we can actually start work on the issues that were previously stalled. We want our list to only show issues where a blocker is currently preventing us from starting work.
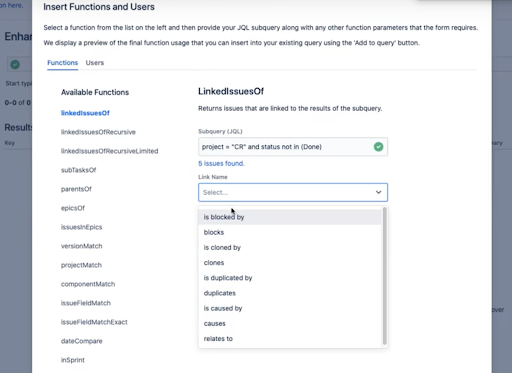
To do this, you can use Adaptavist’s Enhanced Search. This Marketplace app extends JQL functionality to support nested queries (subqueries) and provide a broader set of capabilities for creating JQL filters in Jira.
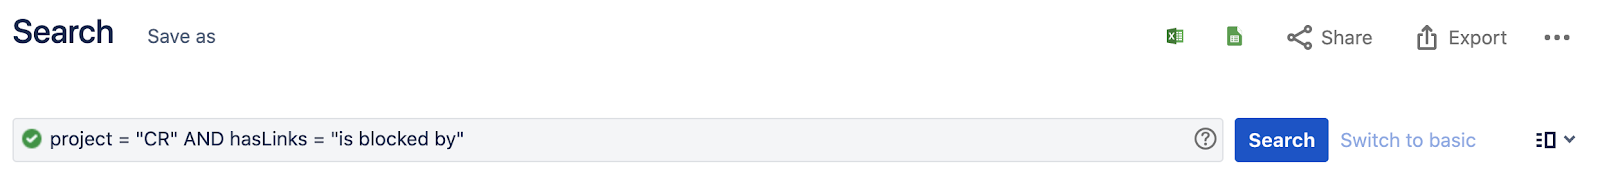
Using Enhanced Search, we can build a nested query that will only return issues with blockers that are currently in a status other than Done:
This will translate into the following JQL:

Once we’ve created this filter, we can add it to our dashboard using the filter results gadget shown above. Alternatively, we can use the filter to highlight issues in our Kanban board, demonstrated in the video walkthrough below:
Learn more
ITSM dashboards are all about surfacing a quantitative overview of the crucial details buried deep within service projects, which can then be consolidated to provide visibility into the high-level pulse of your operations. By building effective dashboards that present all the relevant information from a bird’s-eye view, and allow for further drill-down as necessary, you’ll be in a position to improve your ITSM operations, increase IT productivity, and gain a better understanding of business-critical activities.
Click below to learn more about Enhanced Search for Jira, and to get a free trial.