

Introduction
Forge is Atlassian’s cloud app development platform. It’s a serverless, Atlassian-hosted environment that allows developers to extend products like Jira and Confluence, and it powers thousands of apps running inside customer organizations.
As Forge grew, we introduced usage-based pricing, so developers only pay for what they use above a free tier. With that shift came an engineering challenge that my team was tasked to solve: how to reliably measure, attribute, and bill that usage at scale.
At a high level, we:
- Collect usage events from Forge services (compute, storage, logs, etc.) through a shared usage pipeline
- Transform and route that usage into Atlassian’s internal billing systems to create subscriptions and invoices
- Feed usage and cost back to developers via the Developer Console and APIs so they can understand, predict, and control their spend
Building this end‑to‑end flow sounds like “just metering and billing,” but it quickly became a deep engineering problem: making sure we neither lose nor double‑count usage, keeping different systems in sync, and enforcing limits or budgets without impacting the reliability customers expect from Atlassian cloud.
This post walks through how we put that platform together, from the high‑level architecture and core components to some of the toughest technical challenges we hit on the way to launch.
Architecture Overview
At a high level, Forge Billing sits in the middle of four worlds:
- Forge services that generate usage (compute, storage, logs, and more)
- A shared usage pipeline that standardizes and validates that usage
- Atlassian’s billing systems that turn usage into subscriptions, invoices, and payments
- Developer‑facing surfaces that expose usage, cost, and controls in a way that’s easy to understand
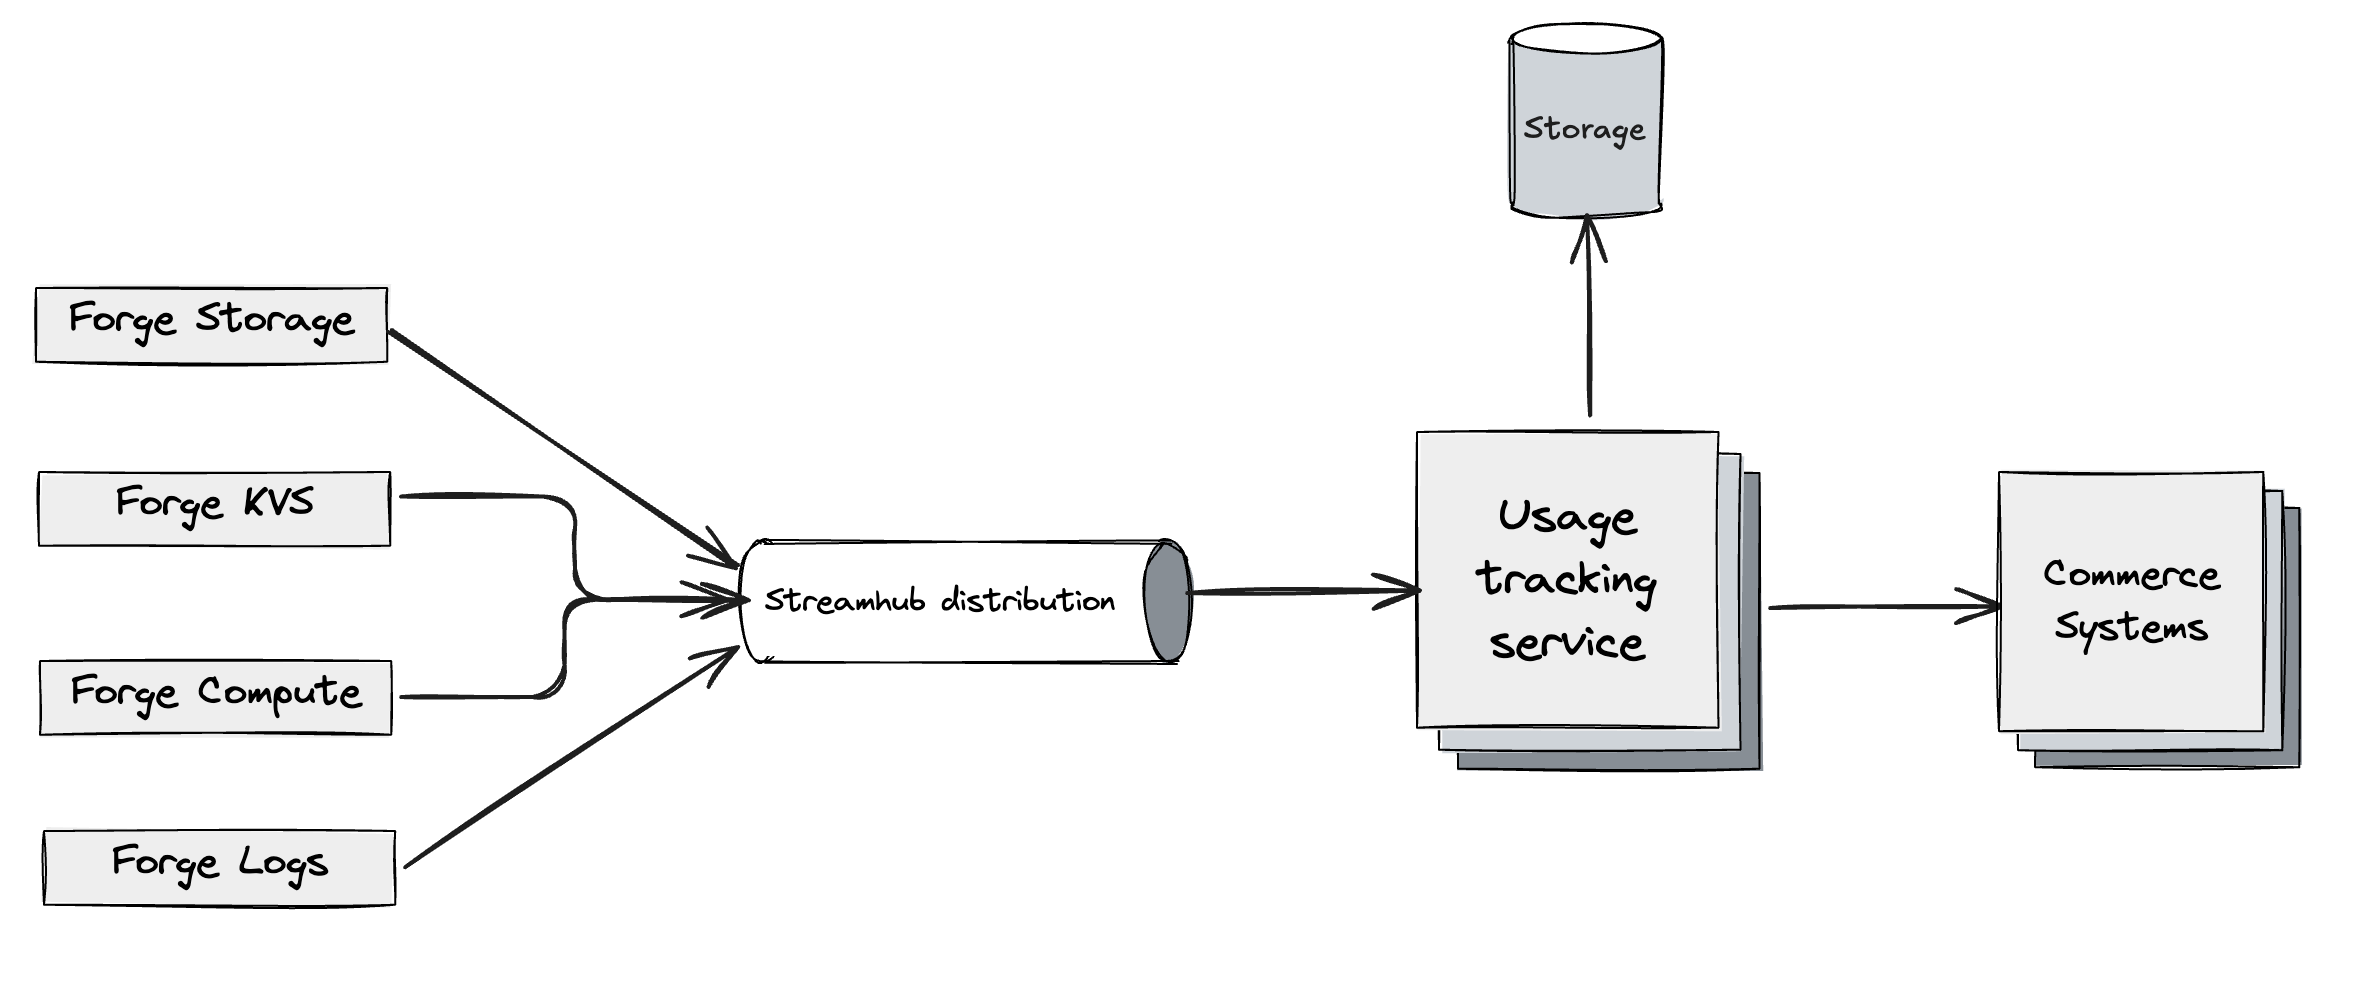
You can think of the system as a left‑to‑right flow:
Forge services → Streamhub -> Usage pipeline → Billing systems → Developer Console / APIs
Forge services emit usage
In Forge, every billable resource—such as function invocations, storage, or logs—is owned by a specific service team. Each owning service is responsible for measuring usage in a consistent way (for example, counting invocations, GB-seconds, or stored GBs), emitting usage events that conform to a shared “telemetry contract,” and ensuring the quality of that telemetry at the source. This includes avoiding missing fields, using well-defined units, and providing clear attribution back to the relevant apps and sites so that downstream billing and analytics systems can rely on the data.
This design keeps usage close to where it happens, while giving us a standard format downstream.
Usage events are routed through Streamhub
The events need to be reliably delivered to the consumer.
StreamHub is Atlassian’s managed event bus for asynchronous, service‑to‑service communication. Services publish domain events via a simple HTTP/REST API, and StreamHub validates each event against a registered JSON schema before persisting it to Kafka. Consumers don’t read Kafka directly; instead, they declare subscriptions (by AVI/schema/predicates), and StreamHub’s distribution layer fans events out to managed AWS resources such as SQS, SNS, or Kinesis on their behalf.
The usage pipeline normalizes and verifies
All of those events flow into a shared usage pipeline called UTS (Usage Tracking Service), which acts as the nervous system for Forge Billing. UTS ingests events from multiple producers in near real time, validates and normalizes them against agreed-upon contracts, and enriches them with additional context where needed (for example, resolving app IDs, environments, and installationContexts). It also deduplicates and orders events so that usage is neither lost nor double-counted, providing a reliable foundation for downstream billing and reporting systems.
By the time usage leaves this pipeline, it’s in a shape that our billing systems can safely consume.
Billing systems create subscriptions and invoices
Once usage is normalized, it’s handed off to Atlassian’s internal billing and Commerce systems. In this stage of the flow, we group usage by the appropriate billing entities (such as transaction accounts, subscriptions, and products), apply the pricing logic defined for Forge (including consumption-based pricing, free tiers, and any discounts), and generate invoices and financial records that can be reconciled with Atlassian’s broader billing and reporting systems.
This is where a usage spike in a Forge app turns into a line item on an invoice.
Entitlements, limits, and enforcement
Billing alone isn’t enough; we also need to translate billing state into what an app is allowed to do. That’s the role of our entitlements and enforcement layer, which maps each app to concrete entitlements (what resources an app can use) and enforces limits and budgets (for example, free‑tier thresholds or hard/soft limits) in coordination with service teams. If payment is not made within the stipulated period, dunning flows are triggered and the subscription may be cancelled. For more context on how Forge billable capabilities and pricing work, see Forge platform pricing
This is one of the parts of the system where correctness really matters: a bug can either stop legitimate apps from running, or let runaway usage accumulate without corresponding revenue.
Developer Console and APIs for visibility and control
Finally, we surface all of this back to developers through:
- The Forge Developer Console, which shows usage and cost per app or developer space
- APIs (GraphQL and REST) that allow automation and integration with developers’ own tooling
Here, the focus is on clarity and predictability: helping developers answer questions like:
- “How much of the free tier am I using?”
- “What are the main drivers of my bill?”
- “What happens if my usage doubles next month?”
Underneath those simple views are the same usage events and billing records that power invoices and entitlements.
Deep Dive: From Forge Telemetry to Visual Experience
So far we’ve talked about the usage pipeline in broad strokes. In reality, the path from a Forge usage event to something we can safely bill on runs through several layers: Forge, Usage Tracking Service (UTS), Atlassian’s internal data lake hosted on top of Databricks/S3 (named Plato), and finally a query layer on top.
This section walks through that journey and some of the trickier engineering problems we had to solve along the way.
Forge usage → UTS: getting onto the shared rail
The story starts in Forge:
- Forge services emit usage
Function runtimes, storage, and logging services emit usage events using a shared usage contract (usage key, count, timestamp, unique ID, and dimensions like app, installation, org, etc.). - Forge usage service → UTS
The Forge usage/billing integration takes those events, maps them to UTS meters and schemas, and sends them to Usage Tracking Service (UTS) via StreamHub. At this point we’ve essentially said: “this is official, billable usage” and put it onto the same rail as other Atlassian products.
Key complexity here is attribution and shape: every event must be attributed to the right entitlement / subscription context, and it must fit the UTS contract so that downstream systems don’t need to know anything about Forge internals.
UTS as the hub: from raw events to analytics-ready data
Once usage enters UTS, it flows through the upgraded UTS architecture built on Plato:
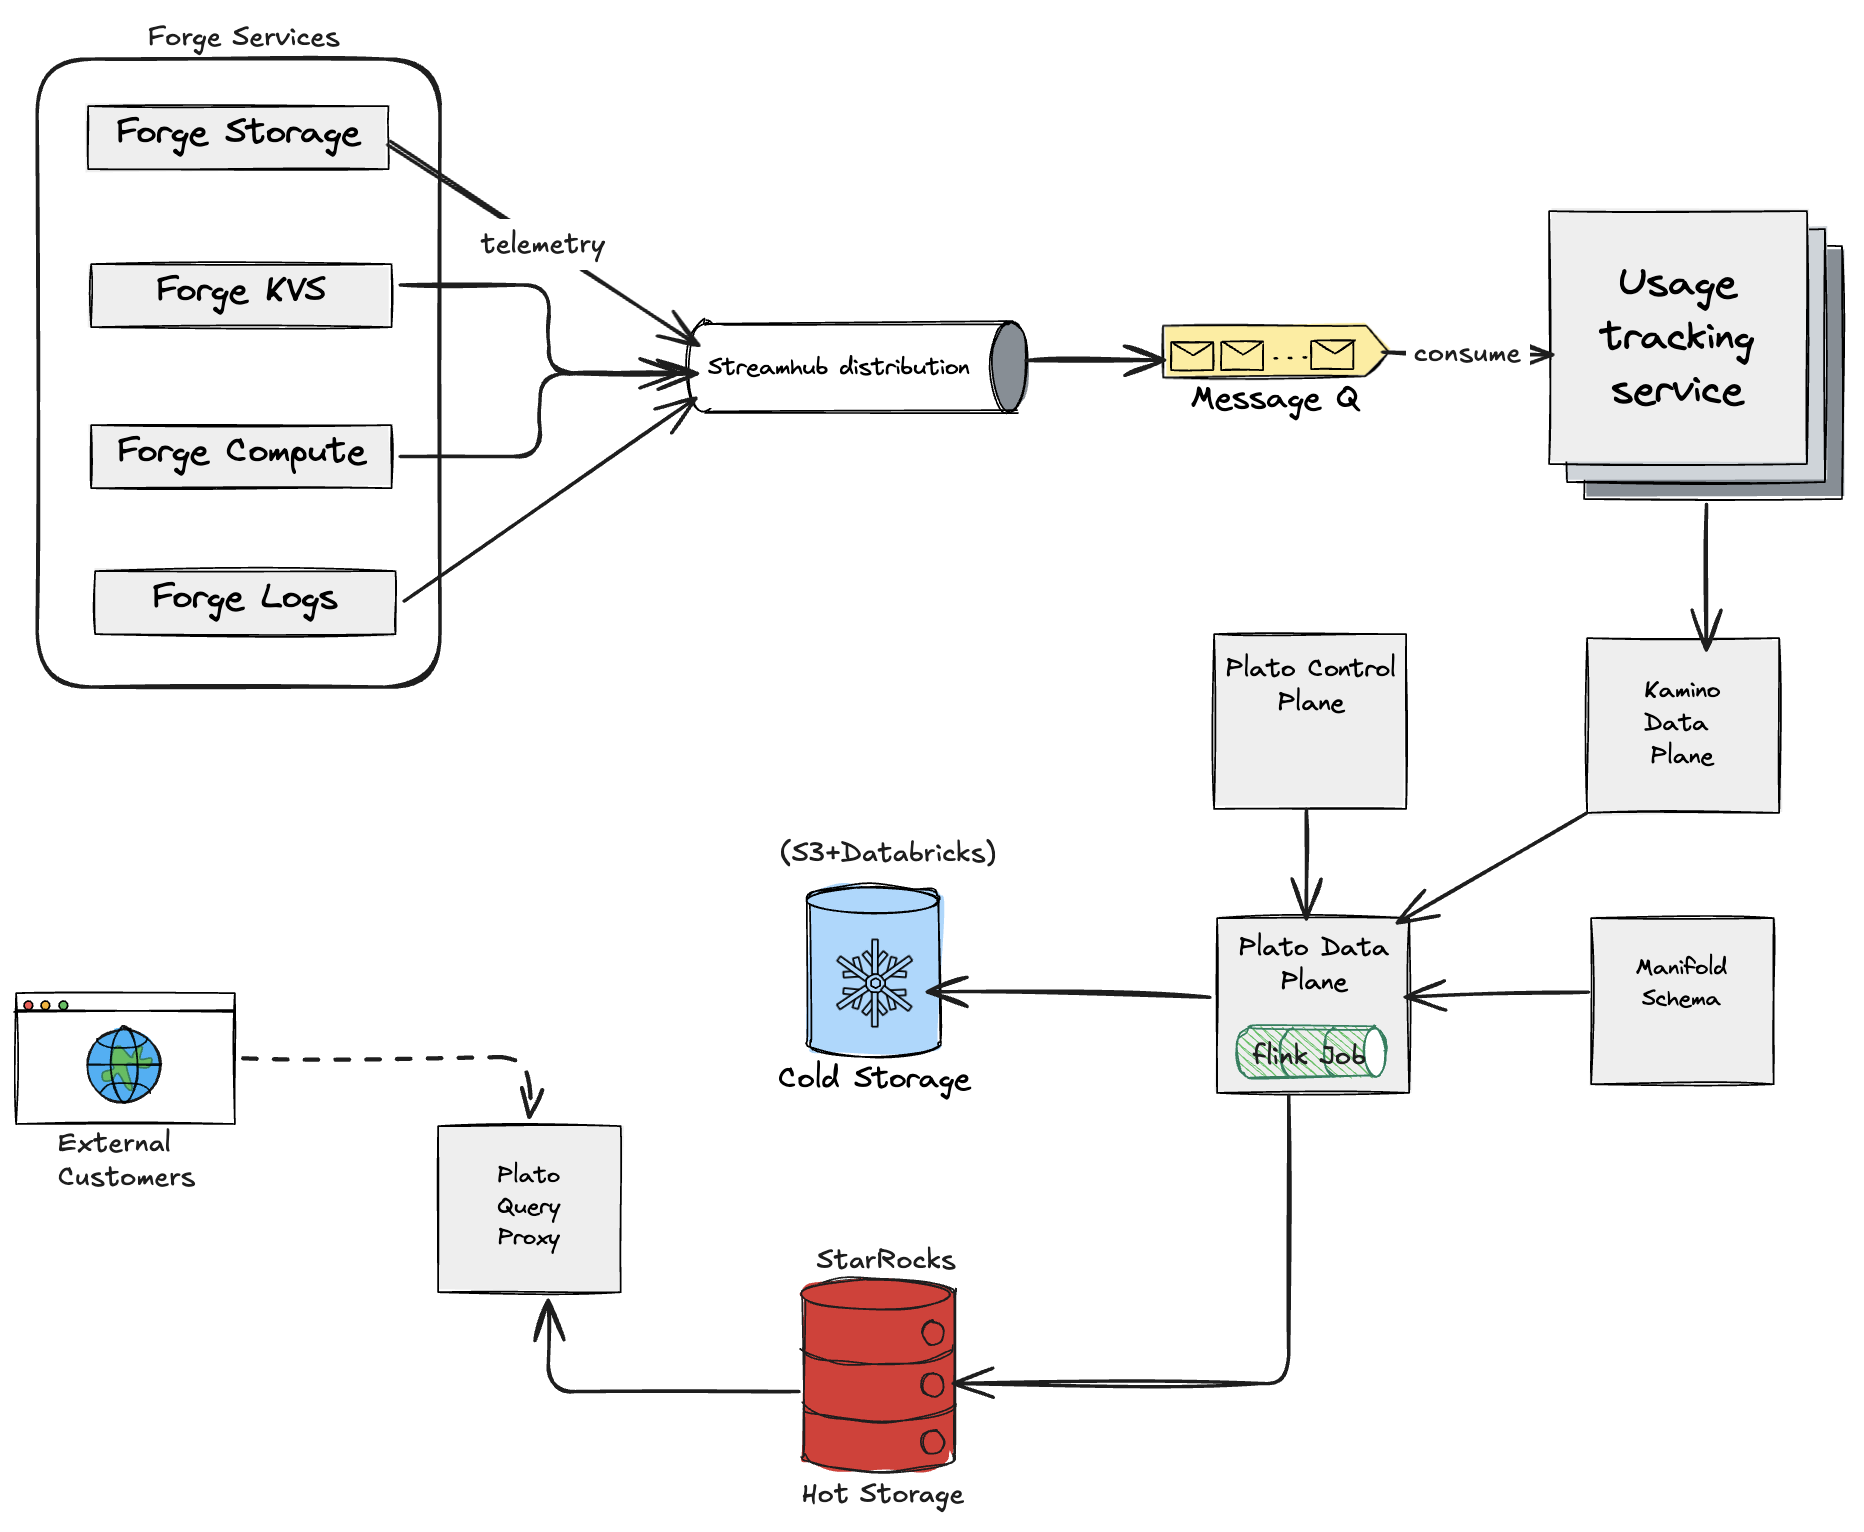
- Ingestion into UTS
UTS ingests usage events from StreamHub, validates them against its schemas, and persists them as the source of truth for usage. This is the point where enforcement, allowances, and billing logic can start reasoning about the data. - UTS → Kamino (service to service data replication pipeline)
UTS then forwards usage into the analytics side of the world via Kamino, which is the ingestion layer into Plato. Conceptually this is:UTS (usage store) → Kamino (pipe) → Plato (data lake) - Plato cold tier (raw tables)
Kamino writes usage into Plato’s cold tier: raw, append-only tables that hold the unprocessed events. This is our durable, audit-friendly storage where we can always go back and see “what actually arrived from Forge and UTS”. - Flink jobs → Plato hot tier (refined tables)
From cold tier, Flink jobs build hot tier tables in StarRocks. These are query-optimised, refined views over the raw data:- Cold tier = raw events, source of truth
- Hot tier = curated, indexed, aggregated tables for dashboards and APIs
- PQP / query layer
Finally, a Plato Query proxy layer (PQP), also called User Query Service (UQS), sits in front of hot tier and exposes usage to consumers (like the Forge Developer Console and internal tools) in a way that’s safe and permissioned.
For Forge Billing, this means that when a developer opens “Usage & Charges” page in the Dev Console, they’re effectively looking at UTS usage rendered via Plato hot tier and not a special Forge-only analytics store.
Last-write-wins, duplicates, and why “exactly once” isn’t trivial
A big part of making this work was deciding how to handle duplicates and late events while keeping billing correct and explainable.
There are two main patterns in play:
a) Counter-style metrics (e.g., invocations, requests)
For strictly increasing counters (like number of function invocations or storage requests), the model is:
- Treat each event as a delta (usageCount for a key + timestamp).
- Use idempotency keys (like a
usageUniqueId) and windowing to ensure that replays and retries don’t create extra usage. - Aggregations are usually simple sums over a window (hour/day/month).
If we see the same logical event twice, we recognise it via the unique ID and discard the duplicate. If we see multiple legitimate events in a window, we sum them. This is the “classic” event-streaming correctness problem.
b) Gauge-style metrics (e.g., “bytes stored over time”)
Storage is more interesting. Here we care about capacity over time (GB‑hours), not just a request count. The UTS doesn’t support gauge metrics directly and we need to convert them to counter equivalent. The pipeline effectively does:
- Periodic or on-change samples of “bytes stored” at a partition / installation level.
- Downstream, we aggregate those samples over time to get GB‑hours.
The tricky part is: what if we get multiple values for the same partition and window?
We had to choose something deterministic and defensible. In simple terms:
- For a given partition and hour, multiple updates are reconciled using a “last write wins” style rule within that window.
- For billing, we then derive GB‑hours based on the time‑weighted evolution of that value over the hour (or by using an average where that better reflects the business intent).
This gives us three important properties:
- Idempotency: if the same update is replayed, we just overwrite with the same value; totals don’t change.
- Determinism: if we re-run a job or backfill from cold tier, we arrive at the same answer.
- Explainability: we can show “these are the values we saw in this window, and here’s how we turned them into GB‑hours”.
Under the hood, UTS + Plato’s pipeline uses event-time windowing, deduplication, and ordering to make this last-write-wins behaviour correct in the presence of late data and partial outages. Flink’s state and checkpoints are doing the heavy lifting here and the API we expose is to allow developers to see their billable usage for that app and hour.
Hot vs cold tier: correctness vs performance
Plato’s two tiers offer a clear separation:
- Cold tier (raw):
- Append-only, full history of UTS output.
- Used for audits, backfills, and investigations.
- Hot tier (refined):
- Aggregated, denormalised, optimised for fast queries.
- Served to dashboards, APIs, and consumers.
For Forge Billing, this split lets us:
- Keep developer-facing queries fast
- Still recompute or reconcile by replaying cold tier into hot or recovery paths if issues arise.
When we talk about “exactly once” for billing, what we really mean is: given the set of events that made it into cold tier, the pipeline from there to hot tier and Commerce is deterministic and stable, and we have mechanisms to recover from the inevitable operational bumps.
Why this matters for Forge Billing
Putting it together:
- Forge services push usage into UTS using shared contracts with backward compatibility.
- UTS and Plato turn that into a billable truth that’s durable (cold tier), fast (hot tier), and queryable.
- Our handling of duplicates and late arrivals, counters, last-write-wins, ensures we don’t double-charge and can always explain where a number came from.
- This architecture is robust, resilient, and handles massive scale. Our current volume is around 300M usage events per day, expected to exceed 600M within 6 months and 1 Billion events in a year.
This combination is what makes it possible for Forge Billing to sit on Atlassian’s revenue path without becoming a black box. When a partner asks, “Why was I billed this amount?”, we can trace the answer step by step from Dev Console view all the way back to the raw events that entered UTS.
Deep Dive: From Developer Spaces to Bills, Allowances, and Overages
With usage flowing through UTS, the next step is mapping that usage to who is billed, how free quotas are applied, and when overages are generated. For Forge Billing, this is centered on the Developer Space.
Developer Spaces as billing accounts, apps as entitlements

A Developer Space is the billing account for Forge:
- Each Developer Space maps 1:1 to a billing account in Commerce.
- Invoices are generated at the Developer Space (billing account) level.
Within a Developer Space:
- Each Forge app is represented as a Commerce entitlement under that billing account.
- Usage is attributed per entitlement (per app).
- Charges for all entitlements are aggregated into a single invoice for the Developer Space, with per‑app breakdown.
This gives developers and teams one bill per space, while still exposing costs per app.
Per‑app allowances and the monthly billing cycle
Forge applies free quota at the app level, not the space level. The system operates on a monthly billing cycle per Developer Space. At the start of each cycle, Commerce configures allowances in UTS for each entitlement and meter, covering resources like free function invocations, free GB-hours of storage, and free log volume on a per-app basis. As usage events arrive throughout the month, UTS tracks how much of each app’s allowance has been consumed. At the end of the billing cycle, Commerce resets all per-app allowances through UTS APIs, and the cycle begins again.
Forge services emit usage; allowance accounting and free‑tier application are centralised in UTS and Commerce, on a per‑app basis.
Overages and invoice generation
When an individual app exceeds its free quota on a given meter, the excess usage beyond the allowance is called an overage. UTS calculates this overage for the app’s entitlement and meter and emits an overage event to Commerce systems. Over the course of the month, Commerce accumulates these overage events, applies Forge pricing to each one, groups the resulting charges by entitlement and meter, and generates a single monthly invoice for the Developer Space with line items that reflect per-app overages.
Free quota is always evaluated per app, and only the portion beyond each app’s allowance becomes billable overage as part of the monthly invoice.
Budgeting & alerting
To make usage‑based billing predictable for developers, we introduced built‑in usage alerts at key thresholds of the free quota and paid usage.
Today, Forge provides fixed alerting when an app’s usage crosses 50%, 75%, 90%, and 100% of its allowance or configured budget. These alerts are surfaced consistently across apps so developers get early, progressive signals before they hit hard limits or unexpected charges.
Conclusion
We set out to build a reliable, end‑to‑end Forge Billing platform that turns raw telemetry into accurate, explainable charges and permissions. From services emitting usage through StreamHub, to normalization in UTS and analytics in Plato, into Commerce for pricing and invoicing, and back to developers via the Dev Console, the system now operates as a deterministic, governed pipeline.
Correctness and reliability have been our north stars: no double counting, consistent attribution, repeatable backfills, and behavior that stands up under load. The platform already handles ~300M usage events per day (and growing), with strong guarantees around ordering, deduplication, and auditability.
Thanks for reading and if you’re building on Forge, we’d love your feedback as we roll more exciting things in the future.


