
Advancing modern teamwork
AI thinking and product news to unleash the potential of teams
Leading with Context: Lessons from Atlassian’s AI Journey
This report reveals the five questions driving our transformation, the frameworks we tested, and what actually accelerated and improved delivery. Learn what our research shows separates teams that simply adopt AI from those that transform with it.


“You Should Be A Little Uncomfortable”: How Cursor Is Navigating the New Shape of Product Craft
Latest by topic
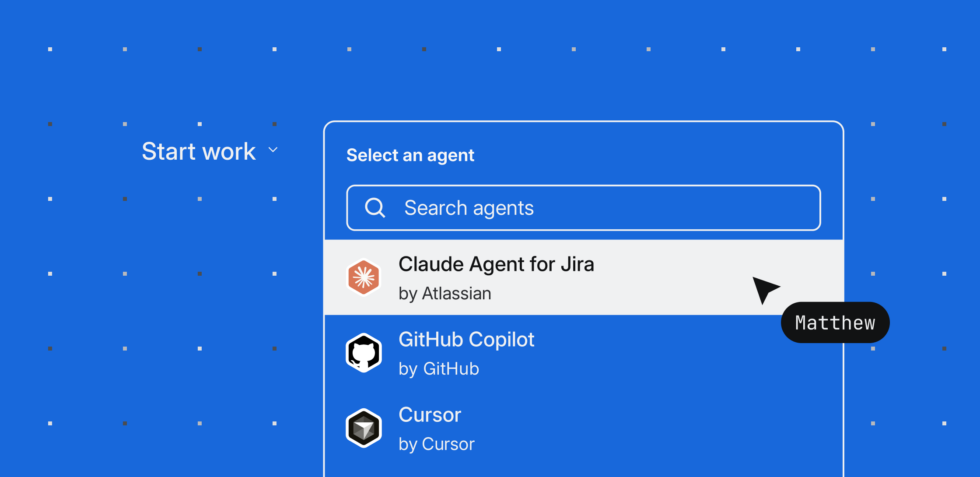
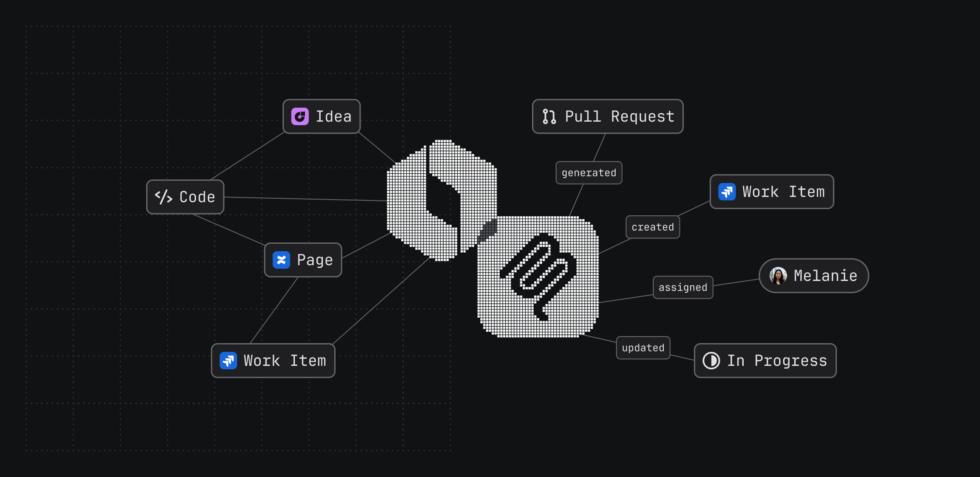
How we’re evolving Jira for AI-native software development
New Jira and Teamwork Graph capabilities help engineering teams plan, assign, govern, and measure work across humans and AI agents.

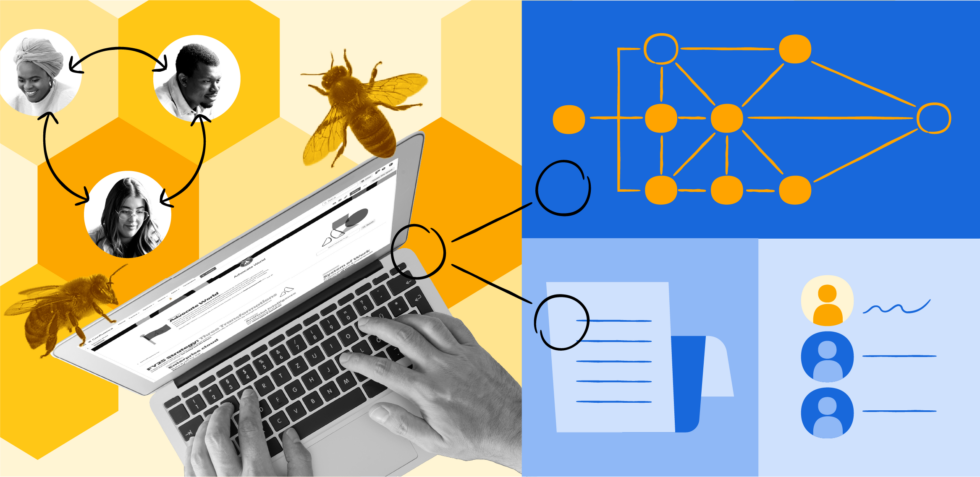
Why AI alone isn’t enough for enterprises (and what Mercedes-Benz did about it)
How connected data and AI agents are closing the gap between individual productivity and enterprise-wide transformation.
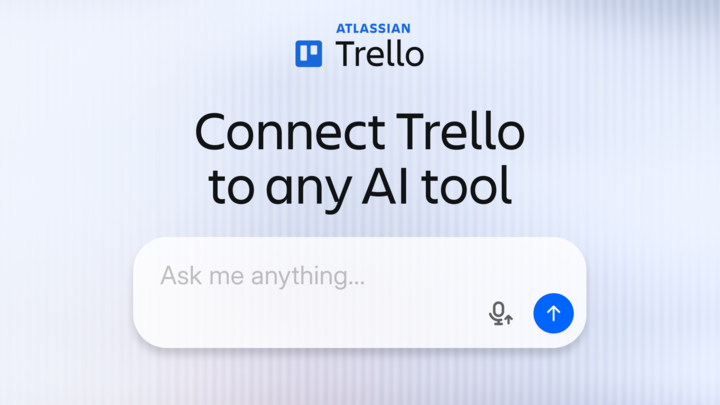
Connect Trello to Your Favorite AI Assistants with Trello MCP
Great ideas can start with a random spark at 2 a.m., grow through a planning session with ChatGPT, or take shape in a brainstorm with Claude. AI helps you plan, but getting that plan into Trello has always been a manual, momentum-killing process. Today, that changes. Trello now uses MCP (a shared standard that lets […]

Why individual AI speed isn’t delivering the ROI CIOs expected
89% of executives say AI has increased speed. Only 6% can point to org-wide ROI. IDC’s Wayne Kurtzman and Atlassian’s Liz Fosslien unpack what’s missing – and where CIOs should start. Everyone on your team is faster. So why isn’t your organization moving further? That’s the provocation at the center of a recent fireside chat […]
Subscribe for more
Inside Atlassian
Get the latest research and insights on AI, teamwork, and more.

How Atlassian for Startups grew from an experiment into a global program
Early-stage startups face a particular set of growing pains. It’s not just figuring out what to build and for whom – there’s also a need to measure progress, coordinate across projects, and keep knowledge accessible, all while likely making some drastic pivots. These challenges are what we call a “collaboration tax,” and if it isn’t […]

Meet the Knowledge Architect: The Role Every AI-First Organization Will Need Soon
While most enterprises are talking about how they approach AI transformation, increasingly knowledge management and arranging the required context are important factors in whether or

New research shows honesty about AI use at work is backfiring
New research from Atlassian’s Teamwork Lab finds that workers who disclose using AI are judged as 10x lazier than peers doing identical work, unless their

Teaching AI to speak our design language
Atlassian’s use AI to design and build every day, but AI tools are only as good as the context they have. We translated the Atlassian

Stop counting who uses AI. Start finding who’s transforming with it.
At Atlassian, we’ve gone through three evolutions of how we measure employee AI adoption. Each time we changed the metrics, we learned something telling about

The AI-native SDLC is paying off: 19% more PRs and 2–3 hours saved per developer per week
Reimagining software development around an AI-native SDLC AI is now a core part of how software gets built. 93% of developers use AI tools and

Atlassian Design System: Building the context engine for the AI era
Design systems are no longer ‘just’ about consistent UI and component libraries. They’re strategic capabilities that harness design intent, drive coherence and accelerate a team’s

Good people management begins with self-understanding
Author Margaret Andrews shares the unsung importance of knowing yourself, plus a worksheet to kickstart your self-understanding journey.

How to minimize the impact of manager changes
Outcomes hinge on how the transition is handled, not how often it happens.

Advice for first-time managers, from leaders who’ve been there
If you’re new to leading a team, take these 29 tips from a slew of seasoned managers.

How executives can bridge the strategy-execution gap for tech-driven organizations
Learn how C-levels can remove chaos and drive clarity by building a truly connected enterprise and optimizing their approach to AI.

How to handle team conflict as a first-time manager
Three scenarios specific to new managers, plus what to do when all else fails.

75 inspirational leadership quotes you haven’t heard yet
For something to inspire and support your work, take a look at these quotes from true leaders.

5 micro-challenges to make your team stronger this week
Strengthening your team’s performance doesn’t have to mean a complete overhaul of your rituals and tools. A little consistency – in how you collaborate, connect

The Dunning-Kruger effect: why and how we overestimate our own abilities
We all have the tendency to overestimate our own abilities (yes, even you). Here’s how to make sense of this cognitive bias.

Brain drain: Are Zombie Projects eating your team’s productivity alive?
Picture the scene: You’ve returned from a wonderful holiday break, invigorated to tackle ambitious projects, and then it hits you. Maybe it’s pinned to your

Toxic positivity at work: how to spot it and squash it
Though well-intended, extreme optimism can hurt more than it helps. Here’s how you can trade false reassurance for true resilience.
All brains on deck: 10 best practices for knowledge-sharing
One person’s knowledge isn’t enough to execute the work that really matters. Even your team can’t go it alone. To make great things happen, your

How hands-on workshops boost teamwide AI confidence
When teams learn by doing, AI stops feeling abstract and starts driving real behavior change, from higher usage to stronger everyday skills.

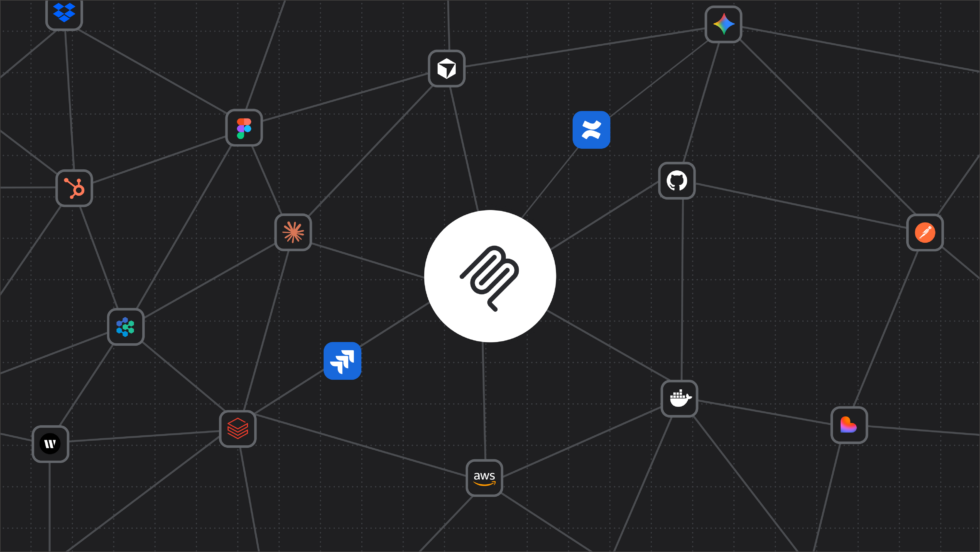
AI that knows your business
How Atlassian connects your organizational memory across tools, teams, and decisions

Secure AI adoption with data loss prevention (DLP)
Your AI strategy is only as good as your data security foundation AI makes your organization’s knowledge easier to find and use. That’s the whole
What 5M+ daily MCP tool calls taught us about the future of AI at work
Over a million users trust Atlassian’s Rovo MCP server every month to do real work through agents. We dug into those interactions: how AI agents
Introducing new MCP capabilities that turn context into action
Atlassian Rovo MCP gives coding agents deeper, scoped access to complete their goals in Jira, storing and accessing critical context directly from the IDE or


Why AI Agents Drift Mid-Task and How a Multi-Agent System Fixes It
How specialist agent orchestration anchored to Jira keeps complex coding tasks on spec. You have probably felt this. You hand a capable AI agent a

Deeplink to your AI coding tool from Jira
Brief your local coding agent with one click from Jira. No copy-paste, no context lost.

Improving Code Reviewer with Atlassian PR Context
Code Reviewer already knew the rules. We gave it history. Rovo Dev Code Reviewer catches PR issues related to code bug, code design, code readability,

Build AI-powered Forge apps with Atlassian-hosted LLMs
LLMs have become a core tool in every app developer’s stack, powering features that feel almost magical. Users can query data with natural language, summarize

How We Cut up to 80% of Engineering “Chores” Using AI Agents in Jira
Flaky tests and stale feature flags drain engineering time quietly. Here is how Atlassian’s engineering team uses AI agents in Jira to automate both.

From Ambiguous Questions to Action: Research Mode in Rovo Dev CLI
Not every developer question starts as a coding task. Sometimes the hard part is figuring out where to look: Jira for work history, code for
How Content Assistant raised the design quality bar without slowing us down
AI is moving fast, and Atlassian app teams are rolling out new features at a cracking pace! In a quest to make sure that UX

The future of product craft: Why AI-native PMs build better products, not just work faster
AI use is accelerating across the modern enterprise. Teams are moving faster. The barrier to building will continue to drop. But the cost of building

Optimisation Tools for Jira: Reducing Configuration Bloat and Enhancing Performance
As Jira Cloud grows to support larger and more complex customers, so does the configuration that powers their work: custom fields, work types (formerly issue

The bottleneck keeps shifting: What AI is changing about how we build
Over the past few decades in the technology industry, some of the biggest constraints to building products have been about having enough engineers, time, or

Designing In Variables: How Control Panels Accelerate The Way We Design
A year ago, my workflow looked very different. When a design problem opened up, I explored it by hand. Multiple screens. Multiple flows. Sometimes two

Designing AI products you can depend on
Everyone is shipping AI products now, and most look impressive in demos but fail in the messy reality of daily work. The problem often isn’t

See our newest AI research

Is AI flattening your team’s creativity? Here’s how to tell.
AI can make “good enough” thinking the default. Use this framework to spot the risks of AI over-reliance and decide when humans — not models — should lead.

AI made your people faster. But it’s your office that’s slowing them down.
AI made individuals faster, but your office is still designed for the old bottleneck. Atlassian research reveals a new framework for the AI-enabled office.
Watch, listen, and learn

How Atlassian leaders are building a culture of AI-fluent teams
According to Atlassian’s 2026 State of Teams report, a growing gap has emerged: while AI makes individual tasks faster, many teams are struggling to keep that work aligned. In this panel discussion, Atlassian executives share an inside look at how they are operationalizing AI within their own departments to turn early experimentation into durable, connected […]

Best practices for writing AI prompts
Prompt engineering is essential for anyone looking to use AI tools, and, like any skill, it takes practice to master.
Highlights: Wendy’s recipe for launching faster with Atlassian
Discover how Wendy’s, one of the world’s most iconic restaurant brands, uses Atlassian tools to modernize teamwork and accelerate product launches. From new Frosty flavors to hamburger innovations, Wendy’s has unified its restaurant operations, IT, and business teams to move faster and replace legacy manual processes.

Permission to build: Hardwiring a founder mindset into the enterprise
What does it take to maintain a founder’s mindset when your organization scales from a garage to a global powerhouse? Atlassian CEO and co-founder Mike Cannon-Brookes sits down with Reddit co-founder and Seven Seven Six investor Alexis Ohanian to talk leadership and teamwork amid the rapid technological shifts brought by AI. Drawing on their founder […]
Explore more

Atlassian named a 4x Leader in the 2026 Gartner® Magic Quadrant™ for DevSecOps Platforms
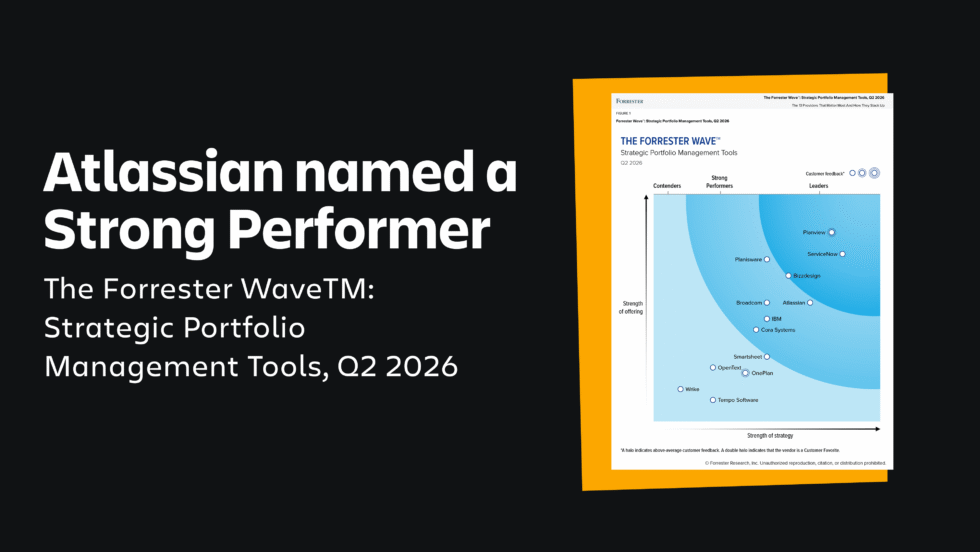
Atlassian named a Strong Performer in The Forrester Wave™: Strategic Portfolio Management Tools, Q2 2026

Prevent container image overwrites with immutable tags in Bitbucket Packages

How Loom turns customer support into a driver of business growth with Atlassian Customer Service Management

How 24 Hour Fitness transformed IT operations with Jira Service Management and Rovo Ops
Subscribe to unleash the potential of your team
Inside Atlassian
Research and insights on how teams can deliver with AI.