
Over the last few years, the workplace has changed dramatically. Organizations and teams have had to move from in-office to remote to hybrid work fluidly while producing the right outcomes for their customers, investors, and employees. All this has not been easy. Our research has shown that only 17% of teams are healthy, and given Atlassian’s mission is to help unleash the potential of every team, we want to help.
To help teams work differently, but together, we’re investing in the Atlassian platform – a common technology foundation across our apps that connects teams while allowing them to work with the tools of their choice. The Atlassian platform allows work to flow seamlessly across tools and teams, automating mundane processes so that teams can focus on what matters and make better decisions faster using data-driven insights.
Today, we’re excited to announce two new capabilities from the Atlassian platform that help everyone in the organization from leaders to end users get flexible access to all their data from our products – Atlassian Data Lake and Atlassian Analytics.
Atlassian Data Lake: data from the Atlassian portfolio of apps in one queryable place
Atlassian products are critical systems for managing work across all teams, and therefore, contain data that can inform key decisions on team velocity, resource allocation, and return on investment. In the past, we’ve provided contextual data and in-product dashboards to help teams get such insights. However, building custom reports hasn’t been easy or quick for most teams, as they had to extract data using APIs and scripts. Further, there really wasn’t a simple way to analyze cross-product or cross-instance data.
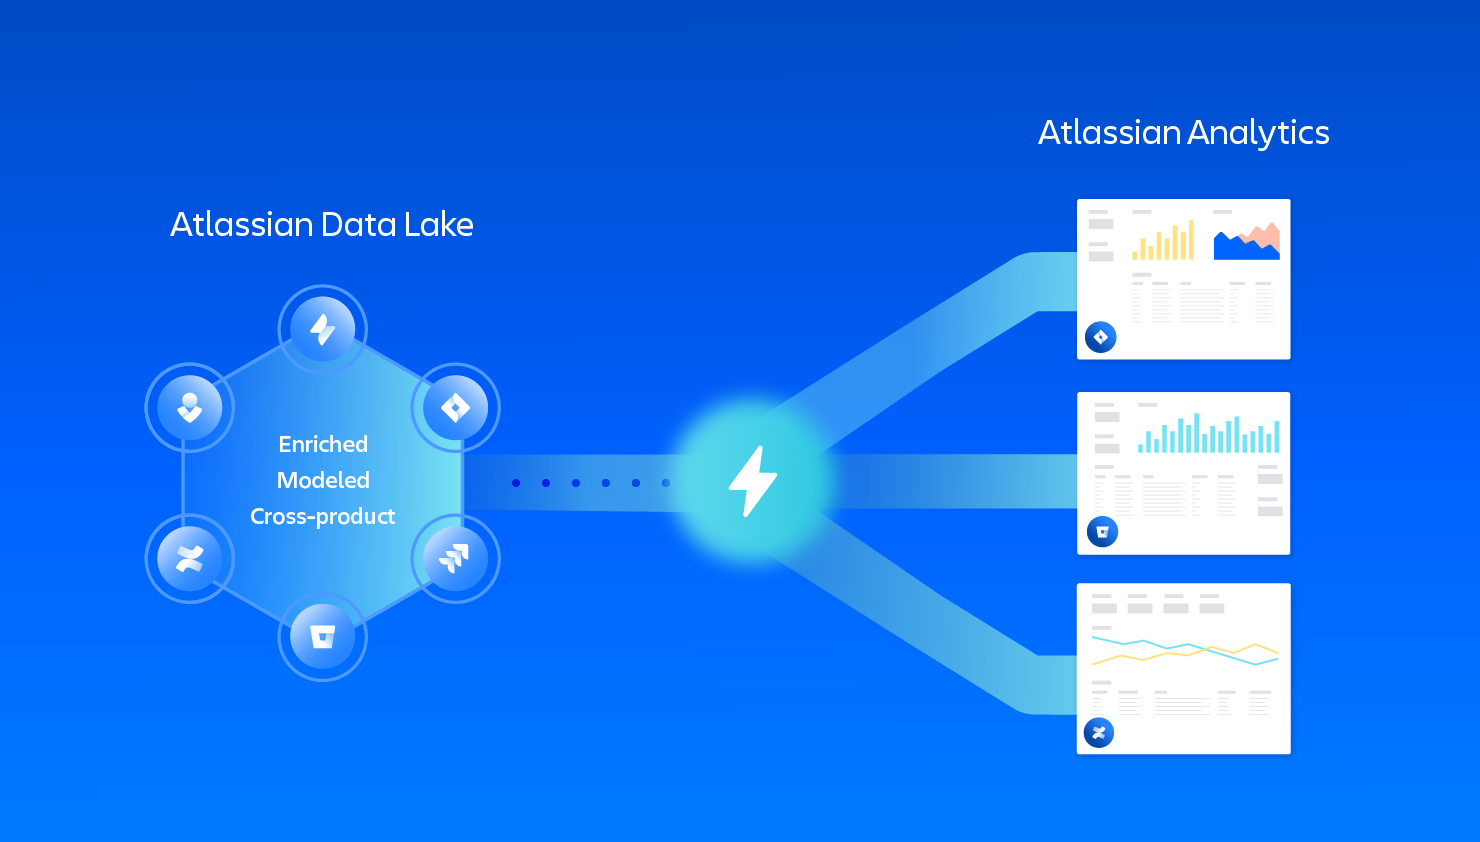
That’s where the Atlassian Data Lake comes in. It contains cross-product and cross-instance data for easy analysis with pre-modeled and enriched fields to speed up insight generation. Atlassian Data Lake is built on the enterprise-grade trusted Atlassian platform to ensure privacy and security.
At launch, Atlassian Data Lake will include data from Jira Software and Jira Service Management, but we’re working to bring all of the data across all Atlassian products into it. We believe the data customers put into any product belongs to them, and we want to enable full access in a simple, powerful way.
Atlassian Analytics: flexible ways to access and visualize your data via SQL or no-code
Every team has its own unique ways of working, and Atlassian products provide tons of flexibility to foster that uniqueness. We approached the access to the data in the Atlassian Data Lake with this same philosophy. Using the technology from Chartio, a cloud-based visualization and analytics solution that we acquired last year, we built Atlassian Analytics – a simple, flexible hub that seamlessly connects to the Atlassian Data Lake and allows users to access data in a variety of ways.
Here are some of the ways that Atlassian Analytics delivers insights leveraging the Data Lake:
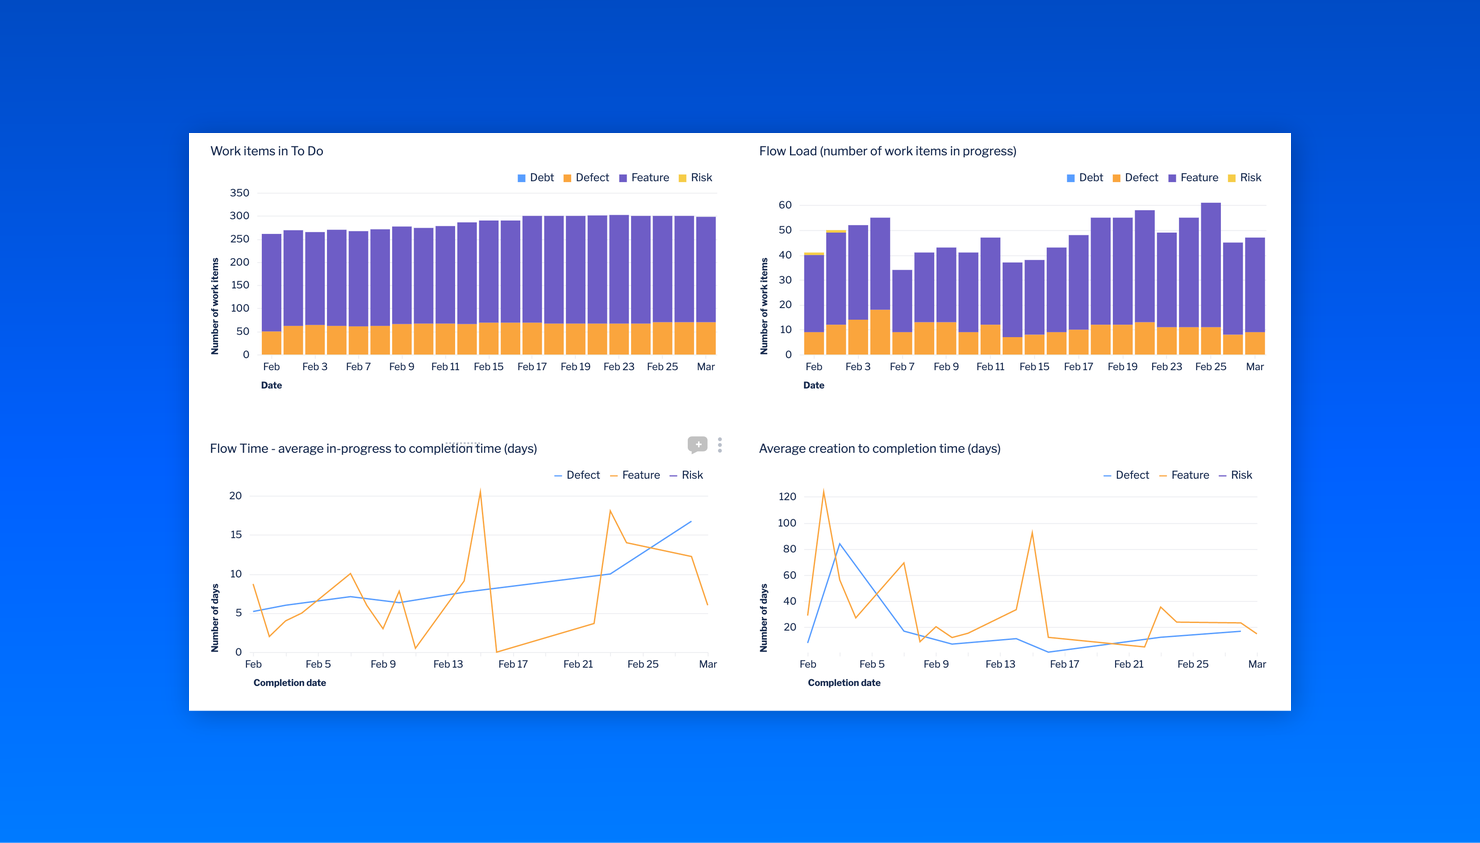
- Out-of-the-box interactive dashboards that offer cross-project and cross-product overviews of workflows. For instance, with the flow metrics dashboard, leaders can get end-to-end visibility into time to market, bottlenecks, blockers, and team load across various value streams. They can even drill down to project-level data for deeper insights.
- SQL visualization that lets users customize their dashboards and charts with the ability to run SQL queries directly against the Atlassian Data Lake.
- No-code visualization with Visual SQL is a no-code way of exploring data and creating charts for teams and users who want to build reports fast without using SQL. For instance, teams can bring in data around stories and bugs assigned to them from Jira Software and visualize this alongside any change requests or incidents from Jira Service Management to assess what they should prioritize first. They can visualize this data in any type of chart they like and bring the right people into the conversation by commenting directly on the chart so that decisions can be made with zero context switching. With the snapshot button, teams can also go back to the charts and data from the previous week to compare and understand trends.
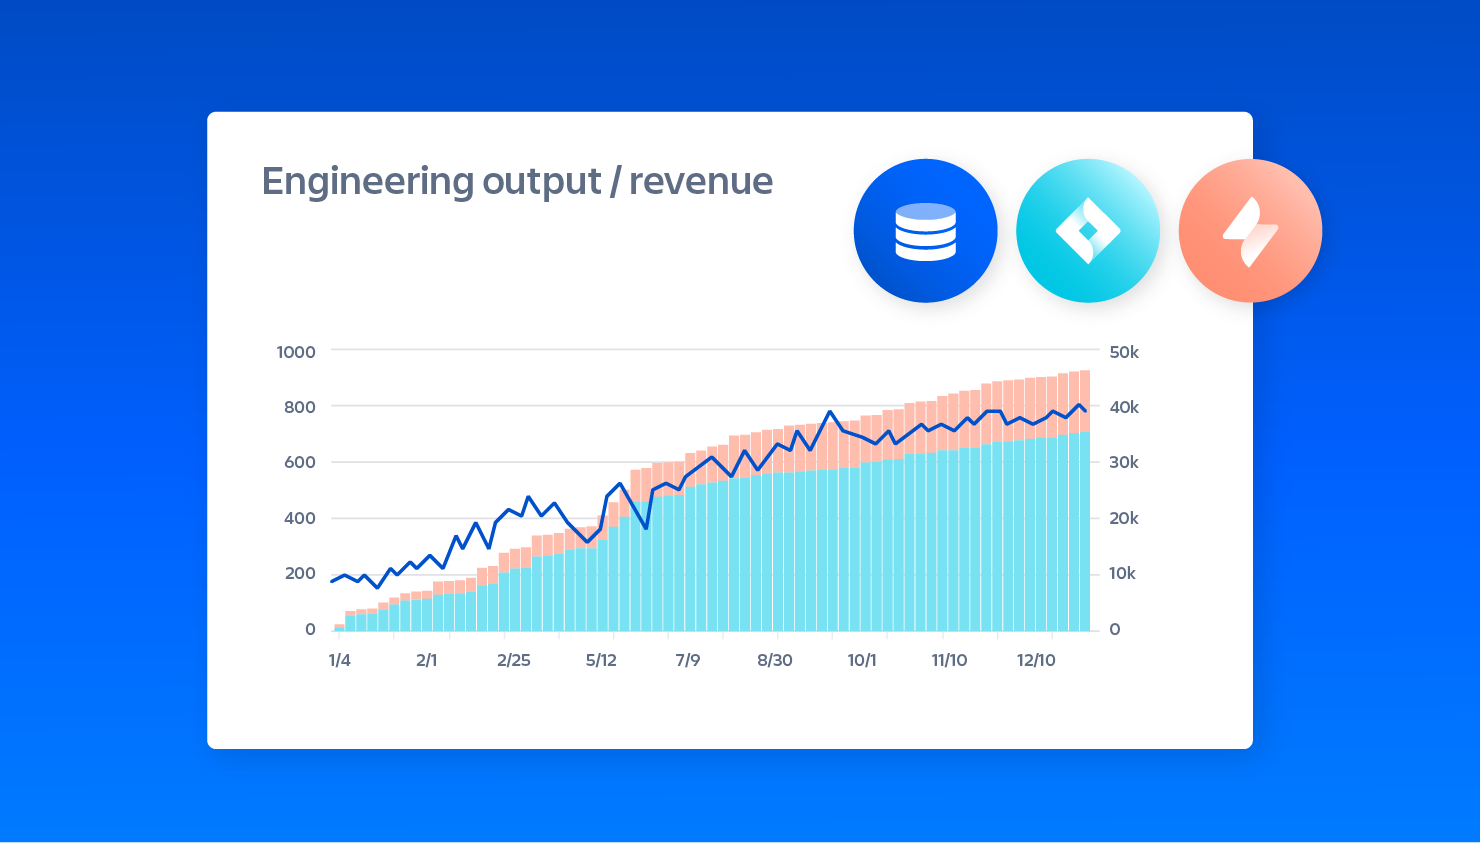
- Blend in data from other sources. Data from Atlassian products only gets more powerful when combined with other business-critical data sources. For example, you can create a report that maps revenue growth from Snowflake against engineering output from Jira Software to visualize how new features impacted growth goals.
- Coming soon – direct connection to external business intelligence (BI) tools. Finally, we know that many teams want to continue using their favorite BI tools, such as Tableau or Microsoft Power BI. Soon, we will offer the ability to connect the Atlassian Data Lake to these and other BI tools.
Imagine, in the future, every team gets tailored recommendations on how to improve velocity, and every leader gets insights into how to improve overall team health so that work gets done smarter and teams unleash their full potential! That is our ultimate vision, and with Atlassian Analytics and Data Lake, we’re putting the building blocks in place to achieve this.
Ready to get started?
Discuss Cloud Enterprise plans for Jira Software or Jira Service Management for access to Atlassian Analytics and Atlassian Data Lake – now available in Open Beta