
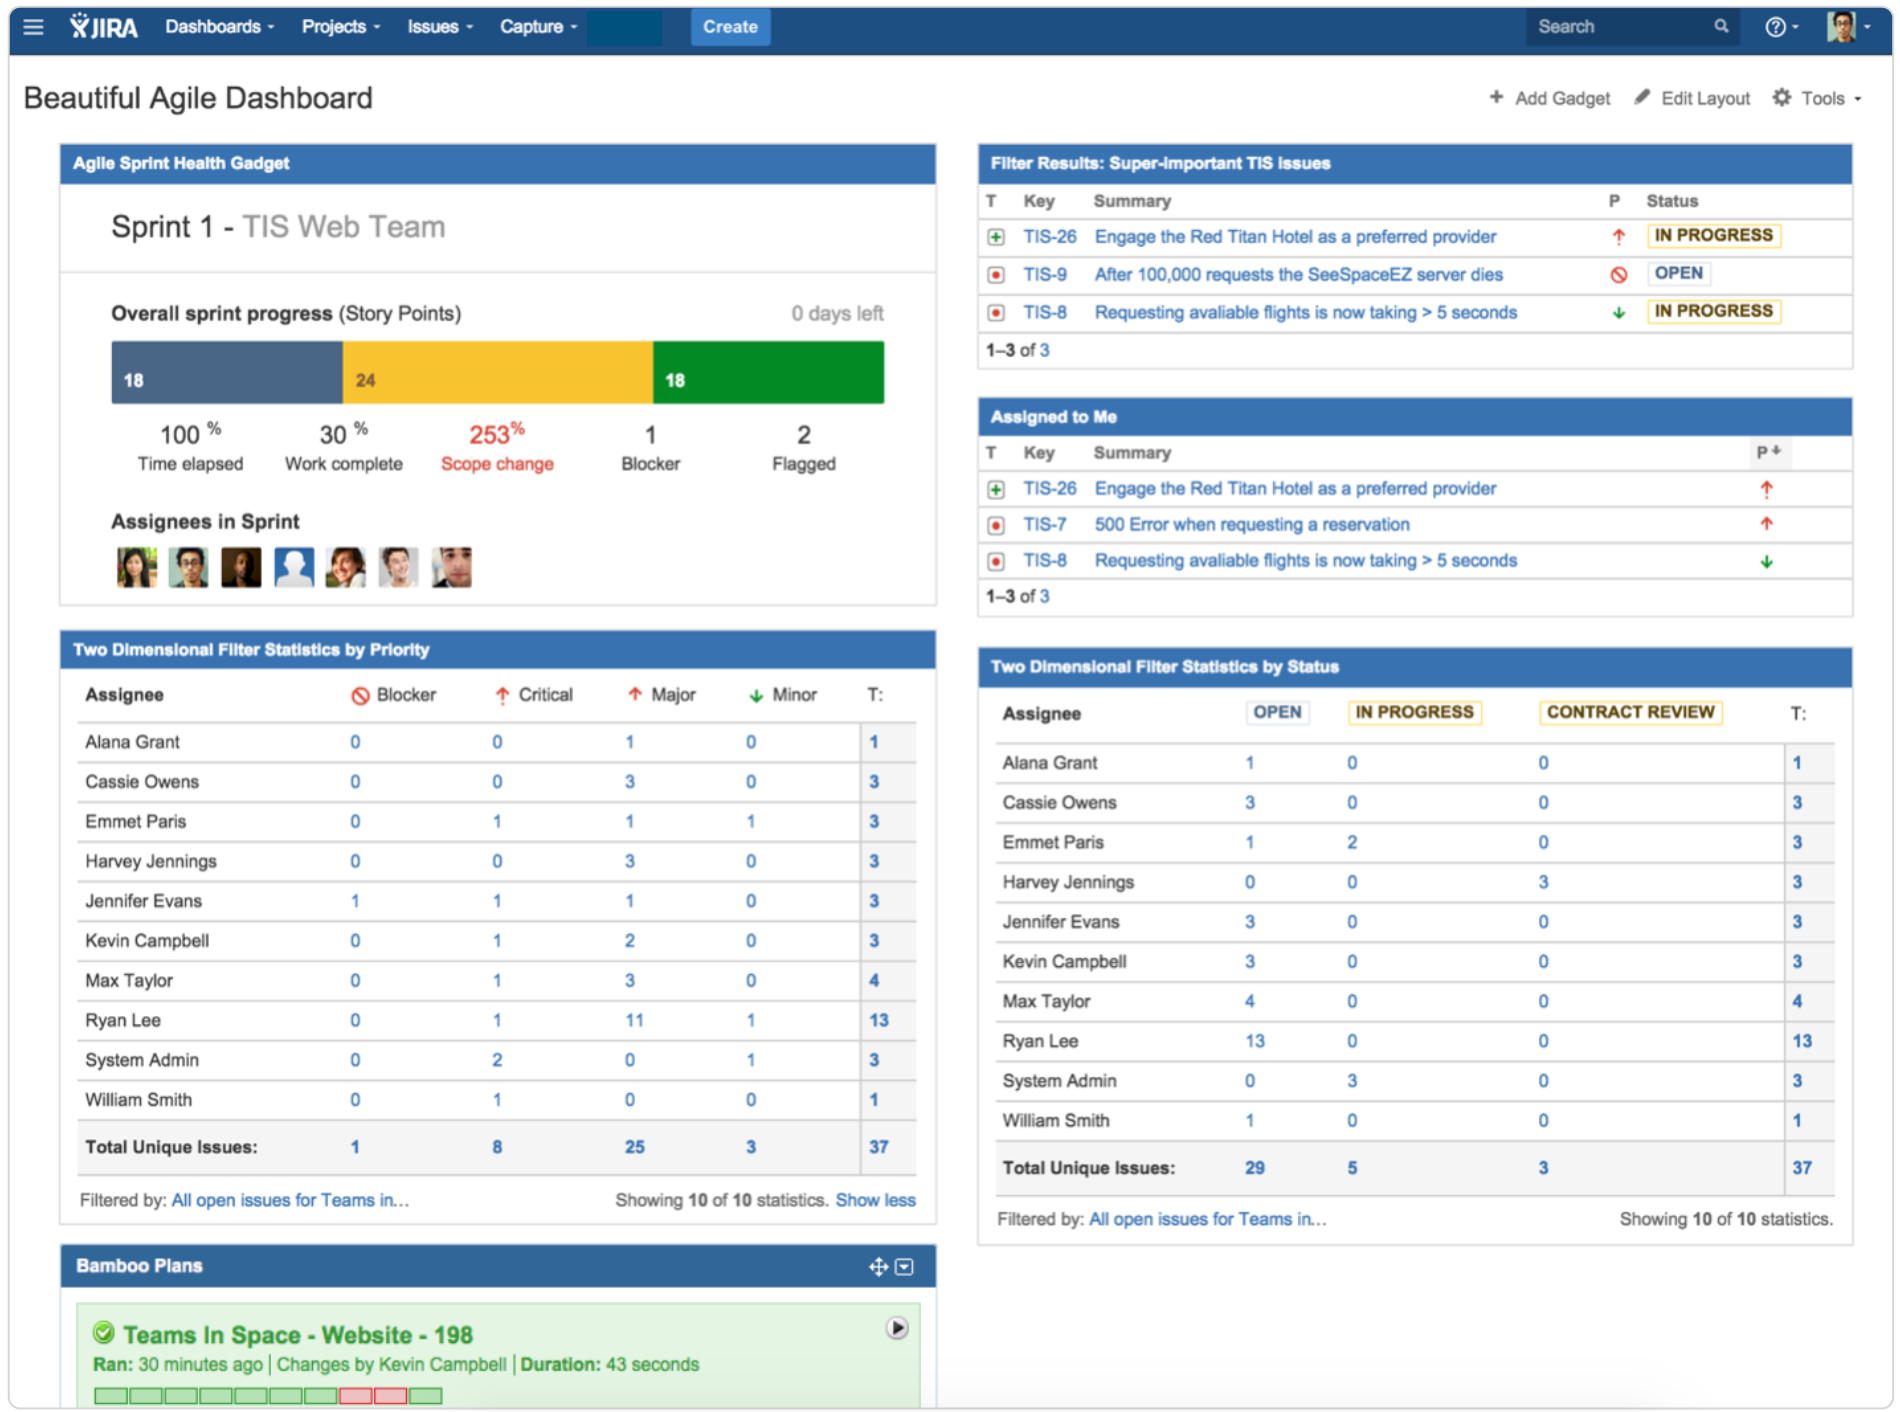
Greetings agile fans! A question I often get is how to configure Jira’s dashboards to show content that’s relevant for agile teams. It’s really just a matter of choosing the right elements. We’ll focus on a dashboard for a scrum team here, but many of these tips apply to kanban teams as well.
If you haven’t yet read our guide to creating a killer Jira dashboard, pause here and go read it now. (Go on… I’ll wait.) In it, you’ll see how to create a new dashboard and add gadgets, and I won’t repeat that info in this post. So consider that bit of background reading “step 0” ![]()
Pro tip:
A dashboard should always incite emotion or action. If it’s not clear to your audience why the data is relevant, take feedback and change the dashboard. It may take an iteration or two to properly tune your dashboard to your team and stakeholders.
1: The Sprint Health gadget
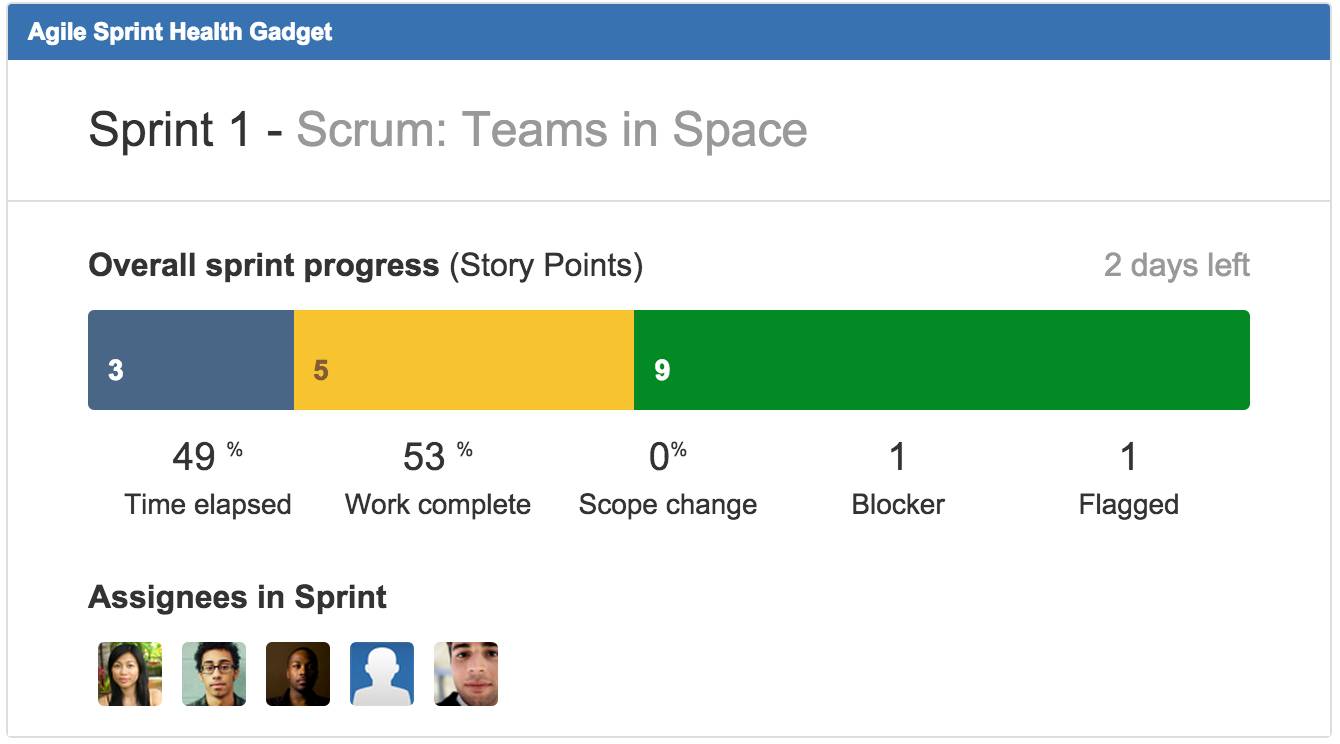
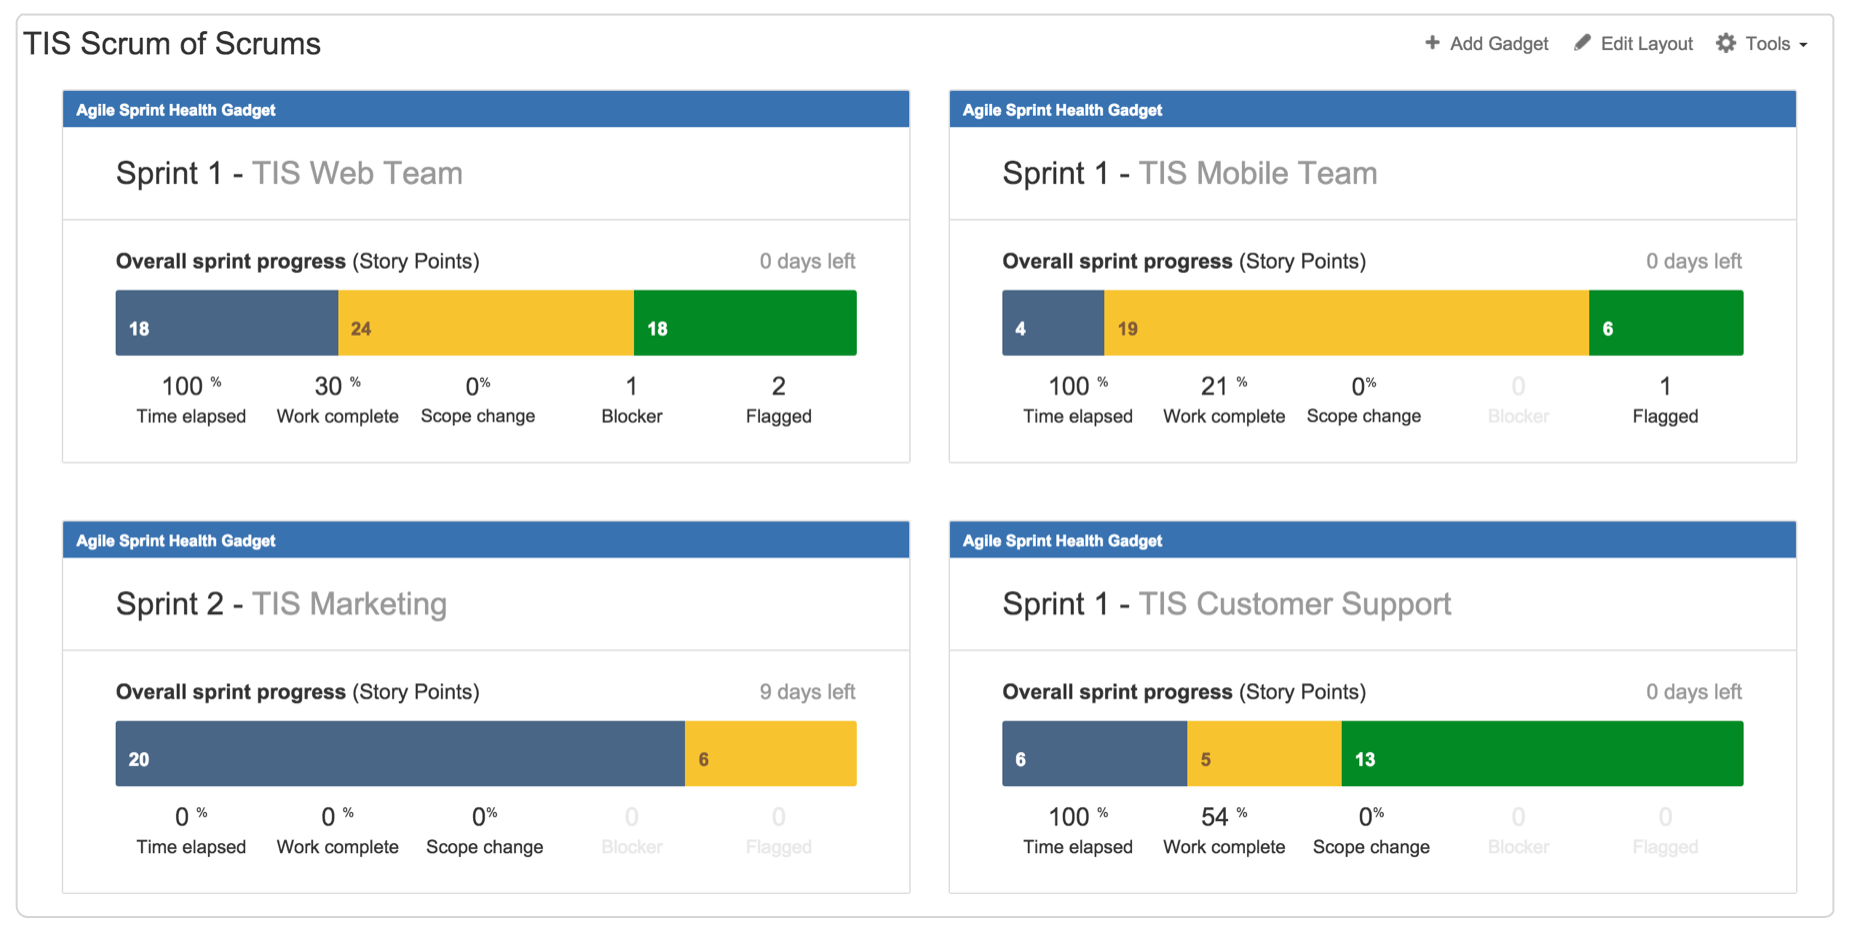
The Sprint Health gadget summarizes the most important metrics in a sprint. I like to have this one in the upper-left so everyone can see who’s working on the sprint and get a quick sense for any trouble in the air.
- Select the agile board you want to pull data from for the Boardfield
- Enable all three options underneath so assignees, sprint name, and board name are always visible
- Use the Next Sprint Due (auto) option for Sprint so you don’t have to update the gadget’s settings every sprint
- Hit the Save button, and bask in the glory of being super-informed
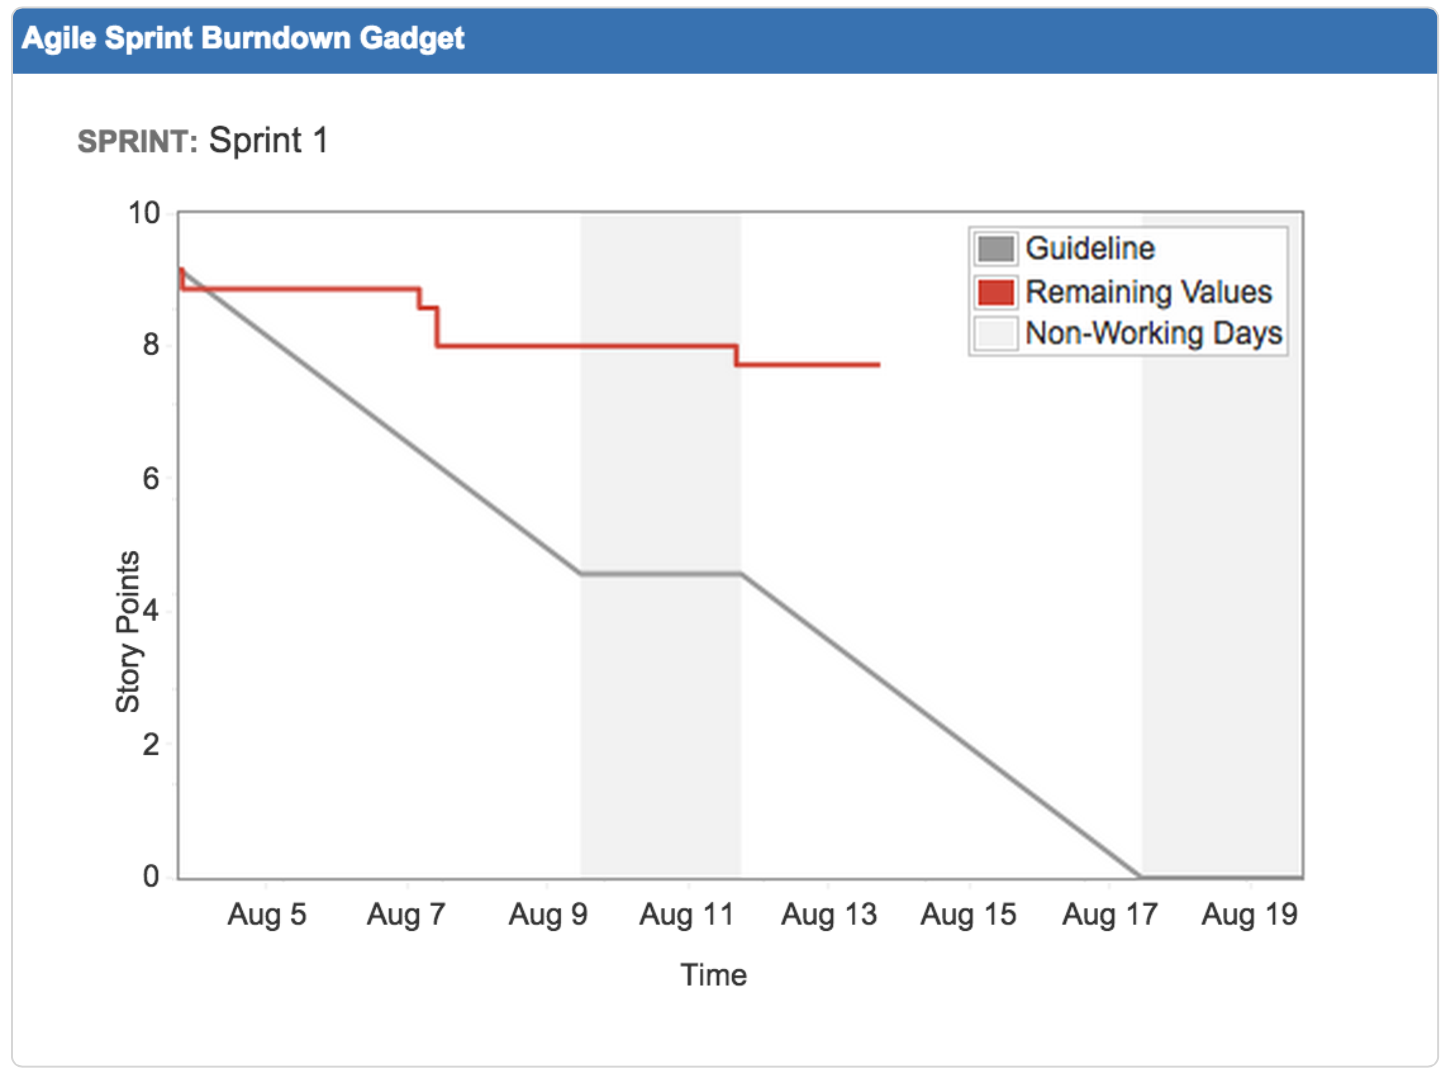
2: The Sprint Burndown gadget
The Sprint Burndown gadget shows your team’s track record for the current sprint. The beginning of the sprint is on the left and the end of the sprint is on the right. In general, we want to see the Remaining Values line stay under the Guideline, shown in grey.
For this chart to be accurate, estimation in the beginning of the sprint is critical. The chart uses the estimates to draw that guideline. What are the flat spots in the guideline? Jira has the ability to specify non-working days in your sprints.
- Add the Agile Sprint Burndown gadget to your dashboard
- Select your agile board of choice for the Board field
- Use the Next Sprint Due (auto) option again
Pro tip:
Check out our guide to project management. Even non-project managers can deliver the goods without losing their minds.
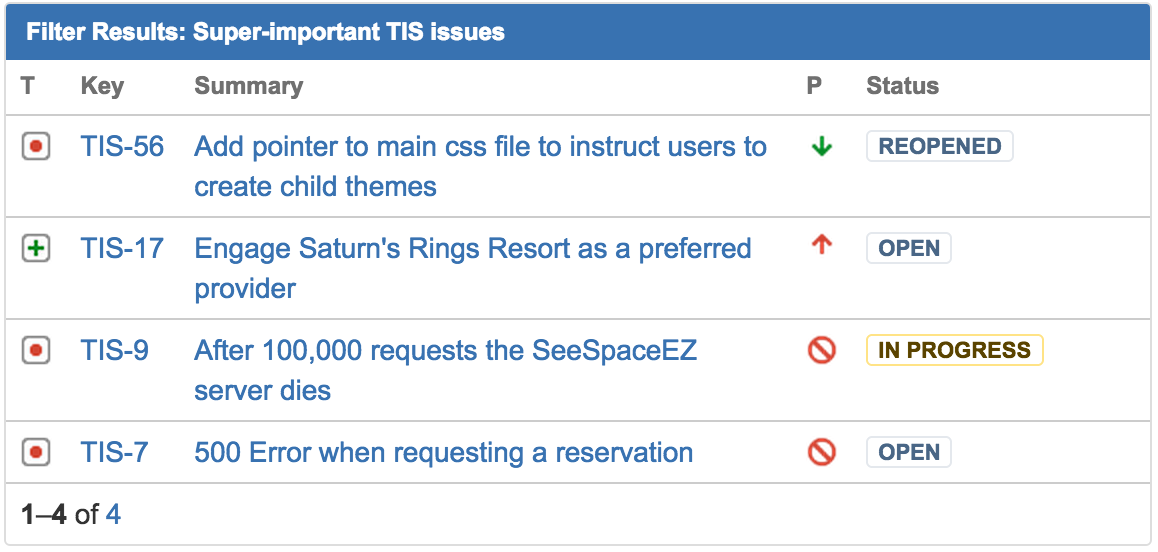
3: High-priority issues
I like to have a list of high-priority issues for my team in the upper right-hand corner. I can use a JQL statement to find any issue that has the Flagged field selected, as well as any issue that is considered a blocker. Why Flagged? Flagging an issue means that there’s an impediment for a team member to move forward. If an issue is marked priority = blocker, then that issue is globally important to the health of the project. Both are of concern to the team, but for different reasons. So your JQL statement will look something like:
sprint in (openSprints(), futureSprints()) AND project in (TIS) AND (Flagged is not EMPTY OR priority = Blocker)
- Add the Filter Results gadget to your dashboard
- Save the JQL above as a filter and enter its name in the Saved Filter field
- Adjust Number of Results as you see fit (hopefully your team doesn’t have more than 10 of these issues at a time!)
- Add Status under Columns to Display for easy reference
4: The Two-Dimensional Filter Statistics gadget
While a mouthful, the Two-Dimensional Filter Statistics gadget packs a real punch! You can configure it to slice a set of data so that it’s easy to find key areas of concern. Using this gadget, I want to know two things: how much does each team member have on their plate, and what are the relative priorities of work distributed throughout the team?
Let’s consider all of the open work in setting up our base filter. We can use the following JQL statement to show the work in the current sprint as well as future scheduled work:
sprint in (openSprints(), futureSprints()) AND project in (TIS)
Add the Two-Dimensional Filter Statistics gadget to your dashboard twice. We’ll configure the first one to show how much work each team member has on their plate:
- Save the JQL above as a filter and enter its name in the Saved Filter field
- Select Status for the X-axis field, and Assignee for the Y-axisfield
- Set Number of Results, to equal the number of members of your team
- Leave the rest of the fields set to their default values (or adjust as you see fit) and click the Save button
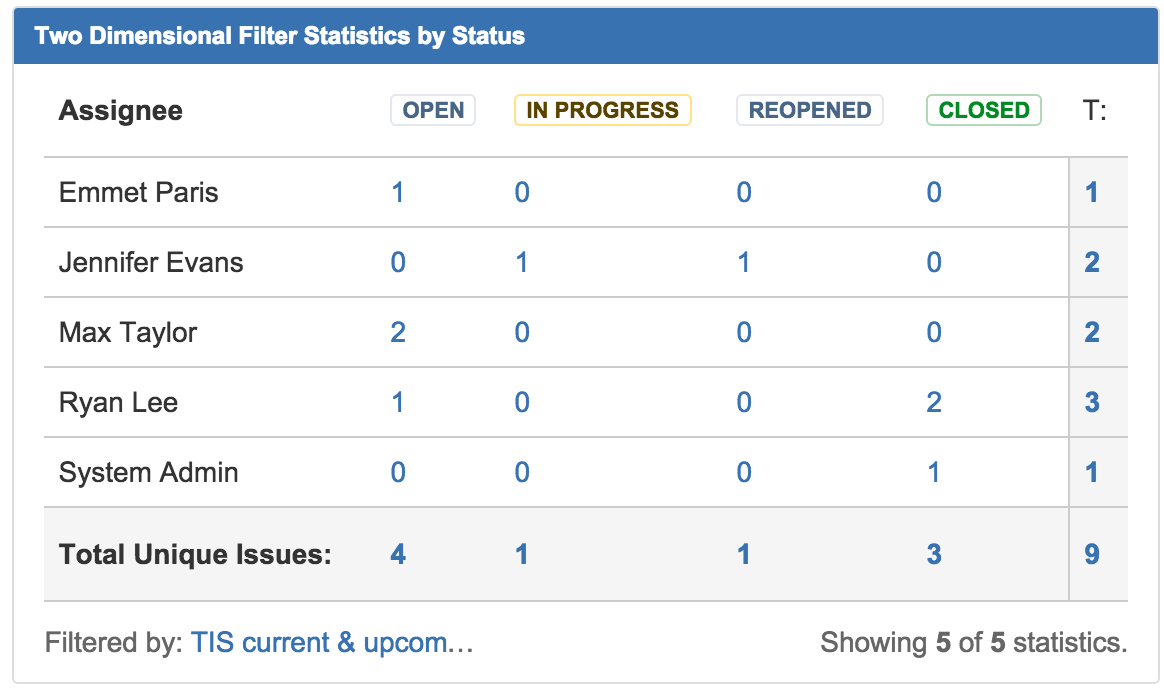
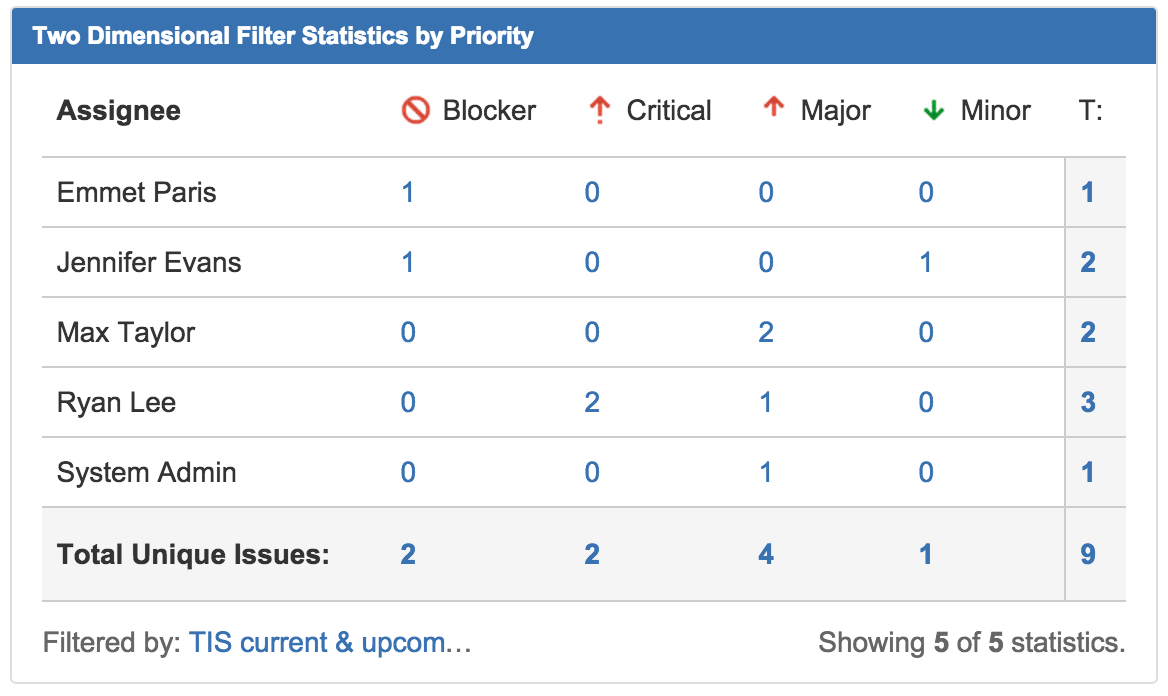
For the second gadget, follow the same steps as above, but select Priority for the X-axis field this time. Voila! In this example, we can see that one team member, Ryan, has 2 critical issues on his plate, while Max has no critical or blocker issues. Perhaps some issue shuffling and reassignment is in order.
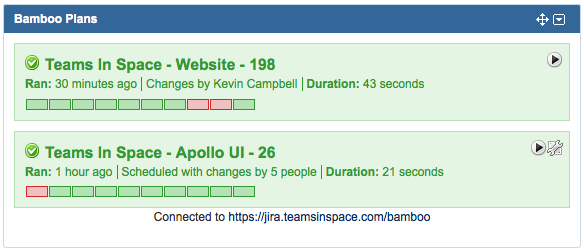
5: Continuous integration!
The most successful agile teams live and die by their continuous integration. I cannot overemphasize this! Consistent, effective investment in automated testing strategies by the entire team enable agility like no other effort. Using Atlassian Bamboo, teams can stay on top of build breakages, and ensure that automated tests are running in top condition. When the build breaks, everyone suffers. And when the build succeeds, everyone wins.
Ask your Jira admin to configure the Bamboo plugin for Jira to make the Bamboo Plans gadget available. A few other Bamboo and build-related gadgets come with it, too!
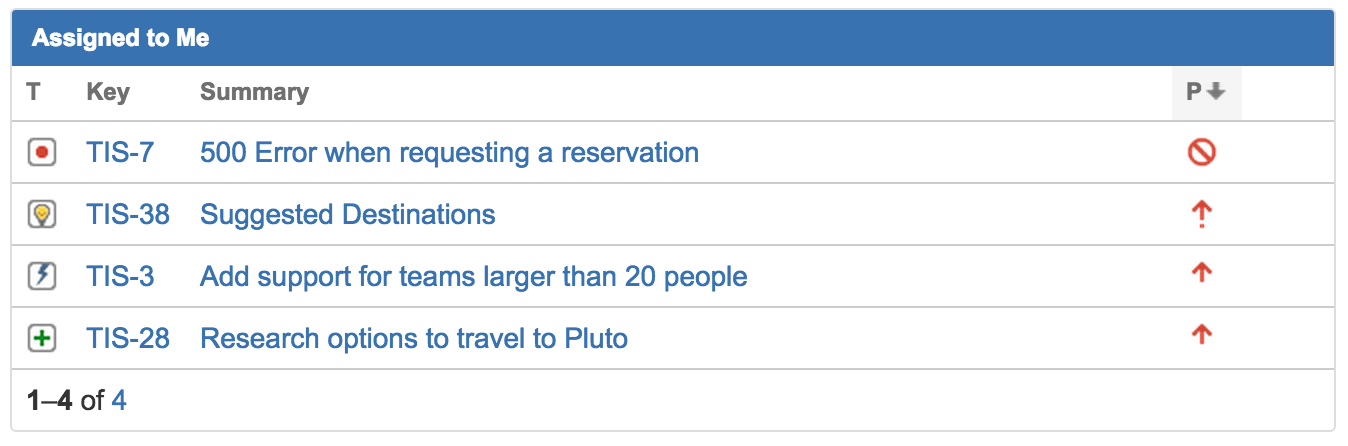
6: The Assigned to Me gadget
Some teams like to assign out work at the sprint planning meeting, and often times someone creating an issue will assign it to a specific team member right off the bat. You can use the Assigned to Me gadget so that each team member gets a gadget listing their work. Setting this gadget up is as easy as it gets. Just add it to your dashboard, leave all the default settings in place, and save it. Boom.
7: Level up
Teams don’t live alone. You can extend your dashboard to include data from multiple teams. Need to track multiple scrum teams together? Use several instances of the Sprint Health gadget alongside the Agile Sprint Burndown gadget to get a quick overview of how all teams are progressing towards a common goal.
So there you have it! Use the tips here as a starting point, and remember that this is an agile dashboard: iterate, iterate, and iterate again until you get it just right ![]()
Have more questions about creating dashboards? Ask them on the Atlassian community!