

If you’re hosting on AWS, you can expect some pretty excellent reliability and availability.
If your service isn’t responding, it’s likely an issue with your own code. On the other hand, system outages do happen. They’re usually pretty minor.
Sometimes, they’re not.
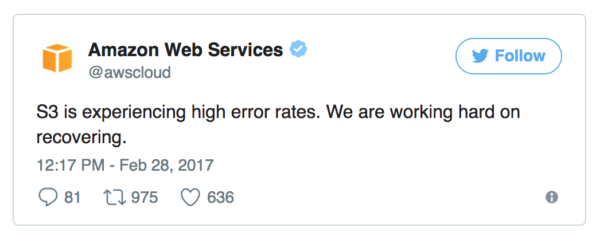
While AWS is the largest cloud provider and boasts excellent reliability, the service still experiences downtime. On Feb. 28, 2017, a US region of Amazon’s heavily-used S3 storage facility went dark for the better part of 4 hours. As a result, major organizations across the web experienced total or partial outages, including Quora, Medium, Imgur, Twilio, MailChimp, and many more.
This is our best attempt at a guide on actively keeping yourself in the loop for AWS system status. When incidents like this happen, it’s helpful to know how AWS thinks about reporting system-wide status, and what you can do to keep yourself updated.
Whether you’re a developer building on AWS, or a journalist or analyst keeping in the know on the web’s largest cloud provider, this guide aims to help you understand AWS status a little better.
AWS System Status vs. Instance Status
It’s important to start with understanding the difference between checks for system status and instance status. Here’s how AWS defines each, according to its official documentation.
INSTANCE STATUS:
Monitor the software and network configuration of your individual instance. These checks detect problems that require your involvement to repair. When an instance status check fails, typically you will need to address the problem yourself (for example, by rebooting the instance or by making instance configuration changes).
SYSTEM STATUS:
Monitor the AWS systems required to use your instance to ensure they are working properly. These checks detect problems with your instance that require AWS involvement to repair. When a system status check fails, you can choose to wait for AWS to fix the issue, or you can resolve it yourself (for example, by stopping and starting an instance, or by terminating and replacing an instance).
Put simply, it’s the difference between your particular instance having an issue (likely unique to you and a task for you to find and debug) and the overall system or hardware having an issue (likely caused by AWS and an issue requiring attention on their end).
Since most issues with system status are up to Amazon to locate and fix, AWS even includes a “Contact Us” link to file a ticket through the status page. As it’s described on the page:
“If you are experiencing a real-time, operational issue with one of our services that is not described below, please inform us by clicking on the “Contact Us” link to submit a service issue report.”
Here are the examples AWS provides of possible causes for system status failure:
- Loss of network connectivity
- Loss of system power
- Software issues on the physical host
- Hardware issues on the physical host that impact network reachability
There are plenty of guides out there on monitoring your unique instances (good ones here, and here). For the purposes of this guide, we’re going to be talking about the page for system status.
Anatomy of the AWS system status page
AWS uses a custom status page to display real-time and historic status information across dozens of its core services and data centers around the world.
AWS launched their status page, or Service Health Dashboard, back in 2008. Read the original AWS blog post where they discuss the page here.
Amazon also runs similar pages for other services, like Marketplace Web Services and Mechanical Turks.
In 2016, AWS announced another status tool, the Personal Health Dashboard. We’ll discuss this more below. The Personal Health Dashboard is, like the name suggests, a more customized system for monitoring status.
Note: Not everyone who monitors status is an engineer. If you know your team is building on AWS, and want to stay up to speed when incidents are ongoing, get to know what AWS products your code is running on. Similarly, if you don’t have code running on AWS, but maybe you just want to keep up with big “the internet is broken” events, get to know these two AWS services: S3 and EC2. These are two of the most popular and critical services used by a ton of web companies to host data and code. In other words, when one of these has an issue it’s usually a pretty big deal.
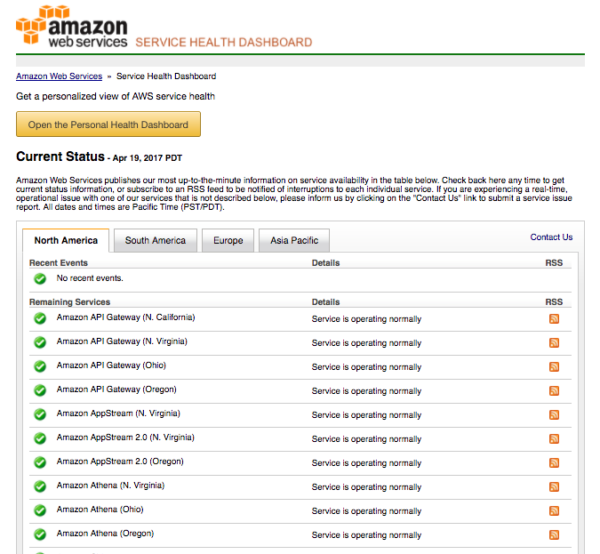
The AWS status page is divided into two main sections: Current Status and Status History.
Current status
Current status is where the traditional color-coded icons live. The page offers three states of operation — operating normally, performance issues, service disruption — along with an optional informational message icon.

The Current Status section also includes links to set up an RSS feed for individual status updates. More on this below.
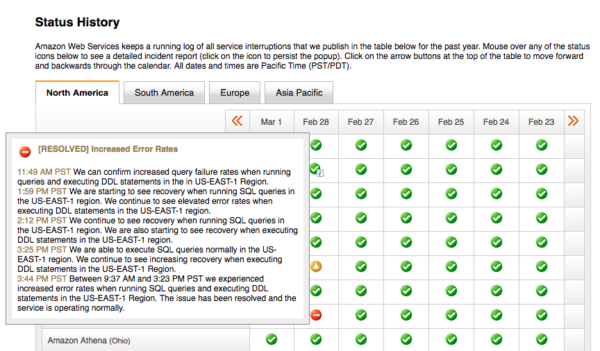
Status history
The Status History section is where AWS keeps a running log of service interruptions published in the last year. Services are broken down by region depending on where your servers are based. For more detail on regions, Amazon breaks down their various regions and availability zones on this page.
Mouse over any incident icon to see the detailed updates published with each incident.
Subscribe to incident RSS feeds
Amazon publishes a unique RSS feed alongside each service status. These feeds push out the real time status updates, which can be monitored and tracked in an RSS reader or RSS integration of your choice. Click the orange RSS icon in the row for a specific status to capture the URL for that feed. By default, all updates for each service status are published into the RSS feed.
Creating status notifications
Like any RSS feed, you have a lot of different options on how you want to subscribe to updates on the feed. There are plenty of popular RSS aggregators out there (RIP Google Reader) if you just want to build a passive feed you can check when you suspect there may be an incident.
But the real power of a status update comes when you dial in some custom notifications. Whether it’s an email, ChatOps alert, or something else. Here’s a look at a few simple ways you can turn these otherwise-passive RSS posts into an outgoing alert that will notify you when incidents are underway.
Most of us have email handy pretty much all the time. It’s fairly simple to set up an integration with the AWS RSS feeds into your email.
Blogtrottr is a free tool that sends updates from an RSS feed to your inbox. Note that their free plan will only check for updates on the AWS feeds once per hour. For a few bucks per month you can get real-time updates.
You can also use IFTTT to set up a simple RSS to Email notification.
Chatops
Chat tools are where we spend most of our working day, and a good place for monitoring RSS feeds. This free Hipchat add-on pipes RSS feeds into a Hipchat room. This Slack add-on lets you send RSS updates into a channel.
Datadog
DataDog is an excellent tool for monitoring metrics and performance across your systems. The team at DataDog released a tool AWS Outage Alerts for monitoring the AWS status page and pinging alerts into your DataDog account.
PagerDuty
PagerDuty is a popular service for alerting the right team members during incidents. Their integration with CloudWatch lets users create triggers in CloudWatch the fire alerts to PagerDuty, which then alerts the right person on-call.
Get to Know the Personal Health Dashboard
In December 2016, AWS rolled out another tool for status communication, the Personal Health Dashboard. The tool aims to supply AWS users with status updates unique to them, and includes a system for notifications.
In their blog post announcing the Personal Health Dashboard, AWS admits their System Health Dashboard leaves users wanting more:
“While the current dashboard is good at displaying the overall status of each AWS service, it is actually impersonal. When you pay it a visit, you are probably more concerned about the status of the AWS services and resources that you are using than you are about the overall status of AWS.”
With the Personal Health Dashboard, AWS aims to give its users a custom look into the performance and availability the service they’re running. Users can use the tool to set up custom alerts and notifications.
Get to know Cloudwatch
Along with the Personal Health Dashboard, another AWS resource worth knowing is Cloudwatch.
Cloudwatch allows developers to set up alarms to notify over email when certain thresholds are met. Read more in the AWS documentation.
Twitter AKA the unofficial status tool
Often times, the primary source for updates to the health of Amazon’s AWS services will be Twitter. It’s a running joke in the cloud dev community that the AWS status page is often the last place to find service updates. In other words, the unofficial conversations often start on Twitter well before AWS is able to get to its status page. Most developers have their own monitoring tooling letting them know first-hand if something is amiss. It’s typical for Twitter to be the next stop to see if others in the community are having issues.
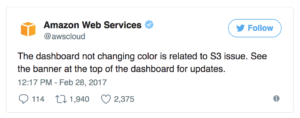
It’s also worth noting that the AWS status page is, no surprise here, hosted on AWS. Like the rest of their services, AWS has been able to keep pretty good uptime with their status page. But occasionally an interruption in AWS service will impact their status site as well. For example, in the February 2017 S3 outage, AWS was unable to move status icons to the red icon because those images happened to be stored on the servers that went down.


Many AWS users took to Twitter to talk about what was going on and what they were experiencing as the event unfolded.
You can also skim through Tweets being sent to AWS through a customer Twitter search (we set one up for you).
The tricky thing about status pages
Status updating can be complicated. Even in small shops running everything on a really simple infrastructure, it can be a tough judgment call on when to flip the indicator over to red. Yes, sometimes it’s painfully obvious. Other times it’s a coin flip.
Amazon probably has the toughest status reporting job in the world. Even one region of one service can compromise 10s of thousands of servers. If 1,000 servers go down, should a component be marked red? What if those 1,000 servers are only 1 percent of that region? What if response times are just a bit slower than usual on those servers, but they’re not completely down?
It’s not easy. And it’s frustrating when services aren’t working but everything is marked green. Plenty of frustrated developers have taken to Twitter to criticize AWS’s status reporting. We empathize with those folks — we’ve been there. We also know AWS has a huge job, and seems to be trying to address this with tools like the Personal Health Dashboard.
Learn more about Statuspage
More and more companies are moving to a dedicated status page for reporting downtime, service interruptions, and scheduled maintenance. Informed users are happy users, happy users give you more slack when things break.
You can build your own status page, or let us do it for you. If you’re using AWS, we’ve already built monitoring of their status page into our network of third-party components. Click here to learn more.
More Resources
If you want to dig deeper into AWS and status reporting, there’s some great writing that’s already been done on this topic as well. Here’s a look at some resources that were helpful in thinking about this topic:
- The Open Guide to Amazon Web Services
- AWS Documentation
- Honest status reporting and AWS service status “truth” in a post-truth world
This post was originally published on the Statuspage blog in 2017.

