
 Everyone knows that Confluence is a great enterprise wiki. At Atlassian, we also use Confluence as our reporting and business intelligence tool for tracking sales activity, monitoring key support metrics and measuring marketing campaigns. We’ve developed powerful techniques to extract and share our company’s information using Confluence, and in this series of posts we’ll share those techniques with you.
What makes Confluence so great for reporting? By combining Confluence’s enterprise features with the ease-of-use and flexibility of a wiki, you:
- Get real-time dynamic data. When you hook Confluence up to your database via JDBC, the reports show the changes to your data in real-time.
- Express data visually. Make sexy charts with one line of wiki markup. Stack them into sexy decks with another line.
- Empower people. Anyone can create or edit a report. If someone has a great idea, they can make it happen.
- All revisions preserved. Versioning is constant and automatic. When someone’s great idea mangles the sales report, it’s easy to restore the latest good version.
- Simple. All you need to do everything in this HOWTO is Confluence and a few free plugins.
- Inexpensive. For the price of a Confluence license you get not only a great wiki, but a great business intelligence system too.
- Easy to deploy. Client requirements = A web browser.
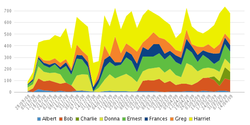
Here are some examples of what you’ll be able to do:
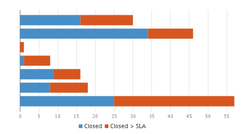
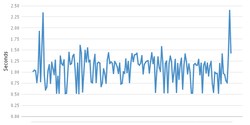
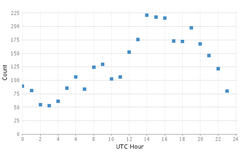
In the coming posts we’ll cover:
- Getting your data from wherever it is;
- Formatting reports to acheive concise sexiness;
- Some ways to optimize your queries;
- Creating face-meltingly awesome dynamic reports…Part 1 and Part 2;
- How to keep your precious data secure; and
- Give you a library of examples and tips to help you on your way.
After you’re done, you’ll be able to use the same techniques that we use at Atlassian to build your own information dashboards and reports.
Read the Confluence Reporting HOWTO online at http://confluence.atlassian.com.
Intended Audience
Creating reports and data dashboards in Confluence isn’t as hard as, say, calculating the airspeed velocity of an unladen swallow. But we do assume that you:
- Have Confluence set up and running in your company. If not, set up a free trial and follow along.
- Know structured query language (SQL). If you don’t, then SQLzoo.net is a great place to get started learning.
- Know where your company’s data is kept and how it’s organized. (or at least know WHO to contact for this information)
Stay tuned for the next installment by subscribing to the Confluence news feed here ![]() .
.
About the Authors
- Jim Severino is in Atlassian’s Internal Systems group. When not mediating on business intelligence, Jim spends his time managing projects, building tools and playing Set. Contact Jim at jseverino@atlassian.com or just tap on the window of our Sydney office.
- John Rotenstein is Jim’s boss. He taught Jim everything he knows, except for the wrong bits and anything that causes mistakes.