At Atlassian, we know that our products are critical for your software, IT, and business teams. We also know you rely on a host of other tools alongside ours. All these apps generate enormous amounts of data, and teams need ways to turn this data into insights that power decision-making.
To simplify data-driven decisions for your teams, last year we announced the beta for Atlassian Analytics. Since then, we’ve been fine-tuning these capabilities with input from hundreds of customers, and today we are excited to share that Atlassian Analytics is now generally available and included with Cloud Enterprise plans for Jira Software, Jira Service Management, and Confluence.
Getting to know Atlassian Analytics
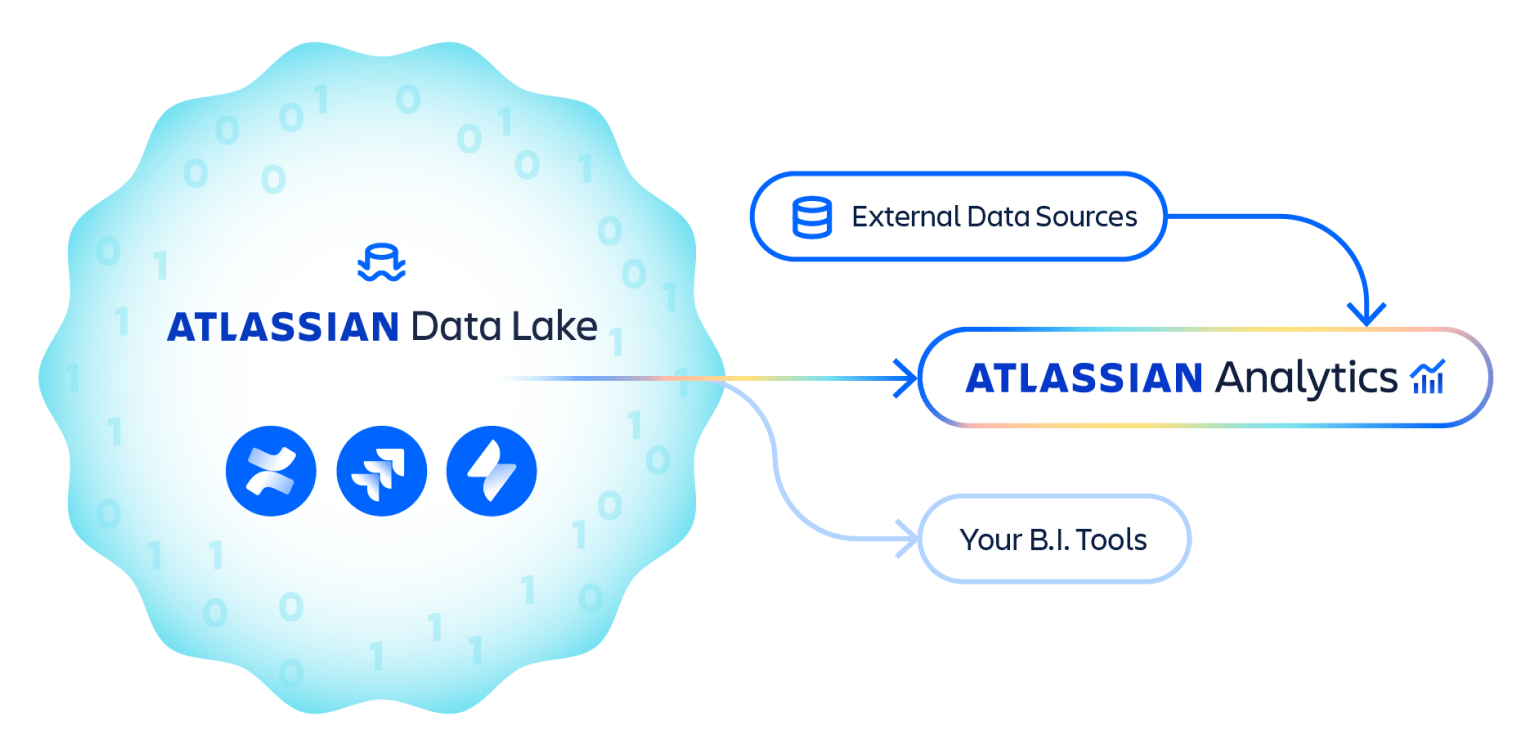
Atlassian Analytics comes with:
- Atlassian Data Lake, a single source of truth for Atlassian data across software, business, and IT workflows
- 20+ out-of-the-box dashboard templates including flow metrics, content adoption, and developer productivity insights
- Flexible low-code/no-code capabilities with visual mode querying and chart templates
- Connections to Snowflake, Amazon Redshift, Google BigQuery, and other databases so you can incorporate key external data and map work output to results
- Ease-of-use features including advanced chart controls, querying options, permissioning capabilities, and new sharing functionality
What can teams do with Atlassian Analytics
With Atlassian Analytics your teams can truly understand the flow of work between development, IT, and business processes:
- Development leaders can optimize their organization’s engineering velocity, improve quality and identify issues that need attention at all levels of altitude with detailed dashboards for metrics like lead time, cycle time, and throughput.
- IT operations and support teams can proactively spot and fix bottlenecks by leveraging out-of-the-box dashboards for request management, incidents, changes, and service performance.
- Business team leads can optimize spend and efficiency across programs by mapping the impact of marketing deliverables to sales pipeline and spend efficiency stored in external databases.
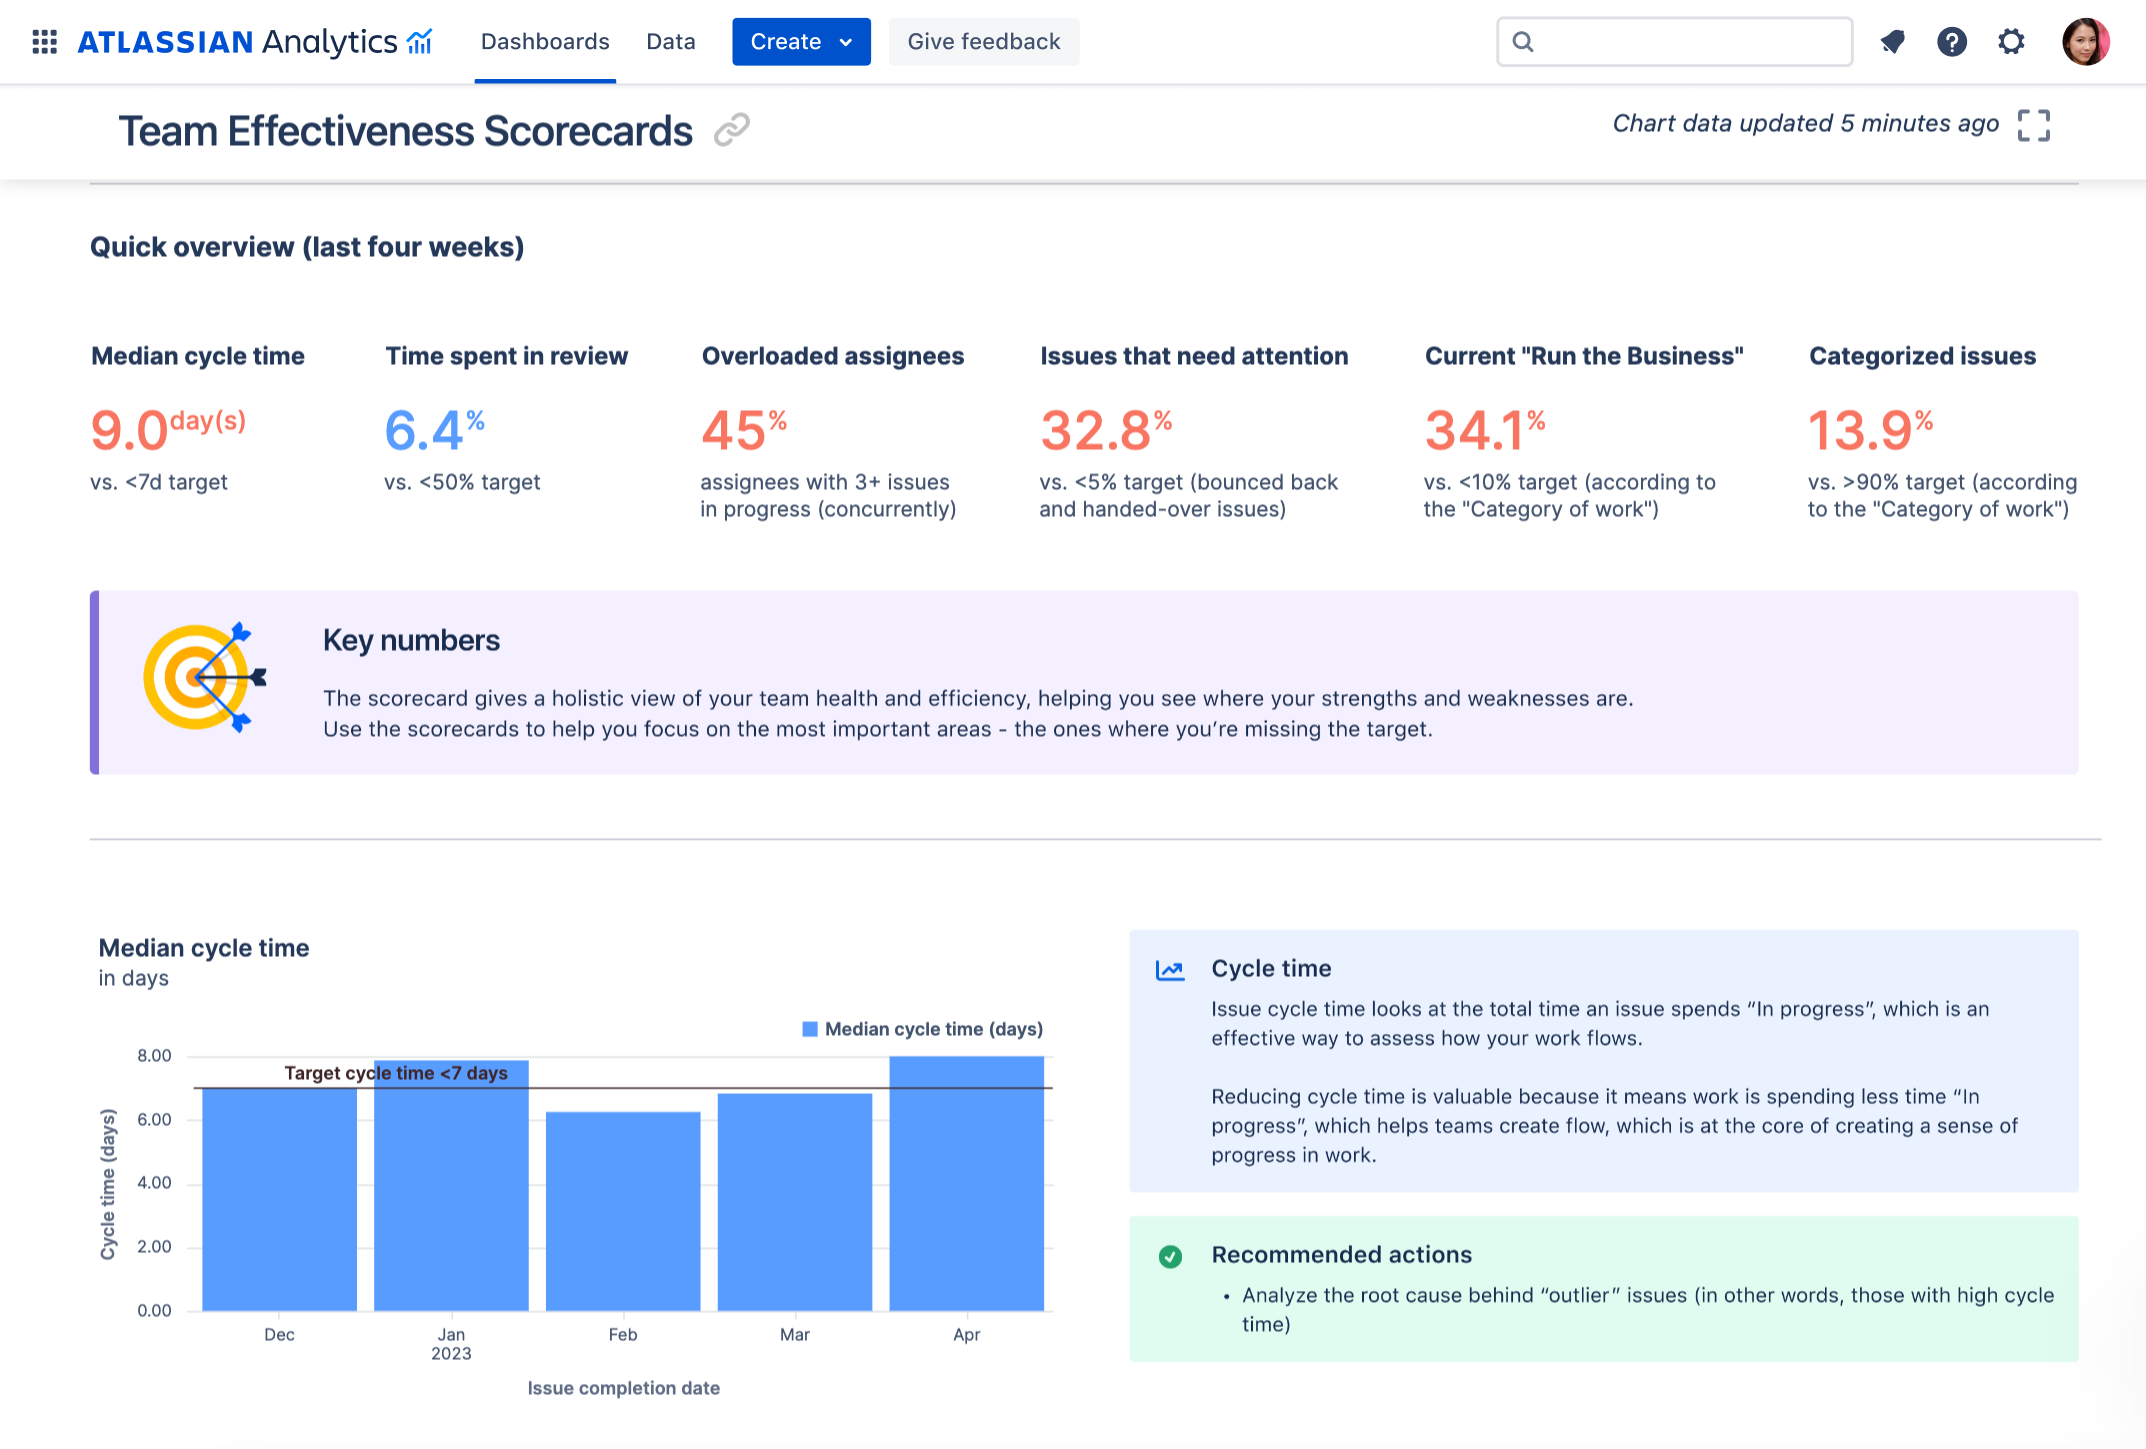
Understand performance and health across your engineering organization
Data ≠ insights. That’s why we’re introducing new dashboards with prescriptive scorecards that give engineering leaders better visibility into flow metrics from the team to the organizational level. Leaders can customize insights on velocity and performance to match their organization’s exact way of working.
Teams can already track metrics at the team level in Jira Software. Now, with Atlassian Analytics, you can build reports across multiple Jira projects and/or instances to report on key metrics including lead time, cycle time, flow efficiency, and more.
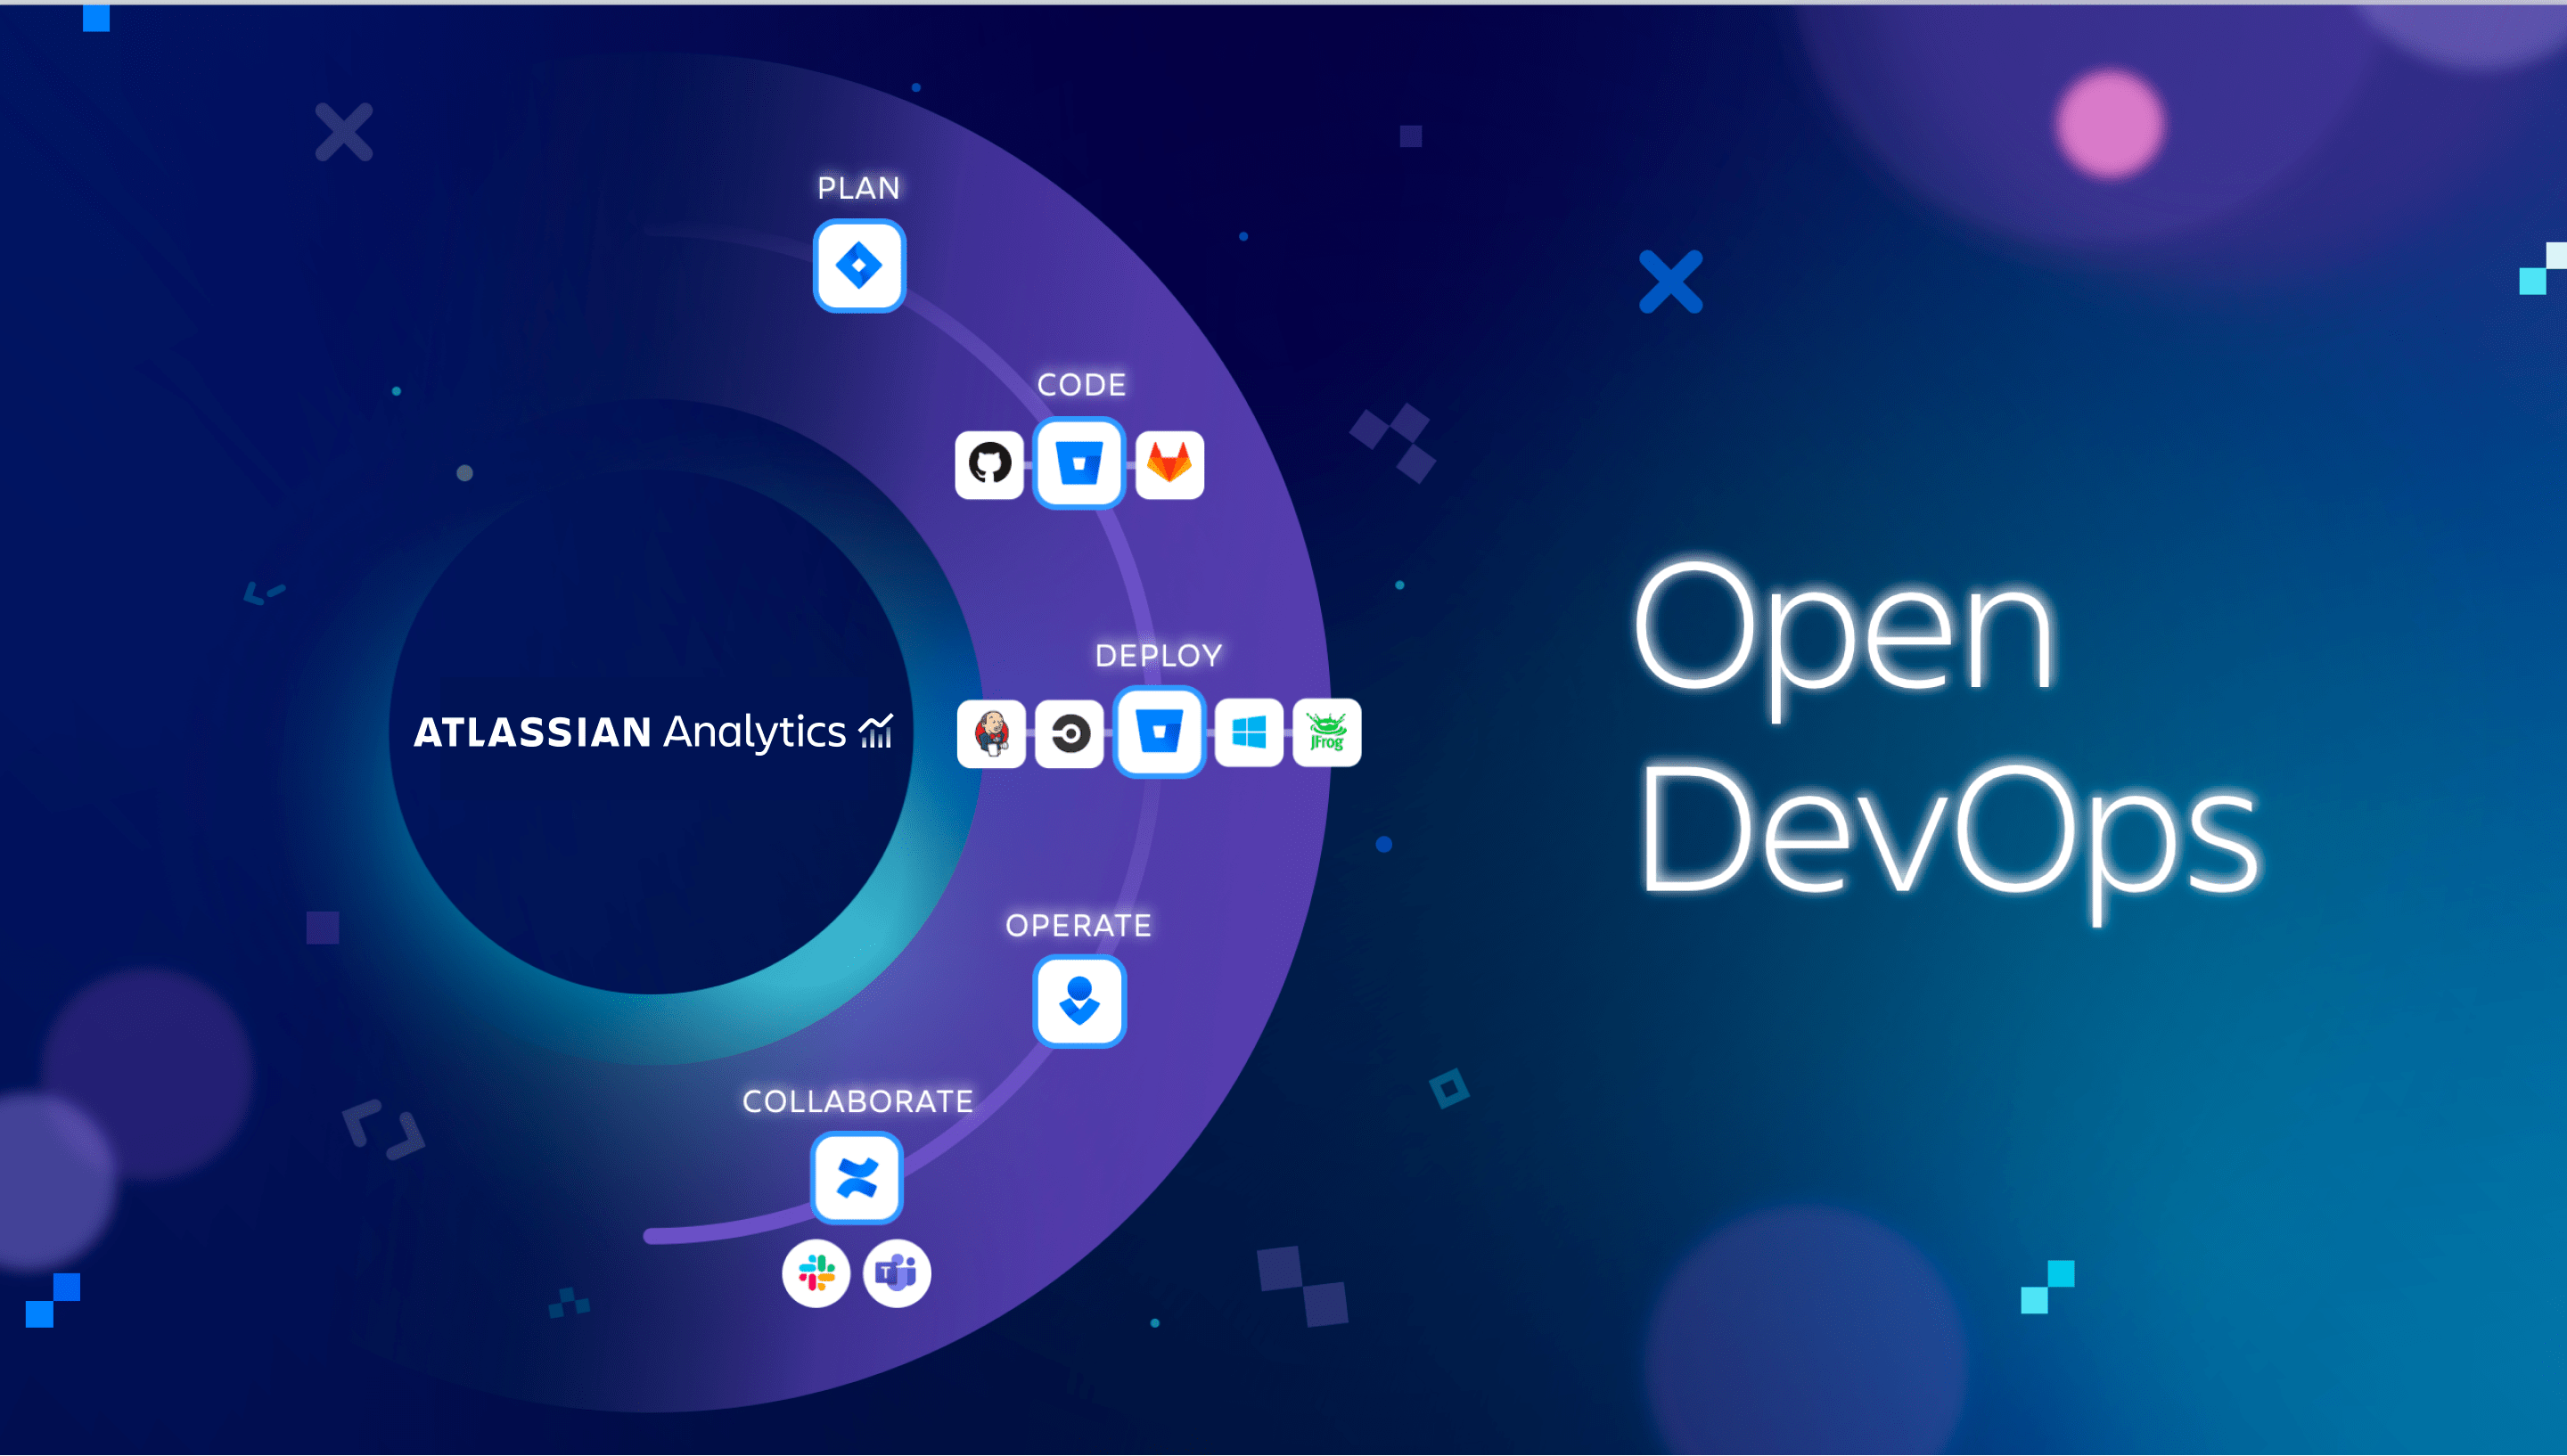
In the coming months, Atlassian Analytics will connect to more of the DevOps toolchain, including data from external tools covering SCM, CI/CD, feature flagging, DevSecOps, and more. This will unlock reporting on DORA metrics across the engineering organization, and the ability to drill down into custom reports on health and performance across teams.
Access to more data across the DevOps toolchain will help leaders identify issues, improve velocity, deliver more value, and make better decisions for their business.
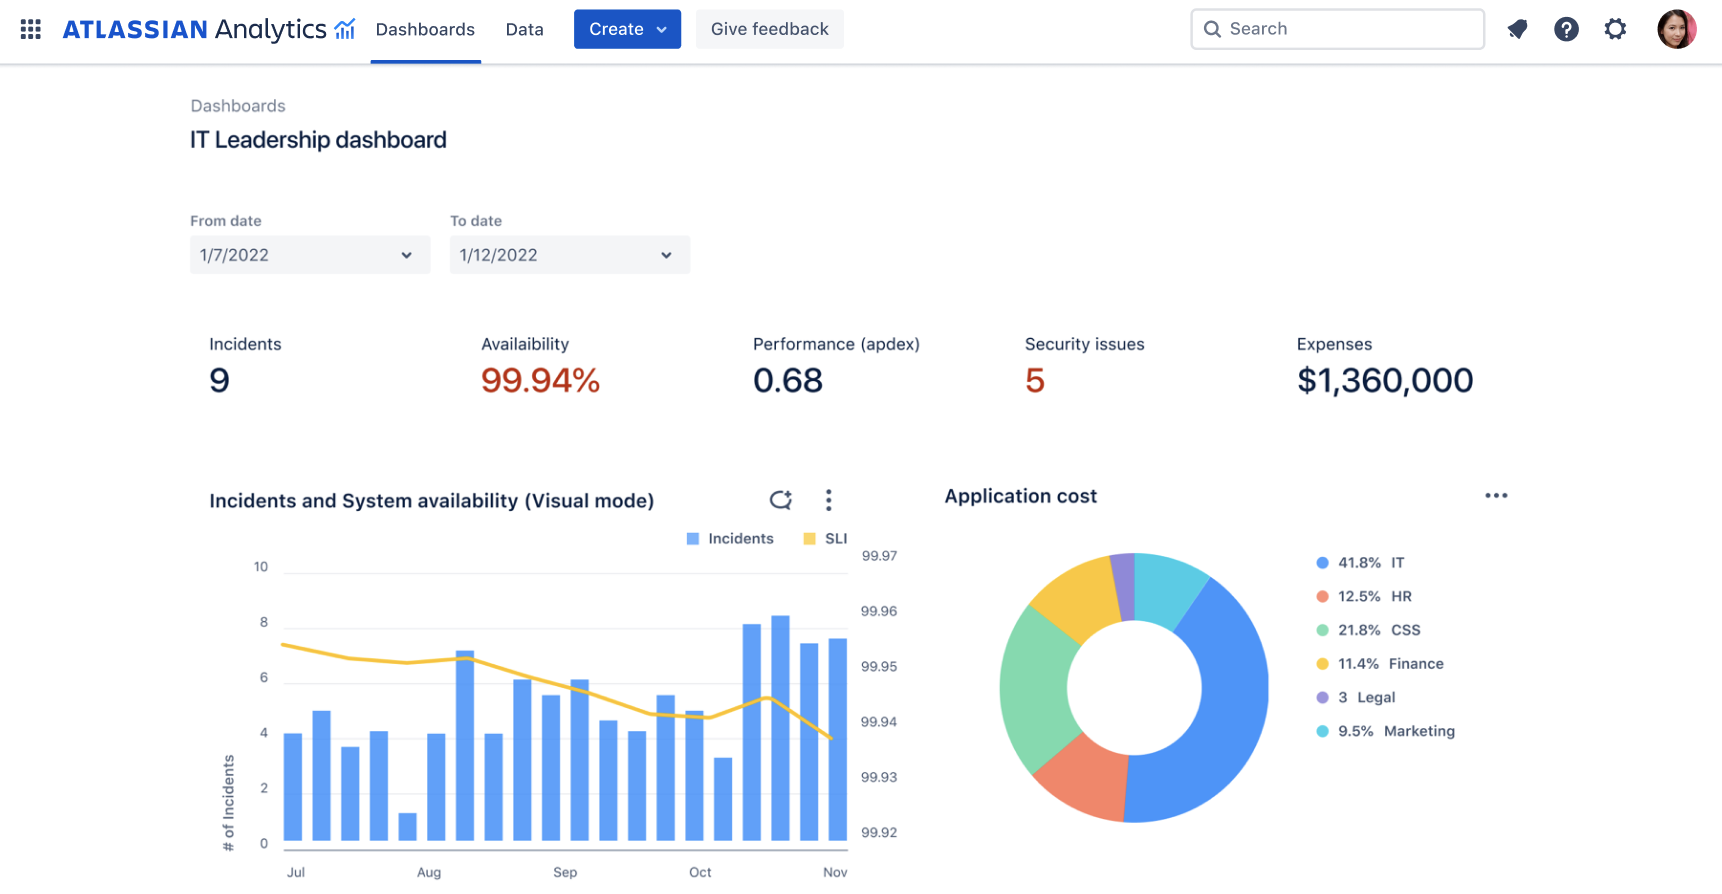
Richer insights for both IT operations and support teams
Traditional ITSM tools give IT operations teams half of the picture, with insights gleaned from just their ops tools. Atlassian Analytics gives you the full picture. By combining data from both dev and ops tools, your team has richer insights to make better decisions around changes and incidents. Now, service owners can view all their services-related data in one dashboard, including incidents associated with services, related deployments, costs, and much more.
Database connections to AWS and Snowflake make it much easier to understand the true costs of service delivery. Support teams can also create unified views that track agent workloads, resolution times, customer satisfaction, and performance against SLAs. And I&O leaders can easily keep tabs on the state of the business, with dashboards that track the overall performance of business services as well as quarterly trends.
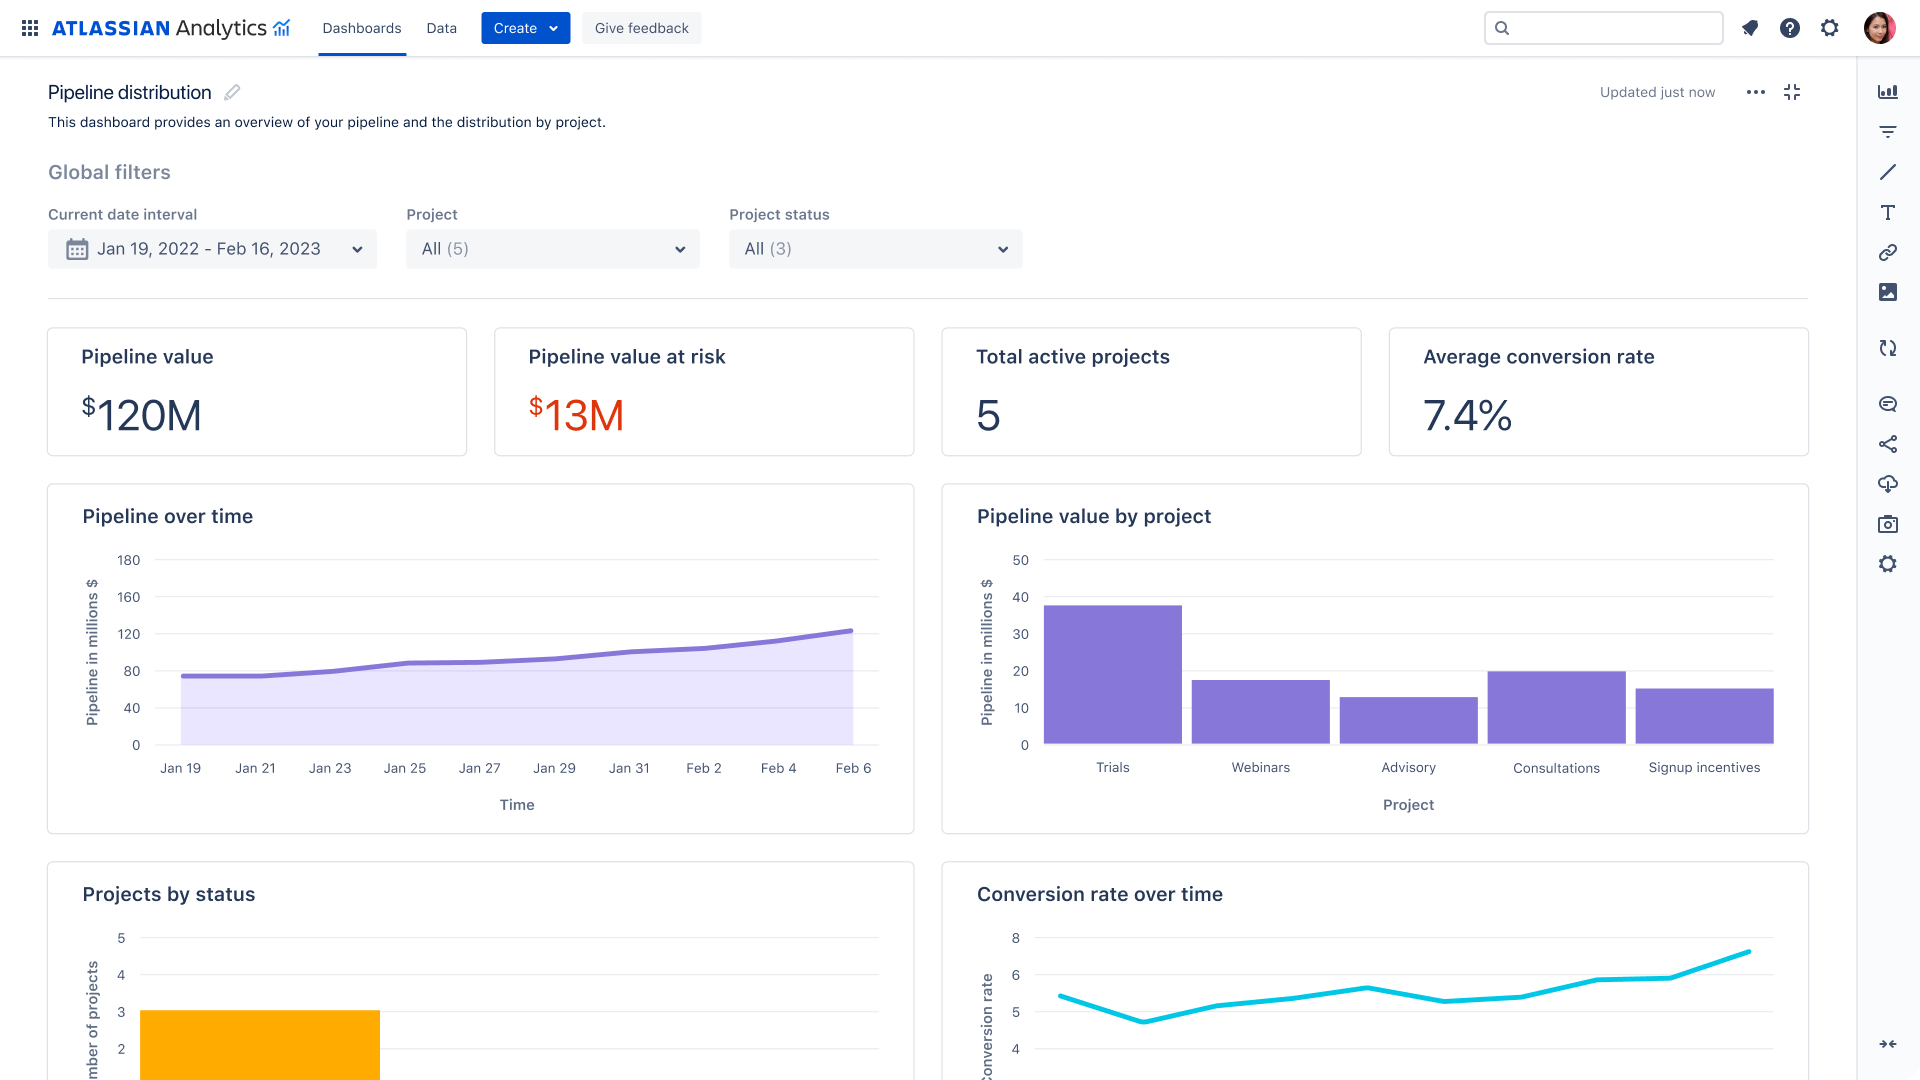
Map the impact of marketing programs to pipeline and spend
Atlassian Analytics lets you blend project data from Jira Work Management, Jira Software, and Jira Service Management into a holistic program dashboard for insights on marketing effectiveness. Your team can use connectors to commonly used databases like Snowflake to map those programs to pipeline and spend information.
Marketing leads can see the distribution of pipeline-generating projects completed, in progress, and at-risk alongside the pipeline cost of at-risk projects.
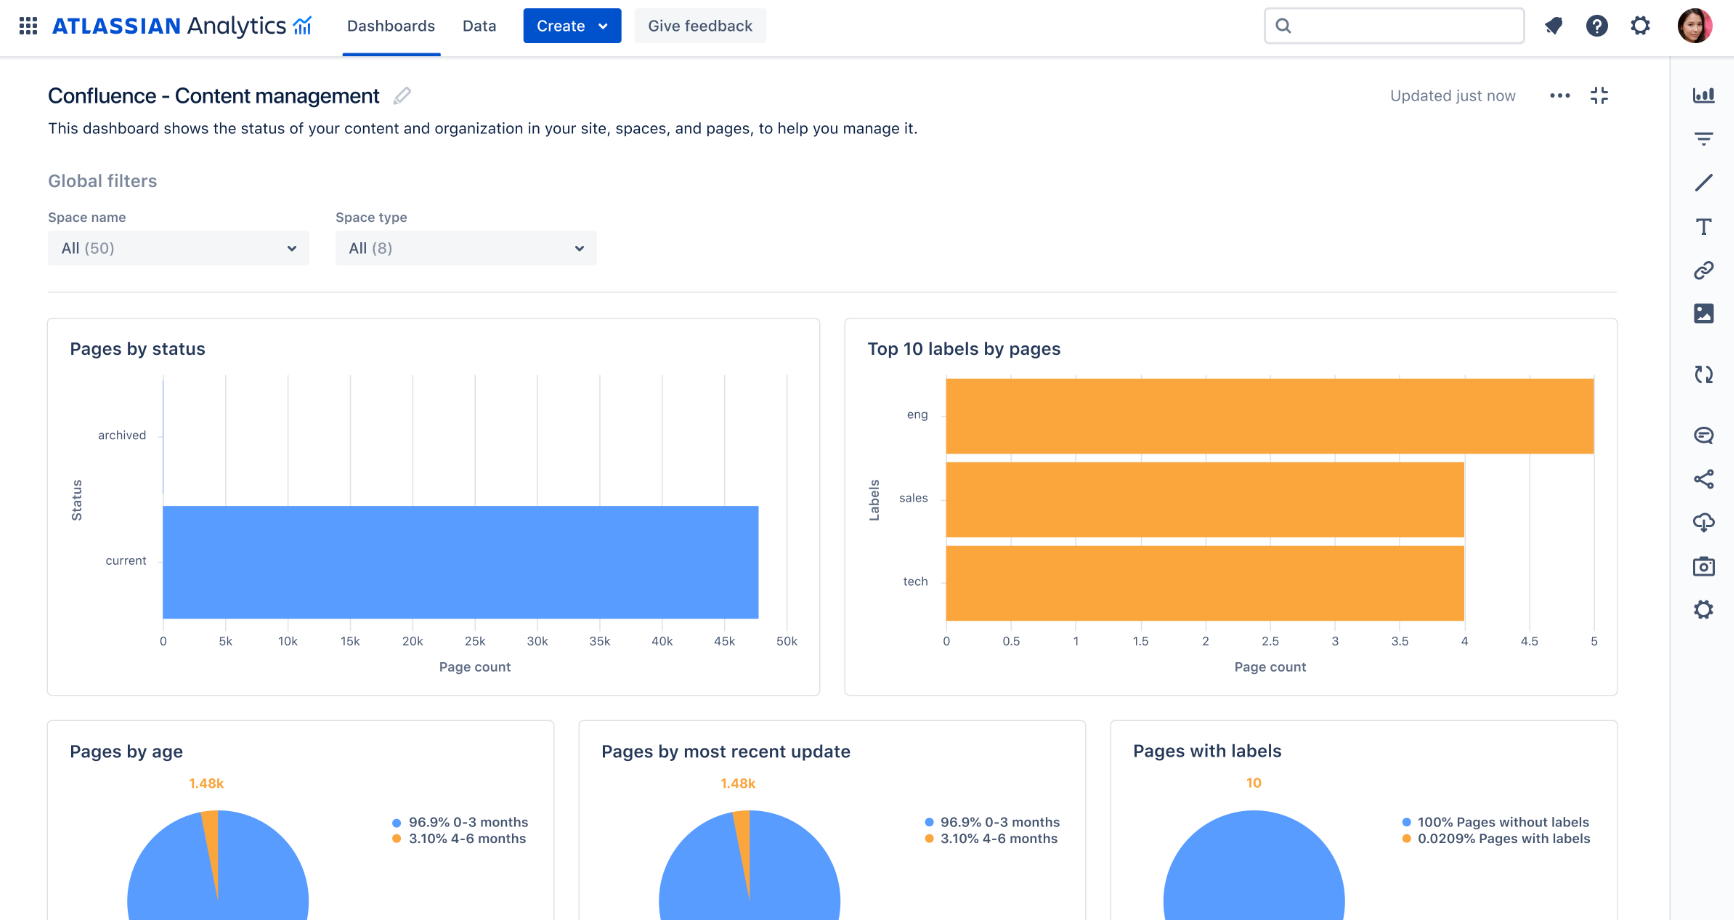
Additionally, with Confluence data in the Atlassian Data Lake, Confluence admins can track key metrics to understand the usage of spaces, pages, and more.
A part of our connected data foundation
The general availability of Atlassian Analytics and Atlassian Data Lake is a step towards unlocking the full value of your Atlassian data with a connected data foundation. We see a future where connected teams and connected data exist in harmony. Now more than ever, data is key to unlocking the potential of every team. The power of artificial intelligence for teams depends on quality data, which is why we’re excited to introduce Atlassian Intelligence, which leverages AI through our internal models and partnership with OpenAI to bring this transformational technology to our full suite of cloud products.
Ready to get started with Atlassian Analytics?
Contact us about Cloud Enterprise editions of Confluence, Jira Software, or Jira Service Management for access to Atlassian Analytics and Atlassian Data Lake.