Diversity and inclusion at Atlassian
Atlassian's mission is to unleash the potential in every team – including our own. To that end, when we released our first diversity report last year, we focused on diversity at the team level – because we believe that teams perform better when individuals have access to perspectives different from their own. We also knew that it would give us a better understanding of the representation of many groups at Atlassian, an important first step to help us improve.
This year, as we launch our second diversity report, we want to be as open as possible. We want to share our journey over the past year, which includes both our successes and where we've come up short. That also means sharing what we've learned and the commitments we're making as our next steps on this journey. Perhaps the greatest lesson we've learned is that there is no playbook that describes the steps to solve issues of systemic exclusion. To build the version of Atlassian we want to see, we'll need to borrow a bit from how our software teams craft products: measure, experiment, learn, iterate. This isn't about achieving a single set of objectives in a single year, but about raising the bar a bit higher every day, every quarter, every year, and every decade.
Before we talk about our next iteration, let's look at the year we've had.
Failing our own expectations
Our first shortcoming was failing to improve the overall percentage of underrepresented minorities (URM) in our U.S. offices during our continued rapid growth – this is true across all roles, and for new hires in many of those categories too. The truth is, we didn't prioritize hiring volume for URM candidates in our U.S. teams this past year because we prioritized internal initiatives focused on inclusion first. As an Australian company with a workforce mostly based outside of the U.S., our team members were significantly less familiar with experiences and historical context of American racial identities. Frankly, we think this was the best choice to support our hiring efforts in the long run.
We did, however, see a slight increase in representation for people of color on most teams, which tells us that while overall representation hasn't moved, the number of teams experiencing new types of diversity has increased.
Second, we haven't yet developed a strong, direct signal of inclusion specifically for teams. Our team diversity data suggests where inclusion is a challenge for us, but we don't feel it's specific enough. For example, we have low representation of women in technical roles, yet most of our software teams have at least one woman on them. This suggests many of these women are likely the only woman on their teams, and therefore may be struggling with a sense of belonging.
Where we've seen progress
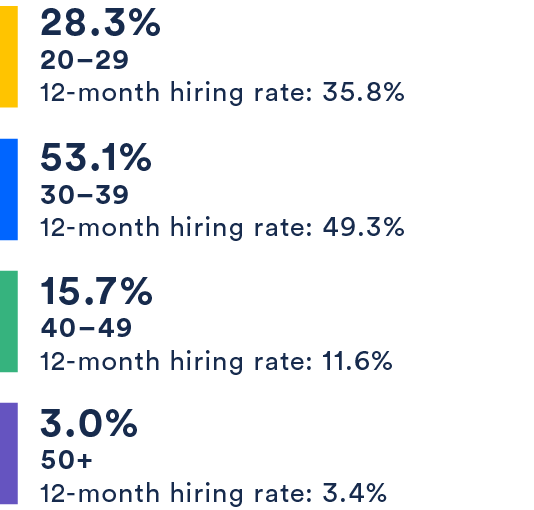
We’ve seen indications of progress over this past year. The representation of women improved across every category – overall, technical, non-technical, and leadership positions – and women represented 32% of all hires over the past 12 months, including 36% of leadership hires. Similarly, 56% of this year's Gradlassian class (incoming tech grads to our Sydney office) were women – noteworthy given women represent just 13% of technical degrees granted in Australia. We saw a similar uptick in the representation of more senior Atlassians as well. Almost 19% of Atlassians are older than 40, an improvement from 15% a year ago.
Last year, our team-level data helped us identify where our investments would make the largest difference, and guided which initiatives we prioritized. Here are the key investments we made:
- Strengthened standards within our interview process: We implemented a more structured interview process to minimize potential biases toward people who are different from the interviewer. This included shifting our candidate evaluations from "Culture Fit," which can lead to unconscious bias or selecting candidates who are the same as the interviewer, to focus instead on “Values Fit,” which evaluates based on work styles and candidates' alignment with Atlassian's core values of openness, balance, empathy, and initiative.
- Implemented the "diverse slate approach" (i.e., Rooney Rule) for executive and board-level roles: We required a diverse set of candidates be interviewed for executive positions, and as a result, three of the last open C-level and board positions were filled by women, and two by people of color.
- Career growth and community beta tests: We launched a variety of beta programs designed to provide greater cross-team connections and professional growth opportunities for underrepresented Atlassians. We also created more dialogue about axes of diversity that are often missed: religion, geography, mental health, parental status, and more.
- Trialled new professional development programs: We launched a senior technical mentorship initiative, a program for emerging women leaders, and an apprenticeship pilot program for Black, Latina, and Indigenous women, which have shown promising results. We’ll focus on providing greater access to opportunities like these over the coming year.
This year, we've found that our team-level reporting has helped us have a more accurate (if less flattering) view of our progress. While our overall numbers across multiple groups improved throughout our rapid growth, we didn't see a corresponding growth in some types of team diversity. To put it another way, this approach made sure we didn't overestimate our progress, which gives us a stronger understanding of where we should make investments to improve over the next year.
What we're doing
A team-level approach gives us a better understanding of whether Atlassians are working with people different from themselves on a regular basis. We're proudly committed to reporting on and increasing team-level diversity at Atlassian, but we need to iterate further by fostering not just diversity, but also belonging at the team level. We're confident that it's one of the best signals for determining the quality of Atlassians' work experience and whether they will stay at Atlassian. We need to get this right.
After reflecting on our shortcomings, we recognize where we need to do more. In the spirit of working transparently, we want to share our commitments with you. Over the next year, we’re committed to:
- Implementing the "diverse slate approach" for new hires director-level and above: We already implemented this for executive roles, and it’s working. Research also suggests this will foster a stronger sense of belonging for a more diverse group of mid- and junior-level Atlassians, as they’ll have role models they can more closely identify with.
- Benchmarking team belonging metrics and releasing these metrics in next year's report: Coupling our team diversity data with a stronger understanding of whether Atlassians of all backgrounds feel more welcome and comfortable than in years past will allow us to see the fuller picture, identify root causes, turn insights into meaningful action, and proactively address gaps.
- Introducing intersectional data in next year's report: We recognize issues of identity (e.g, gender, race, age, etc.) are interrelated and can overlap, and people who fall into multiple categories face unique privileges and challenges. We’ll focus on pushing dialogue and measurement for many of these categories over the next year and on releasing those metrics publicly.
Where we all need to go, as a team
Overcoming decades of tech industry "truth" about talent, potential, and who belongs requires a huge paradigm shift, and one that we need everyone on board with – from executives to interns, and from people in majority groups to those in underrepresented ones. The key is to provide opportunities for all to learn how diversity makes them stronger contributors and how to be the most inclusive version of themselves. Education is the key to making our diversity and inclusion efforts stick.
For Atlassian, that means creating spaces where underrepresented or marginalized people feel they have a voice. It means fostering a culture that encourages meaningful discussions and opportunities for education, and in investing in these areas as transparently as we can. It means finding ways for people to connect through their shared identities and providing opportunities for employees to see their differences as a value add: turning what could be “us vs. them” into “we.” But it also means that all Atlassians have the power to decide how they treat their colleagues, so it’s up to every one of us to make our teammates feel like they belong. And this is important, because our own research shows it’s individuals more than companies who have the most power to create change.
No one company is going to solve our industry's inequities either; this must be a team effort. We need to create space for honest reporting of failures and learnings and constructive dialogue that respects the dignity and accomplishments of all of our teammates. Our hope is that by being open in sharing our learnings, especially where we've fallen short of our ambitions, we can help others struggling with the same issues. Only by sharing and working together can we as an industry begin to see the step-change we all so fiercely want.
Together, we can change the face(s) of our industry and ensure that everyone has the opportunity to build the future.
- Mike Cannon-Brookes, Scott Farquhar, Aubrey Blanche, and Helen Russell
2017 Team diversity highlights
| DEPARTMENT | TOTAL TEAMS | 1 OR MORE IN SYDNEY | 1 OR MORE WOMAN | 1 OR MORE PERSON 40+ | 1 OR MORE BLACK / AFRICAN AMERICAN | 1 OR MORE HISPANIC / LATINX |
|---|---|---|---|---|---|---|
| Customer Support | 16 | 50% | 100% | 93% | 30% | 50% |
| Finance | 10 | 71% | 100% | 86% | 0% | 20% |
| HR | 5 | 28% | 100% | 100% | 0% | 25% |
| IT | 13 | 31% | 62% | 77% | 10% | 10% |
| Legal | 5 | 67% | 67% | 100% | 0% | 0% |
| Marketing | 28 | 19% | 89% | 67% | 17% | 17% |
| Software | 108 | 79% | 66% | 72% | 6% | 22% |
| Company | 185 | 65% | 74% | 76% | 11% | 23% |
Data excludes “teams” of one. Race data only available for U.S.-based team members.
Have questions about our data? Check out our methodology here.
2017 Team averages by department
Stats represent average percent per team within each department. For example, the average team in IT is composed of 7 people, 20% of whom are women, 28% are 40+, etc.
| DEPARTMENT | TEAM SIZE | SYDNEY | WOMEN | AGE 20-29 | AGE 30-39 | AGE 40+ | PEOPLE OF COLOR |
|---|---|---|---|---|---|---|---|
| Customer Support | 20 | 10% | 32% | 27% | 50% | 23% | 16% |
| Finance | 9 | 25% | 66% | 26% | 51% | 23% | 35% |
| HR | 22 | 28% | 66% | 29% | 54% | 29% | 21% |
| IT | 7 | 28% | 20% | 20% | 53% | 28% | 35% |
| Legal | 4 | 15% | 50% | 0% | 40% | 60% | 21% |
| Marketing | 9 | 3% | 38% | 28% | 52% | 20% | 32% |
| Software | 12 | 68% | 15% | 30% | 54% | 16% | 30% |
| Company | 12 | 46% | 27% | 28% | 53% | 19% | 30% |
Data excludes “teams” of one. Race data only available for U.S.-based team members.
Have questions about our data? Check out our methodology here.
2017 Company stats
Have questions about our data? Check out our methodology here.
Women in the workforce

12-month hiring rate: 32.3%

12-month hiring rate: 18.0%

12-month hiring rate: 58.0%

12-month hiring rate: 36.0%
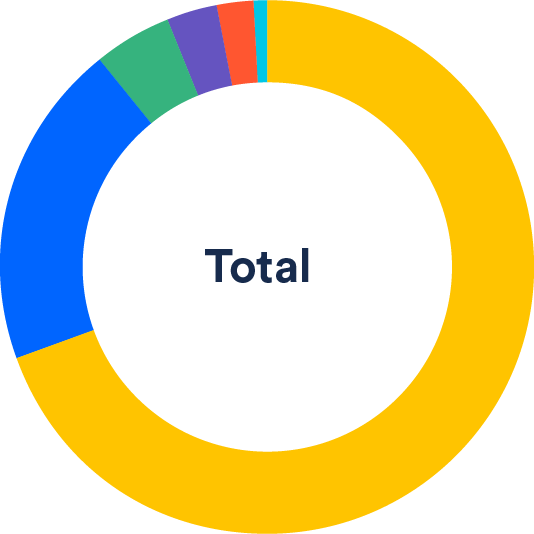
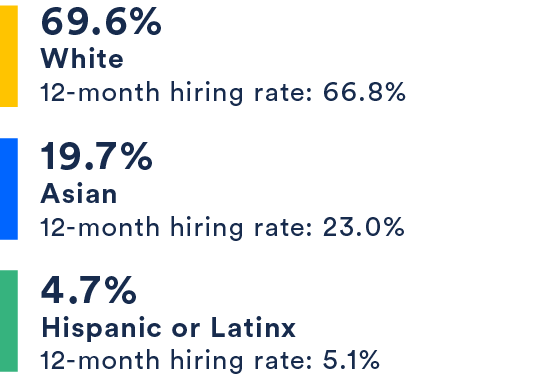
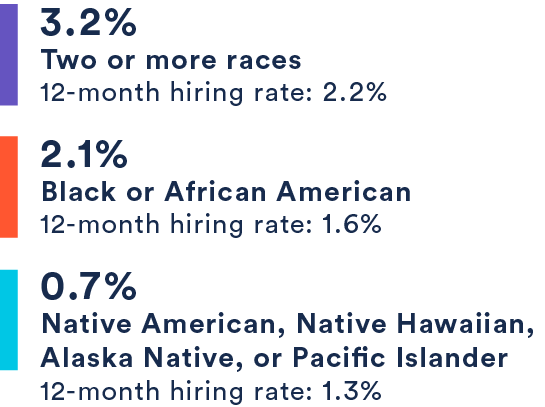
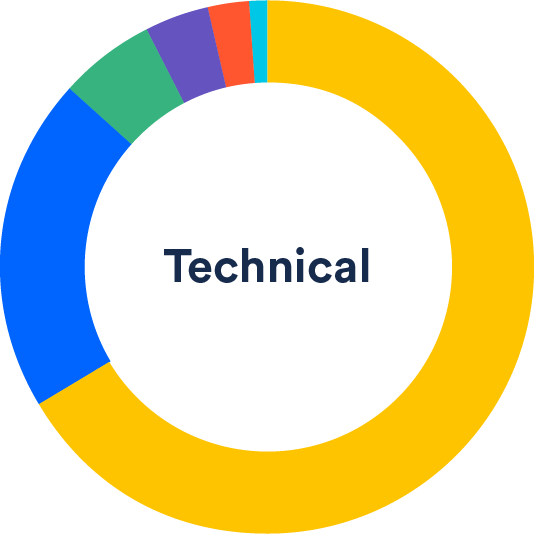
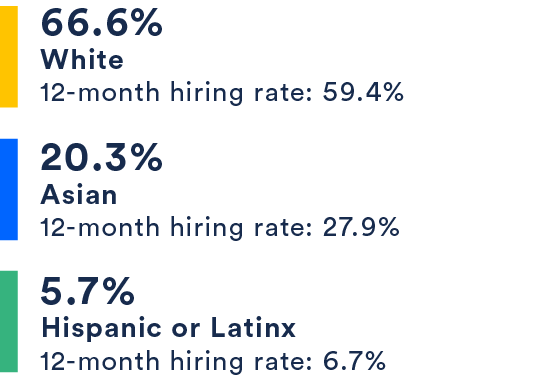
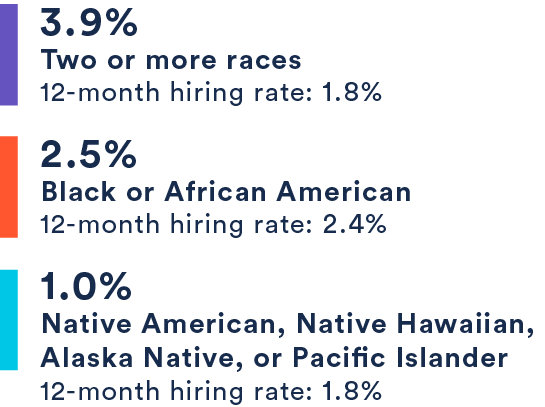
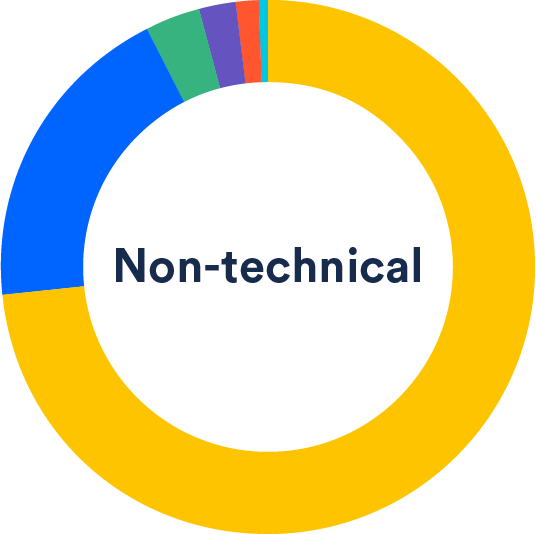
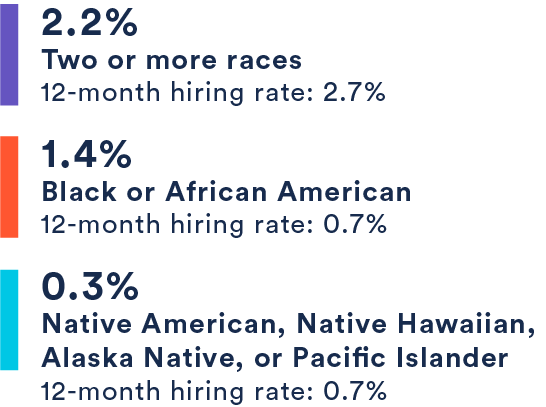
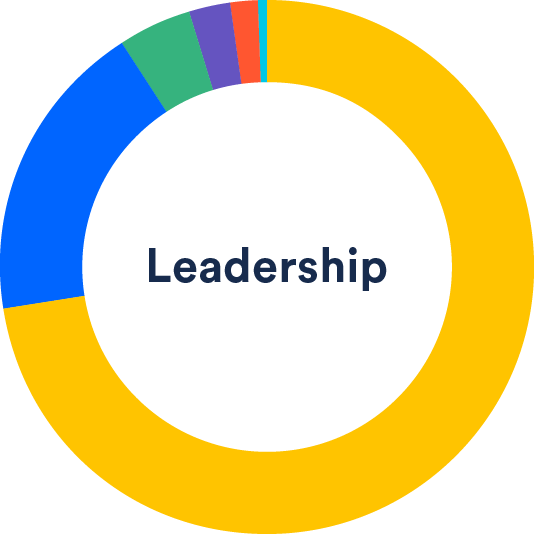
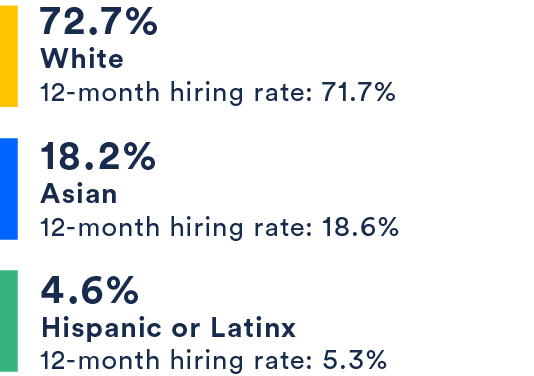
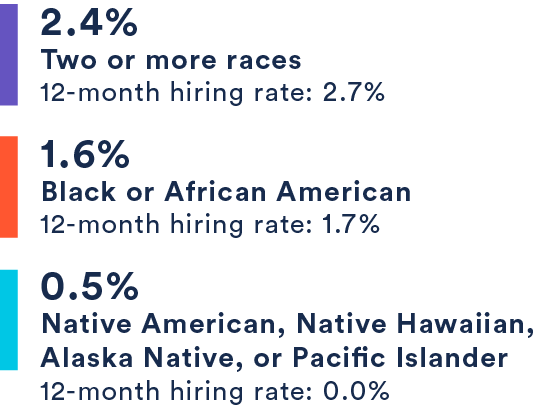
Race and/or ethnic identity
Race data only available for U.S.-based team members.

Age

International Representation
Employees on work visas.
