

Unlocking reliability with Splunk SmartStore
Atlassian developers use Splunk as the primary tool to search for and analyze logs from applications, appliances, and platforms. As Atlassian grows and introduces new features and services to our customers, the volume of telemetry data, including logs shipped to our Observability data sinks like Splunk, has also increased.
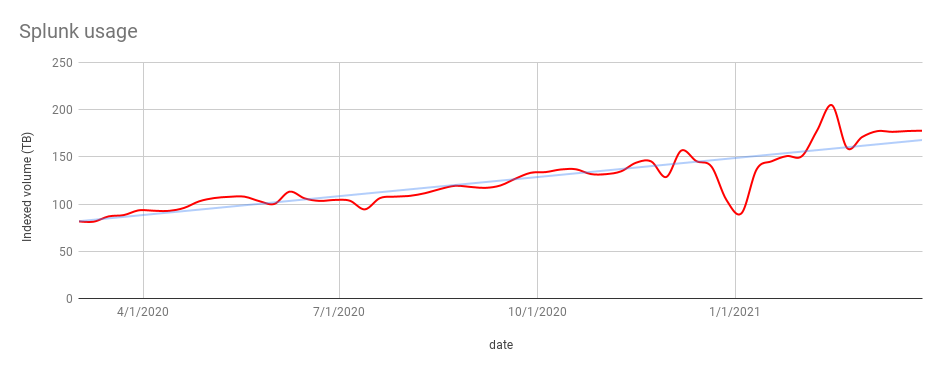
Here’s a chart that shows a simple moving average of the volume of data we sent to Splunk over a one-year period:
The Splunk platform is owned and managed by the Atlassian Observability team. We also design and maintain the instrumentation libraries, sidecars, and agents used to collect logs and pipelines to enrich, transform, and ship these logs to Splunk reliably and at scale. We currently ship hundreds of terabytes of logs to Splunk every day from services deployed globally. Usually these logs are indexed in Splunk within 30 seconds of being emitted by an application. These logs are used to generate reports, alerts, and dashboards. They are also used for ad-hoc analysis and troubleshooting by over 5,000 developers who execute over 200k searches a day.
In Observability, like all other teams at Atlassian, we identify and track Service Level Indicators (SLIs) to measure the reliability and performance of our systems. These SLIs are used to calculate error budgets for all our systems. We then use error budgets to drive our engineering and operational work. When reliability or performance of a system suffers, we burn through our error budget. When we have no more budget left, we stop all our engineering work and focus solely on improving the reliability of the system.
When the reliability of our system suffers over a sustained period of time, we call a multiple-alarm fire (a system used for categorizing the seriousness of a fire in the US and Canada). When this occurs, the entire team deprioritizes feature development work and focuses only on restoring the reliability of the platform for which the multiple-alarm fire was called for. This is the situation we found ourselves in toward the end of 2020.
The Problem
Let’s take a quick look at how we run our Splunk deployment before we get into the problems we face when running Splunk at scale.
We run a Splunk Enterprise deployment on AWS EC2. Our deployment consists of a single search head cluster and multiple indexer clusters in a single AWS region. Some of our indexer clusters are special purpose (they contain logs from some of our larger products, access, and audit logs, etc.) and the rest are general-purpose clusters. Our indexer clusters are configured as multisite clusters and span multiple availability zones for intra-region redundancy.
As a result of performance testing of various instances types on AWS, we determined that to achieve an acceptable level of performance in terms of search time Service Level Objectives (SLOs), we needed to run our indexers on the i3en instance family. The faster NVMe SSD instance storage on the i3en instances offered a significant performance improvement to the previous generation of instances. Therefore, when we bootstrap indexer nodes, we create a RAID0 array with all the instance store volumes and mount the Splunk hot and cold volumes on them.
This meant that as our ingestion volume grew, we have been constantly scaling up the number of nodes in our indexer clusters to index data and provide our users 30 days of retention (which is also an SLO we commit to).
A simple formula to determine the number of indexer nodes is:number of nodes = ingestion volume (GB/day) x retention (day) / storage per node (GB)
Obviously, this does not take into account the search load, which is also directly proportional to the volume of logs ingested. Here’s a chart that shows the growth in the number of indexer nodes across our clusters:

As the volume of data on disk and the number of instances increased, so did the operational complexity of maintaining our clusters. Even with tools to manage configuration of Splunk nodes, automated build and deployment pipelines to create AMIs and deploy infrastructure, instance refreshes and rolling restarts took over six hours to complete for a single indexer cluster.
We also couldn’t tolerate loss of nodes. Any unintentional loss of nodes resulted in protracted cluster stabilization times owing to bucket fixup tasks. This is the situation we found ourselves in at the end of 2020.
The Solution
SmartStore, introduced at .conf 2018 allows for the decoupling of storage from compute by enabling indexer nodes to store warm buckets in object stores such as S3. This seemed like the perfect solution to address our operational complexity. SmartStore would allow us to have fewer nodes in our indexer clusters as we no longer needed to scale out to increase available disk space to meet our retention targets.
We had 2 petabytes across our indexer clusters that we needed to migrate to S3. Before we started our planning phase, we set ourselves three non negotiable conditions:
- No data loss
- Less than 30 minutes of interruption (to ingestion and searches)
- No degradation in our SLOs post migration
With these three governing conditions, we came up with several ideas for implementation such as:
- Running SmartStore enabled clusters in parallel with our existing clusters and routing one or a batch of indexes to the new clusters at a time. Our ingestion pipeline performs dynamic routing of logs to Splunk, so this seemed like a plausible option. However, a deeper investigation concluded that we’d need to extend our routing APIs to cater for our use case. We are in the process of replacing our routing layer, so expending engineering time to extend the APIs was going to be wasted effort. Hence, we decided to abandon this idea.
- Enabling SmartStore one index at a time on our existing cluster. While this was a safe option, changing (or in our case adding) the
remotePathsetting to an index inindexes.confrequires a rolling restart. With over 300 indexes across our clusters, this was not a feasible option. - Enabling SmartStore on all indexes in a cluster at the same time. While this was a fairly risky option, we decided that with the right controls, automation, and monitoring in place, we’d be able to implement SmartStore without violating any of our governing conditions.
Planning
We started by attempting to identify an appropriate window for migration, that is a window when our indexer clusters were the least used. The following charts show what our indexing and search load looks like over a 30-day period. We have four indexer clusters in our production environment, so these charts overlay four timeseries (one per cluster):
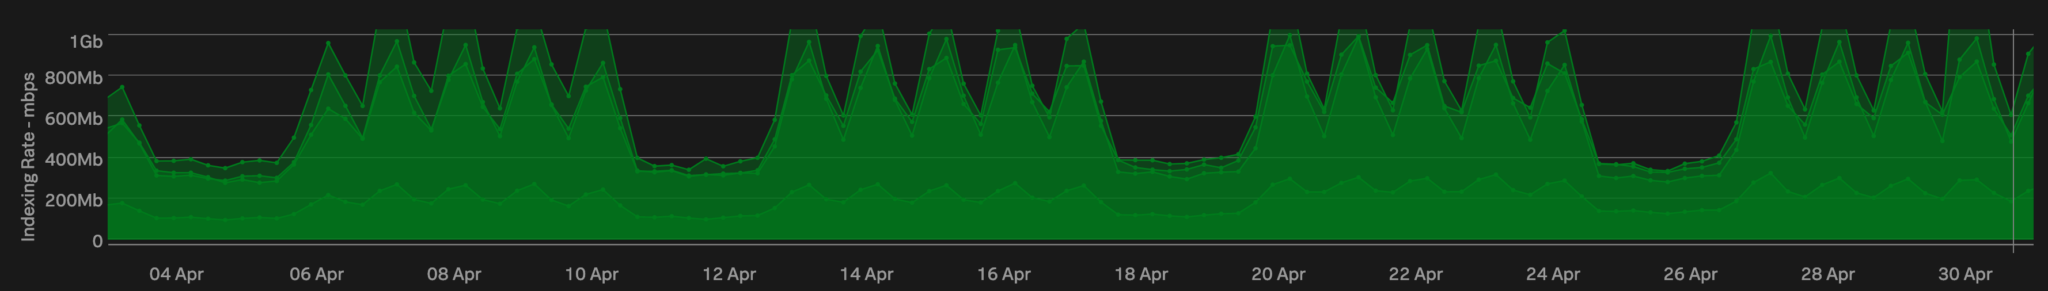
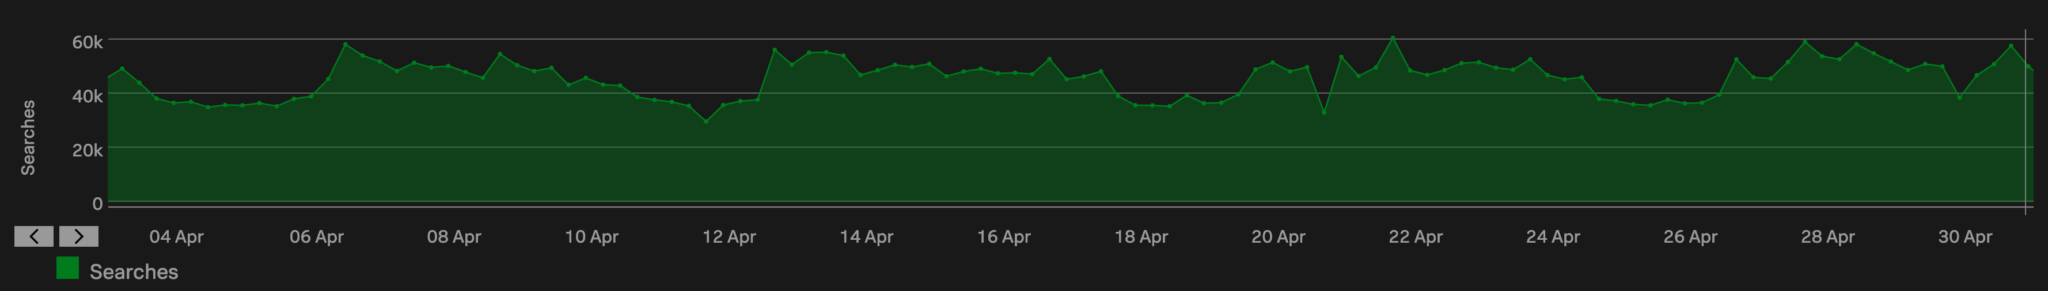
We have an almost constant search load (no, we don’t have developers who work all the time! but we do have a fairly large number of scheduled searches that run on a cron schedule) but our ingestion rates are lower on Sundays. This was going to be our migration window.
We then verified that our clusters were balanced in terms of the volume of data per node. Whilst Splunk does this automatically, we were also able to verify this. We calculated that the total volume of data we needed to migrate was just over two petabytes.
Next stop was to determine whether our indexer clusters would be able to handle the load. At the time, we used i3en.6xlarge instances for our indexer cluster. This meant we had 25GBps of network bandwidth available per indexer node. Instance store volumes also meant that we had sufficient headroom in terms of disk IOPS. However, we noticed that one of our clusters had less than 5% CPU headroom on Sundays. A quick fix was to scale up the cluster. SmartStore migration is a perfectly parallel task, so more nodes means a faster migration.
Finally, and perhaps most importantly, we analysed our user queries to determine the most frequently used time windows and the distribution of the earliest time range they picked. We were able to determine that most searches our users executed were on events that are less than 24 hours old. This is one of the most important considerations for the sizing of the SmartStore cache.
Design and Preparation
We then came up with our initial design and worked with our amazing Splunk professional services team to validate it. Our design was actually quite simple. I won’t go into specific configuration details (as they will widely vary between deployments), but the salient points were:
- S3 gateway endpoints configured in our VPCs and endpoint policies to restrict access
- One region local S3 bucket per cluster for the remote store
- Bucket policies to restrict access to only indexer nodes’ IAM Instance profile
- S3 Server Side Encryption (SSE) that used custom KMS keys.
In terms of Splunk configuration, SmartStore has sensible defaults for most settings and we recommend leaving them alone. In fact, the only setting we modified was the eviction_policy option in server.conf. We changed this to lruk. The default is lru.
We automated the implementation steps using Ansible (the configuration management software we use for managing our Splunk configuration). We use the cluster manager to distribute configuration to the indexer peers, so our implementation steps were essentially as follows:
- Template out
server.confandindexes.confconfiguration files to the cluster manager (in/opt/splunk/etc/master-apps/_cluster/local) - Place the cluster manager in maintenance mode
- Stop the Splunk process on all indexer nodes
- Validate the cluster bundle
- Apply the configuration bundle to all peers
- Start Splunk on all indexer nodes.
It really is as simple as that!
We then tested our configuration in our lower environments (dev, staging etc). We unfortunately do not have the same indexing rate or search load in our lower environments as our production environment, so these tests merely served in validating our configuration. We were fully cognizant that we might see issues at scale in our production environment
Implementation
Our implementation was quite straightforward, owing to all the efforts we put into our planning, preparation, and test phases. We stopped our ingestion process for around 10 minutes while we applied the cluster bundle to all indexer peers and restarted the Splunk process on them. We have a service, quite imaginatively called splunk-ingestion, that reads messages (logs) off our aggregation Kinesis Data Stream (KDS), batches them, and sends them to HEC endpoints on indexer nodes. So stopping ingestion simply meant that we signalled the splunk-ingestion service to stop consuming messages off the stream.
Once all the indexer nodes had received the updated configuration (i.e. they had downloaded and applied the latest bundle from the cluster manager) and had been restarted, we re-enabled ingestion (this process took less than five minutes).
Indexer nodes immediately begin uploading warm buckets to S3 (cold buckets are left on local storage and are not managed by SmartStore). At this stage, the only control we had over the migration process was to control the number of threads used to perform the upload. The default is set to eight and we did not need to tweak this setting.
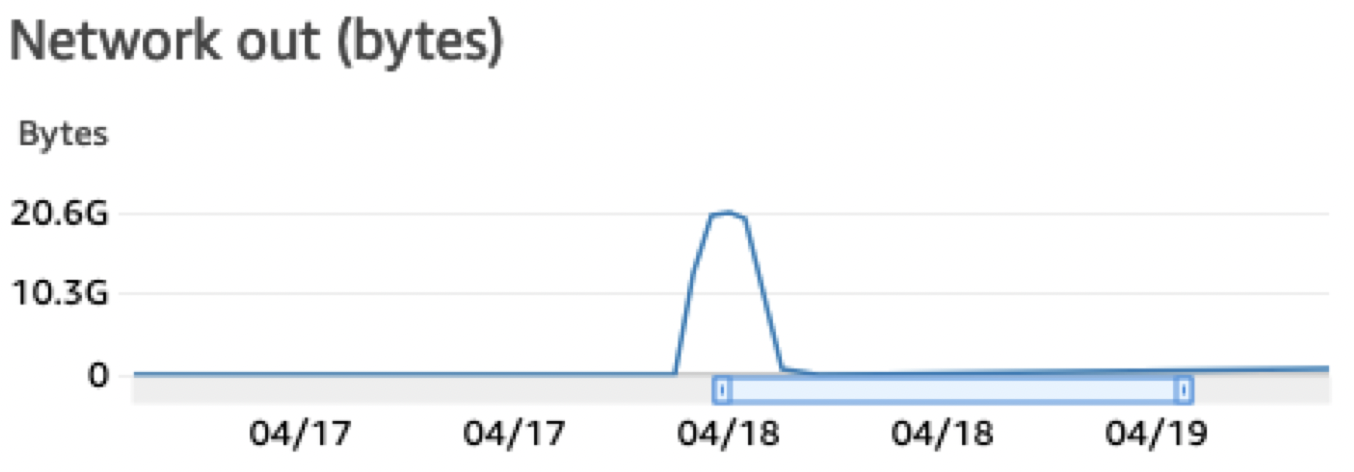
Throughout the migration, we kept close watch on our usual USE (Utilisation, Saturation, and Error) metrics and search SLIs. As expected, we were able to almost fully saturate the network bandwidth on the indexer nodes. Here’s a chart that shows the sum of network bytes sent from an indexer peer.
Result
Our migration was done in three tranches.
| Tranche | Number of clusters | Volume of data | Time taken |
|---|---|---|---|
| 1 | 1 | 350 TB | 3.5 hours |
| 2 | 1 | 660 TB | 4 hours |
| 3 | 2 | 900 TB | 5 hours |
Here’s a chart that shows how SmartStore performed after migration:
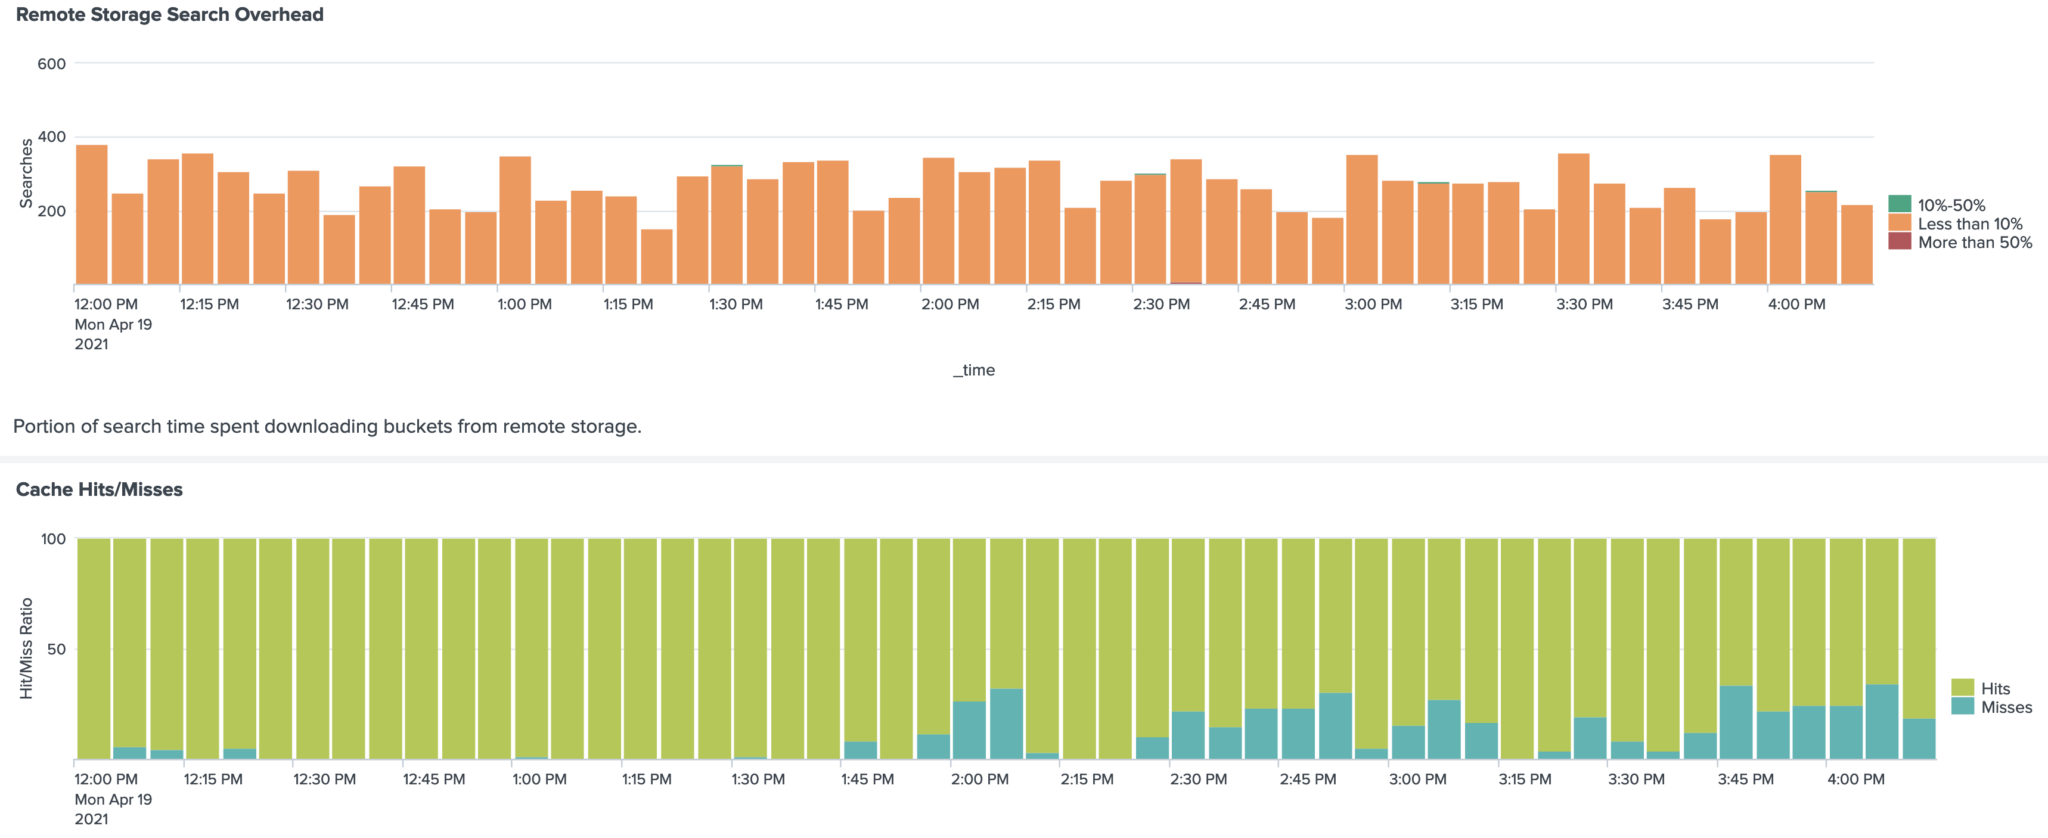
All searches encounter less than 10% overhead due to SmartStore having to retrieve data from S3 and our cache looks pretty healthy too (which contributes to lower search overheads). We saw no degradation in our SLOs during and after our migration, which led us to conclude that we were able to achieve all three of our goals!
SmartStore has improved the Reliability of our Splunk platform because warm buckets are rolled to S3 (remote store), making the remote store the master copy. This means that even when we lose a few nodes, we don’t lose data. S3 also offers us a higher level of data integrity, durability, and availability therefore making it more reliable than local storage.
SmartStore has improved our Operational Efficiency. Since the volume of data stored on disk is reduced, scaling events are faster (as rebalancing of data is faster). For example, rolling restarts that used to take us over six hours like we previously discussed, now takes five minutes!
Also, since the amount of logs we can store is no longer related to the number of nodes in our indexer cluster, we now are able to offer our users with longer retention for their logs.
Tips
If you’re thinking of implementing SmartStore on your Splunk enterprise deployment, here are some things to keep in mind.
- Use VPC gateway endpoints for S3 and pay special attention to the endpoint policies. You do not want to be overly permissive or overly restrictive. You might be using S3 buckets that you did not explicitly create like RHUI and Amazon Linus repositories.
- Use S3 SSE to ensure encryption at rest and ensure that you use ACLs to disallow public access to your SmartStore buckets and objects contained within them. In fact, this is a good idea for all your buckets, except the ones where you host your static site of course!
- It is best to leave the aging of buckets to Splunk. But if you need to configure lifecycle policies on your buckets, ensure they use longer timeframes to transition to Glacier (or delete) than your Splunk retention configuration (i.e.
frozenTimePeriodInSecs). - Ensure you have an even distribution of data across your indexer nodes. This will prevent a scenario where a few nodes, which might have a disproportionate amount of data might be saturated.
- Ensure you use nodes that have sufficient network bandwidth in order to achieve your desired throughput.
- If you have configured Splunk to use large buckets (by setting
MaxDataSize), ensure you set this toautoas early as possible. This will ensure that you have smaller buckets before you move to SmartStore (recall this will apply only to new buckets, so earlier the better). Also, we recommend you do this when your ingest or search load is low as we have noticed that changing this setting increases the number of Splunk optimize processes which consume significant CPU resources. - Baseline your performance before the migration, and measure your search performance after migration. If your search performance degrades, take a look at your search overhead. This will give you a good indication as to whether you need to increase your cache size.
- Keep an eye on the cache thrash. Excessive repeated downloads of the same buckets indicate that you need to increase your cache size (
max_cache_size) or node count. - Keep the bloom filter files around for longer than tsidx and journal files (by setting
hotlist_bloom_filter_recency_hours). This will ensure your search overhead is low as Splunk is able to efficiently download buckets directly to satisfy a search without having to first download the Bloomfilter files to determine which buckets to download.