

Migrating the Jira and Confluence applications to AWS Graviton
Discover how Atlassian migrated over 3,000 Jira and Confluence instances to AWS Graviton, boosting performance and efficiency at scale.
Introduction
Jira and Confluence have become essential tools for teams around the globe, driving collaboration and productivity. However, their widespread adoption comes with challenges that only scale can provide. What may seem like a straightforward task, such as migrating a few Java applications to a different CPU architecture, can quickly escalate into complex challenges when operating at scale.
In this blog post, we will explore how Atlassian migrated more than 3000 EC2 instances for Jira and Confluence to AWS Graviton, achieving this ambitious transformation with minimal to no impact on users.
It will also go through the technical challenges we faced, the strategies we employed, and the outcomes that improved our reliability, performance, and cost efficiency.
Why did we want to move to Graviton?
In the tech industry there are only a couple of things that can make engineers try something new. Either it’s because we can do something faster or because we can do something cheaper. When only one of those two benefits presents itself we often resort to long trade-off conversations because we not only have to factor in the immediate gains but also the invisible costs of implementation, support, tooling ecosystem, edge cases, and so on.
However, when both benefits are possible at the same time, we get the necessary nudge to break the inertia of “what’s already working” in favour of reaching something better.
AWS Graviton is one of those cases in which both faster and cheaper were theoretically possible according to AWS claims. According to them each version of Graviton had a bigger performance per Dollar due to the lower power consumption of Arm’s architecture which reduces operation cost for AWS which in turn gets passed on to customers.
History of previous attempts
There have been previous investigations into the feasibility of migrating Jira to Graviton 2 and Graviton 3 at Atlassian. Each attempt highlighted potential different slowness sources, from possible insufficient hardware power compared to Intel counterparts to the hypothetical greater impact of synchronized blocks, which seemed to affect Graviton more for some unexplained reason.


From a performance engineer’s view, this is a problem. When issues appear at specific parts of our code, at least you know where to investigate next. But when problems span multiple endpoints and areas of your code, pinpointing a fix is like finding a needle in a haystack.
To complicate matters, time for investigation is limited. After more than three attempts by multiple engineers around the globe yielded no consensus on why it runs slower on Graviton or how to fix it, the sentiment for a while across the SRE team was “Graviton is off limits for now; should we ever want to try it again, we need an unquestionable and reproducible evidence that explains why Jira and Confluence couldn’t run before with the desired performance (and what makes it possible now).”
Investigation for Graviton 4
In late September of 2024, AWS released Graviton4-based compute-optimised EC2 instances which claim to deliver up to 30% better performance over Graviton3-based instances.
It goes without saying that we were skeptical at first. Price-performance improvements over Intel were one of the key selling points of Graviton since its inception and that didn’t do it for us before, so why would this time be any different, right?
Yet, given that the performance difference between Graviton3 and Intel last time was not huge, it was enticing enough to yield another Performance testing – this time not only for Graviton3 but also Graviton4.
This time we would do things differently though:
1 – No micro-benchmarking rabbit holes
Micro-benchmarking measures the performance of small, isolated code pieces such as a single function, system call, or operation to assess their speed.
While micro-benchmarking helps compare how small code changes affect overall system performance, it often fails to identify problems, especially in large codebases like Jira and Confluence.
In past investigations for Graviton 2 and Graviton 3, we mistakenly started instrumenting and profiling code too early. This made us believe problems were anywhere and everywhere, wasting time without pinpointing what changes could fix the observed slowness.
Takeaway: Instead of measuring tiny code pieces first, we now identify system bottlenecks at a high level, dig deeper from there, and validate the need for micro-benchmarking only after we were certain that this is impactful to the overall performance.
2 – No passive-benchmarking was to be conducted
Passive-benchmarking is about observing performance metrics without a clear goal. In our case, it would be deploying Graviton in one isolated environment, load test it and just compare latency results between Graviton and Intel.
This is often the simplest benchmark we see engineers conducting because it requires little effort to run, yet those numbers tend to be pointless if you are looking for some performance regression. For instance, you might be lucky and the system under test is better in every single aspect, but this is not usually how it goes.
In most cases, you see numbers that are either be slightly favourable or not, however in both cases it tends not give you the confidence you need to proceed.
If the numbers look good, you might question whether your load test reflects production reality or if the data volume matches what you expect from production customers.
If numbers look bad, what causes the poor performance? is it bad for all endpoints? Are all endpoints invoked in the same proportion in production?
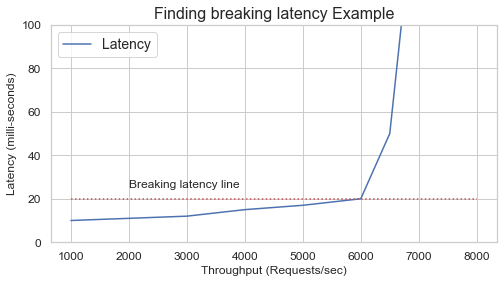
Takeaway 1: We defined a certain endpoint which we knew tested the most operations we consider vital to Jira and Confluence. If we could dig into why that ran slower and what we could do to make it faster then we can proceed beyond load testing.
Takeaway 2: Another important difference is that this time we agreed on what the benchmark methodology was going to be, as in, we drew this line in the sand: if we cross it, we all agree the result is good.
After a long discussion we settled on the “Throughput at breaking latency” metric. Breaking latency is the point when the machine can no longer serve more throughput and maintain acceptable response times to traffic being served and incrementally more throughput induces an exponential rise in latency.
3 – We want to gather and observe low-level hardware metrics this time
The hardware industry relies a lot on not telling you upfront the things that their products are not so good at, their limits and their design trade-offs. Not surprisingly, each CPU manufacturer has the tendency of creating their own benchmark suite and somehow their CPU ends up on top, right?
On the other hand, if you are an engineer comparing systems with little public information, it can be very challenging. One way of finding out what is happening internally at the hardware-level is to fetch low-level metrics, something called CPU Performance Monitoring Units (PMU).
PMU allows us to obtain information like:
- Instructions retired: How many individual operations the CPU actually finished running.
- Cache misses: How often the CPU looked for data in its fast memory (cache) but had to fetch it from slower memory instead.
- Branch mispredictions: How often the CPU guessed wrong about which way the program would go (like an “if” statement) and had to throw away prefetched instructions (some times called CPU speculation)
- Cycles stalled: How many moments the CPU was sitting idle, waiting for something — usually data from memory or another part of the chip.
Takeaway: Combining OS utilisation metrics with software instruction and PMU metrics gives a clearer picture of what and where the issue occurs, hopefully indicating the next step to fix the problem.
Findings
CPU Cache L3 miss-prediction on previous Graviton generations
CPU cache is built in multiple layers (L1, L2, L3). Each layer will have a different size, different speed and may be shared across different CPUs.
L1 Cache
- Closest to the CPU core, fastest, but tiny (tens of KB).
- Each core has its own L1 cache, usually split into two parts: one for instructions and one for data.
- Accessing L1 takes just a few CPU cycles.
L2 Cache
- A bit larger (hundreds of KB) and slightly slower.
- Usually private to each CPU core but not always.
- Acts as a backup for L1 — if something isn’t in L1, the CPU checks L2 next.
L3 Cache
- Much larger (several MB) but slower than L1/L2.
- This is very architecture dependent but usually it tends to be shared across all CPU cores in a chip/socket or across all sockets in a motherboard depending on manufacturer.
Although oversimplified, when the CPU wants a value at a memory address, it first checks the L1 cache, then L2, then L3. If none contain it, the CPU fetches it from RAM via the system bus, the slowest option.
This example should make things clearer:
- If the CPU tried to find the value for a memory address and found it at L1/L2 then things are as fast as they can be.
- If the CPU tried to find the same information but it failed to find it on L1/L2 but found it on L3 then, CPU may choose to promote that cache data into L1/L2.
- If the CPU tried to find the same thing but it failed to find across all CPU cache levels (L1/L2/L3) then CPU will fetch it from memory. However, L3 cache is not infinite, it may need to drop something to accomodate the newly cached data. The problem is that the dropped cached data could be what is needed in the next few operations. Now it will have to be fetched from memory again – in a way, this pretty much creates this snowball effect that we sometimes refer to as “cache thrashing”.
Another way of looking at it is that it’s in our best interest that the system we are testing make the most use of CPU cache layers, failing to do impact how fast operations can be processed.
Back to our findings, we consistently observed higher CPU Cache L3 miss-prediction per thousand instructions (l3-mpki) on Graviton3 in comparison to the Intel counterpart (~25% more) possibly indicating a higher CPU-cache thrashing.

This finding was valuable because it helped us move beyond the biased “graviton-doesn’t-have-enough-horse-power” knee-jerk reaction and pointed us to something more tangible, consistent and reproducible across multiple tests.
For this finding we had a few things at our disposal to make a better use of Graviton’s L3 cache such as:
- Optimising JVM code cache size
- Enabling JVM tiered compilation
Optimising JVM for Graviton for our use case
If we got more things being cached than can potentially fit in the L3 cache, then we need to do 2 things:
1 – Be more selective with what is likely to be cached
The JVM has the behaviour of compiling what it sees as frequently executed Java code into machine code. However, if you give the JVM a lot of space for the JIT (just-in-time) compiler then it will try to optimise a lot of things that may not give your Java application the performance boost you want. It’s very common for engineers to think that if you chuck more memory/space into JIT that it will perform better. It’s quite the opposite actually!
The levers that you have at you disposal are the -XX:InitialCodeCacheSize and -XX:ReservedCodeCacheSize JVM parameters. The way they work is by constraining the space JIT has to optimise code which deep inside makes JIT a bit smarter about what to put in there in the first place. In most cases a value between 64M and 128M tends to work really well in 90% of cases.
2 – Make JIT smarter about how much time it spends trying to optimise things
TieredCompilation is a feature in the JVM that combines two types of Just-In-Time (JIT) compilers:
- C1 (Client compiler) — fast compilation with basic optimisations.
- C2 (Server compiler) — slower compilation but produces highly optimised code.
The basic idea is: “We do not want to spend too many CPU cycles compiling a method that is going to be executed only once. In other words, we do not want to spend more cycles compiling a method than executing it!”
This can be achieved by using -XX:+TieredCompilation JVM option
Higher TLB tablewalk for previous generations of Graviton
Another thing that caught our attention was the TLB tablewalk per kilo instructions across multiple Graviton generations.

Translation lookaside buffer (TLB) is a memory cache that stores the recent translations of virtual memory addresses to physical memory addresses.
When a TLB miss happens this forces Memory Management unit (MMU) to walk the page tables in memory to find the mapping and place it in the TLB cache once again

This led us to enable Transparent Huge pages (THP) as a potential solution. This allows the Linux kernel to use huge pages in more places to increase performance by reducing TLB pressure.
This is done in 2 steps:
- choosing the top-level THP setting + selecting the page size to be used. One can set it via sysfs to
never,alwaysandmadvise.- To use 16kB pages:
echo inherit > /sys/kernel/mm/transparent_hugepage/hugepages-16kB/enabled - To use 64kB pages:
echo inherit > /sys/kernel/mm/transparent_hugepage/hugepages-64kB/enabled - To use 2MB pages:
echo inherit > /sys/kernel/mm/transparent_hugepage/hugepages-2048kB/enabled
- To use 16kB pages:
- For Java, hugepages can be used for both the code-heap and data-heap by adding the below flags to JVM command line
-XX:+UseTransparentHugePageswhen THP is set to at leastmadvise
Results
After adjusting the JVM code size to its optimal level, enabling THP to reduce TLB pressure, and optimizing several JVM parameters, results improved significantly

We restored the faith in Graviton, now what?
In theory all we would to have to do is to change the instance type to a Graviton-based equivalent and happy days, right? Not quite; this is where scale problems and battle scars join forces to hinder progress.
In particular we are talking about ICE (a.k.a Insufficient Capacity Errors). Those happen when one tries to launch an instance type that is not available in the availability zone requested.
Atlassian has worked with the cloud long enough to realise that what might be an exception for smaller customers is common for us. ICE errors occur between 10,000 to 15,000 times per hour worldwide for Atlassian.

An interesting phenomenon occurs whenever AWS launches a new instance type. On one hand, AWS usually has fewer of these available initially compared to established types. On the other hand, people flock to the new instance hoping for better performance or cost savings. The problem is that these two factors coincide, creating the worst of both worlds in which creates a fertile ground for higher ICE errors and slower scaling out activities.
Working around capacity issues?
In most cases, ICE errors don’t affect us because we rely either on Attribute-Based Instance Type Selection or MixedInstancesPolicy for EC2 Auto Scaling. If an instance fails to launch, we immediately fall back to a similar instance type based on resource constraints like CPU and memory or equivalent instance families.
The problem is that Attribute-based instance type selection points to a single AMI ID, making it architecture dependent. Only Graviton 4 instances meet our needs, so we cannot fall back to older Graviton generations in a lot of cases.
The solution found was break the challenge into 2 smaller different problems that could be achieved individually and then combine them together
1 – Not all EC2 instances are latency sensitive
Engineers tend to value standardisation across everything they handle. This often means simpler configurations or predictable performance impact, which are beneficial.
When we leave that comfort zone and identify subtle differences across components in our applications, we realise that 1) it was easier than expected and 2) it reveals opportunities for cost savings.
For Jira and Confluence, that came in the form of separately handling synchronous and asynchronous workloads. While former are extremely sensitive to latency and do need to run on the latest generation of instances, the latter are mainly throughput-oriented.
In testing we quickly found that EC2 instances not serving user-facing traffic can use older Graviton generations without impact. This is good news because older Gravitons are less in demand, reducing risk of insufficient capacity and freeing more Graviton 4 instances for critical part of the architecture. They are also cheaper, increasing cost savings from this migration.
2 – Make application support fallback to x86
To ensure reliability in case we run out of acceptable Graviton instances for a given workload, we want to fall back to the previously used x86 instances.
To do this, we tweaked our configuration so the Auto Scaling group can use multiple launch templates. It’s quite a bit of configuration to add but it ensures that an ASG can launch any of the instance types within specified parameters and a correct AMI will be selected for the architecture of given instance.

Rolling it out
As a sanity check, we started rollout with a single production site. Just to see if the testing results hold up when faced with one of our most demanding clients: ourselves and our own Jira site.
Results were hard to argue with. Over 30% improvement in per-instance throughput, while the P90 latency went down over 12%. With those results in hand, we started preparing to roll out to all of production.
Migrating to a new instance type at our scale required some coordination with AWS to align timelines and capacity expectations. In the meantime, we started a pilot rollout to gather more data in production.
Rollout to the pilot cohort has confirmed the significant improvements in throughput while decisively ruling out any regression.

Having confirmed that Jira will indeed work on c8g, we turned our sights to Confluence. At the time there was still a strong suspicion it might actually run on c7g, as the regression is workflow dependent. The early tests did seem to support that hypothesis. In testing we observed significant performance uplift (13% and 38% lower P90 and P99 respectively).
That fell apart however when we deployed to the first production shard.

Latency went up for all significant percentiles:
- p50: 19ms → 22ms
- p90: 51ms → 61ms
- p99: 262ms → 347ms
While much slighter than what we observed in Jira’s case, it was not a trade-off we could accept. We immediately pivoted to using c8g for Confluence as well.
Only thing left to do was a full scale rollout, so a lot of comms, splitting fleet into cohorts and monitoring for fallbacks. At that point there were no more surprises.
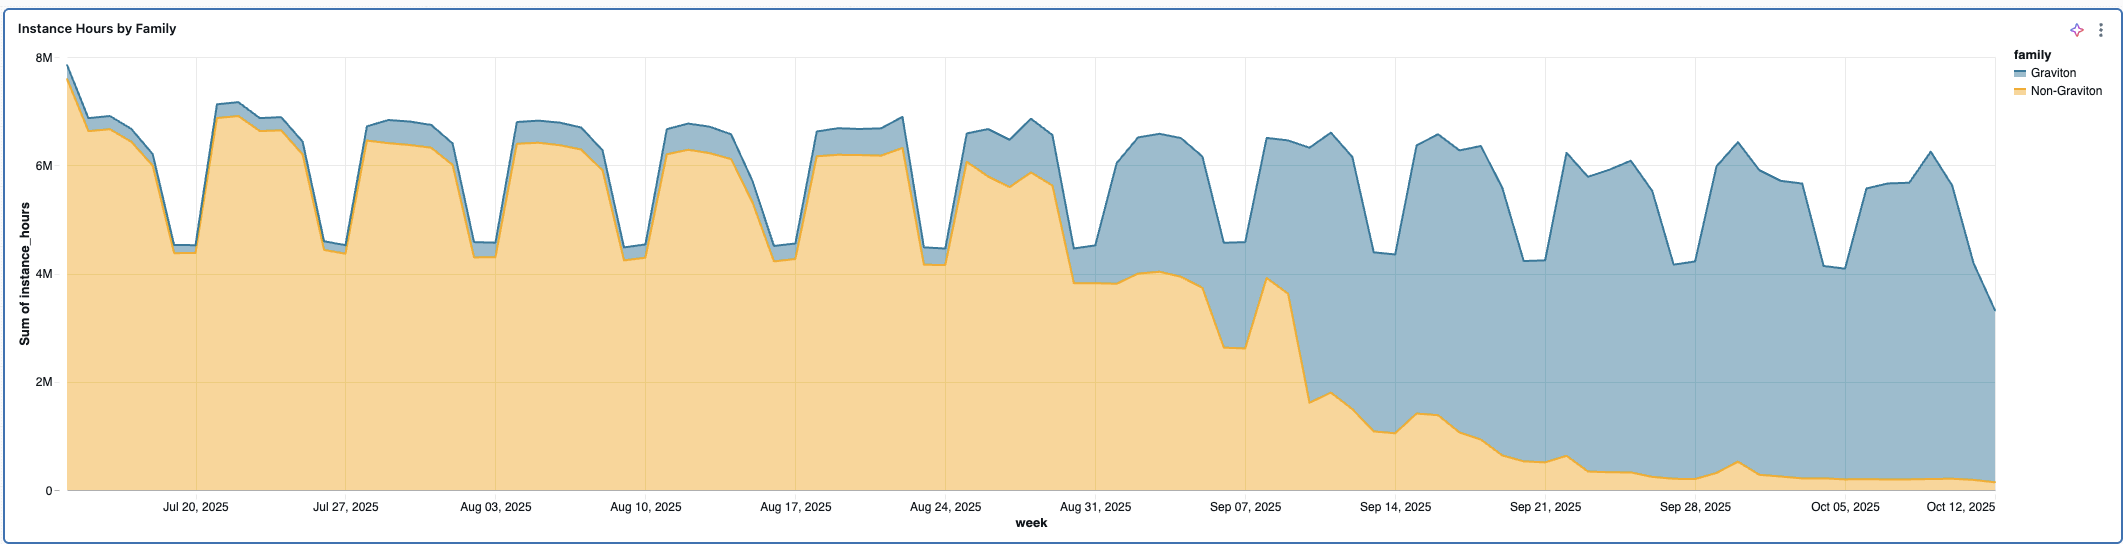
We are not at 100% Gravitons, as c8g is not GA in some regions and we are seeing fallbacks to x86 in the regions where capacity pool is under a lot of pressure.

At the current level, we are looking at around 9.8% savings across the board, while improving the experience for our customers with the meaningfully lower latencies.
That is not the entire story however, as the change in throughput characteristics offers even more potential savings that will require a bit of reorganisation of our fleet to unlock.

Some of the busiest shards in our fleet are showing upwards of 25% savings after the migration and only the traffic distribution stands between us and achieving that level of savings everywhere. But that “only” comes with its own set of unique challenges which are a story for another post.