

There are more than a million people using Amazon Cloud products, so it follows that many customers are employing an AWS integration with their Opsgenie instance. One common use case involves creating Opsgenie alerts from CloudWatch Logs to help stay ahead of issues and prevent incidents. CloudWatch Logs is an AWS log storage and monitoring feature that collects logs from all systems, applications, and AWS services in a single place. Many customers work with this data to create custom computations or create dashboards, as well as monitoring for specific keywords in the logs that may indicate a problem.

Making the most of alerting in Opsgenie
Notify the right people at the right time – every time.
Having access to this information is invaluable, as is the ability to generate an alarm – that’s where Opsgenie comes in. Instead of just sending an AWS alarm to an already-overloaded inbox, you can use Opsgenie and AWS CloudWatch together and forward the alarm to Opsgenie, which will then notify the right team members.
Sending the alarm to Opsgenie and creating an alert means you can utilize on-call schedules, escalation policies, and routing rules to ensure that those being notified are available and able to take action. And with Opsgenie sitting between your team and AWS CloudWatch, you have a wide choice of notification methods, including SMS, mobile push, phone call, and email.
Let’s walk through how this would work, assuming we want to generate alerts every time the “exception” keyword shows up in a particular log file. You’ll need access to your AWS account. If you don’t already have Opsgenie, you can sign up for a free 14-day trial.
We’ll use the Opsgenie CloudWatch integration API as an SNS HTTP/S endpoint to forward CloudWatch alarms to Opsgenie.
First, install the CloudWatch agent on the host you want to monitor:
$ curl -O 'https://s3.amazonaws.com/amazoncloudwatch-agent/ubuntu/amd64/latest/amazon-cloudwatch-agent.deb'

$ sudo dpkg -i amazon-cloudwatch-agent.deb
Selecting previously unselected package amazon-cloudwatch-agent.
(Reading database ... 123957 files and directories currently installed.)
Preparing to unpack amazon-cloudwatch-agent.deb ...
create group cwagent, result: 0
create user cwagent, result: 0
Unpacking amazon-cloudwatch-agent (1.227496.0-1) ...
Setting up amazon-cloudwatch-agent (1.227496.0-1) ...
Processing triggers for ureadahead (0.100.0-16) ...
Next, run the configuration wizard and set which log files should be published to CloudWatch:
(SAMPLE)
$ sudo /opt/aws/amazon-cloudwatch-agent/bin/amazon-cloudwatch-agent-config-wizard
=============================================================
= Welcome to the AWS CloudWatch Agent Configuration Manager =
=============================================================
On which OS are you planning to use the agent?
1. linux
2. windows
default choice: [1]:
  1
Trying to fetch the default region based on ec2 metadata...
Are you using EC2 or On-Premises hosts?
1. EC2
2. On-Premises
default choice: [1]:
  1
Which user are you planning to run the agent?
1. root
2. cwagent
3. others
default choice: [1]:
  1
Do you want to turn on StatsD daemon?
1. yes
2. no
default choice: [1]:
  2
Do you want to monitor metrics from CollectD?
1. yes
2. no
default choice: [1]:
  2
Do you want to monitor any host metrics? e.g. CPU, memory, etc.
1. yes
2. no
default choice: [1]:
  2
Do you have any existing CloudWatch Log Agent (http://docs.aws.amazon.com/AmazonCloudWatch/latest/logs/AgentReference.html) configuration file to import for migration?
1. yes
2. no
default choice: [2]:
  2
Do you want to monitor any log files?
1. yes
2. no
default choice: [1]:
  1
Log file path:
  /var/log/auth.log
Log group name:
default choice: [auth.log]
  auth.log
Log stream name:
default choice: [{instance_id}]

Do you want to specify any additional log files to monitor?
1. yes
2. no
default choice: [1]:
  2
Saved config file to /opt/aws/amazon-cloudwatch-agent/bin/config.json successfully.
Current config as follows:
{
	"agent": {
		"run_as_user": "root"
	},
	"logs": {
		"logs_collected": {
			"files": {
				"collect_list": [
					{
						"file_path": "/var/log/auth.log",
						"log_group_name": "auth.log",
						"log_stream_name": "{instance_id}"
					}
				]
			}
		}
	}
}
Please check the above content of the config.
The config file is also located at /opt/aws/amazon-cloudwatch-agent/bin/config.json.
Edit it manually if needed.
Do you want to store the config in the SSM parameter store?
1. yes
2. no
default choice: [1]:
  2
Program exits now.
Create your ~/.aws/credentials and ~/.aws/config files (see the AWS Documentation for more details):
~/.aws/credentials
  [default]
  aws_access_key_id=AKIAIOSFODNN7EXAMPLE
  aws_secret_access_key=wJalrXUtnFEMI/K7MDENG/bPxRfiCYEXAMPLEKEY

~/.aws/config
  [default]
  region=us-east-1
  output=json
Set the path to the credentials file and select the profile to use with the CloudWatch Agent:
$ sudo vim /opt/aws/amazon-cloudwatch-agent/etc/common-config.toml
[credentials]
   shared_credential_profile = "default"
   shared_credential_file = "/home/ubuntu/.aws/credentials"
Start the CloudWatch Agent:
$ sudo amazon-cloudwatch-agent-ctl -a start -m ec2 -c file:/opt/aws/amazon-cloudwatch-agent/bin/config.json
Verify that the agent started successfully:
$ sudo amazon-cloudwatch-agent-ctl -a status
{
"status": "running",
"starttime": "2019-09-10T12:14:23+0000",
"version": "1.227496.0"
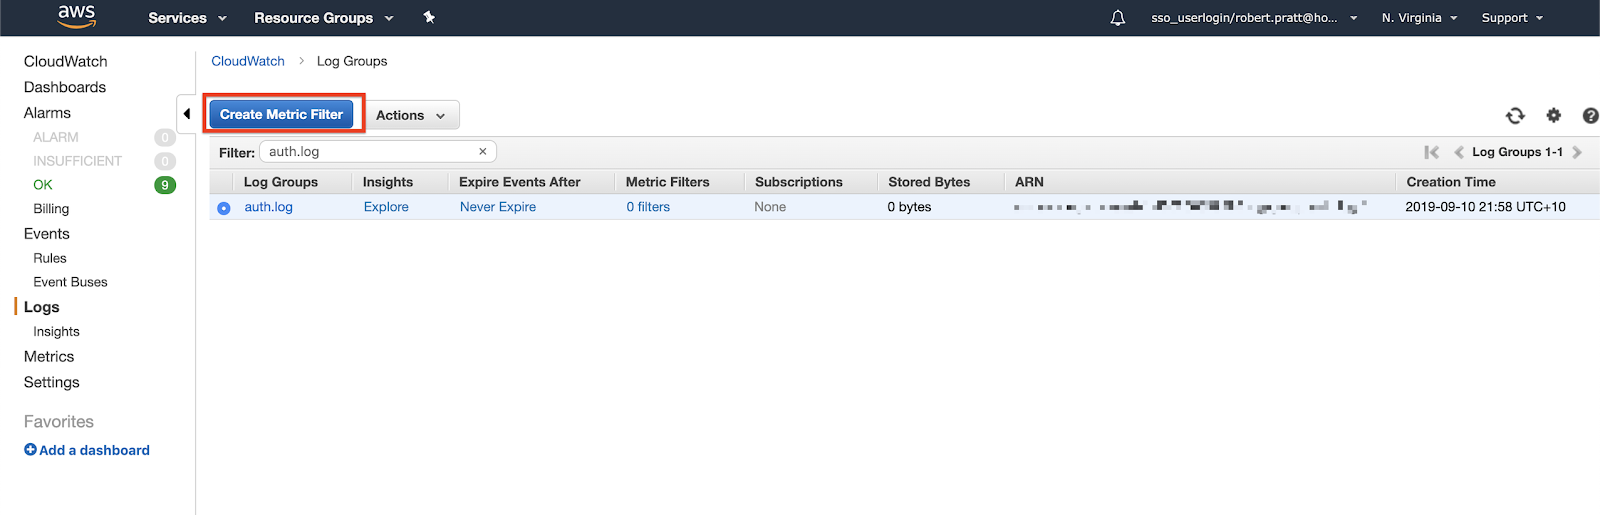
}Next, navigate to your CloudWatch dashboard and select the log group you just defined. Then select “Create Metric Filter”:
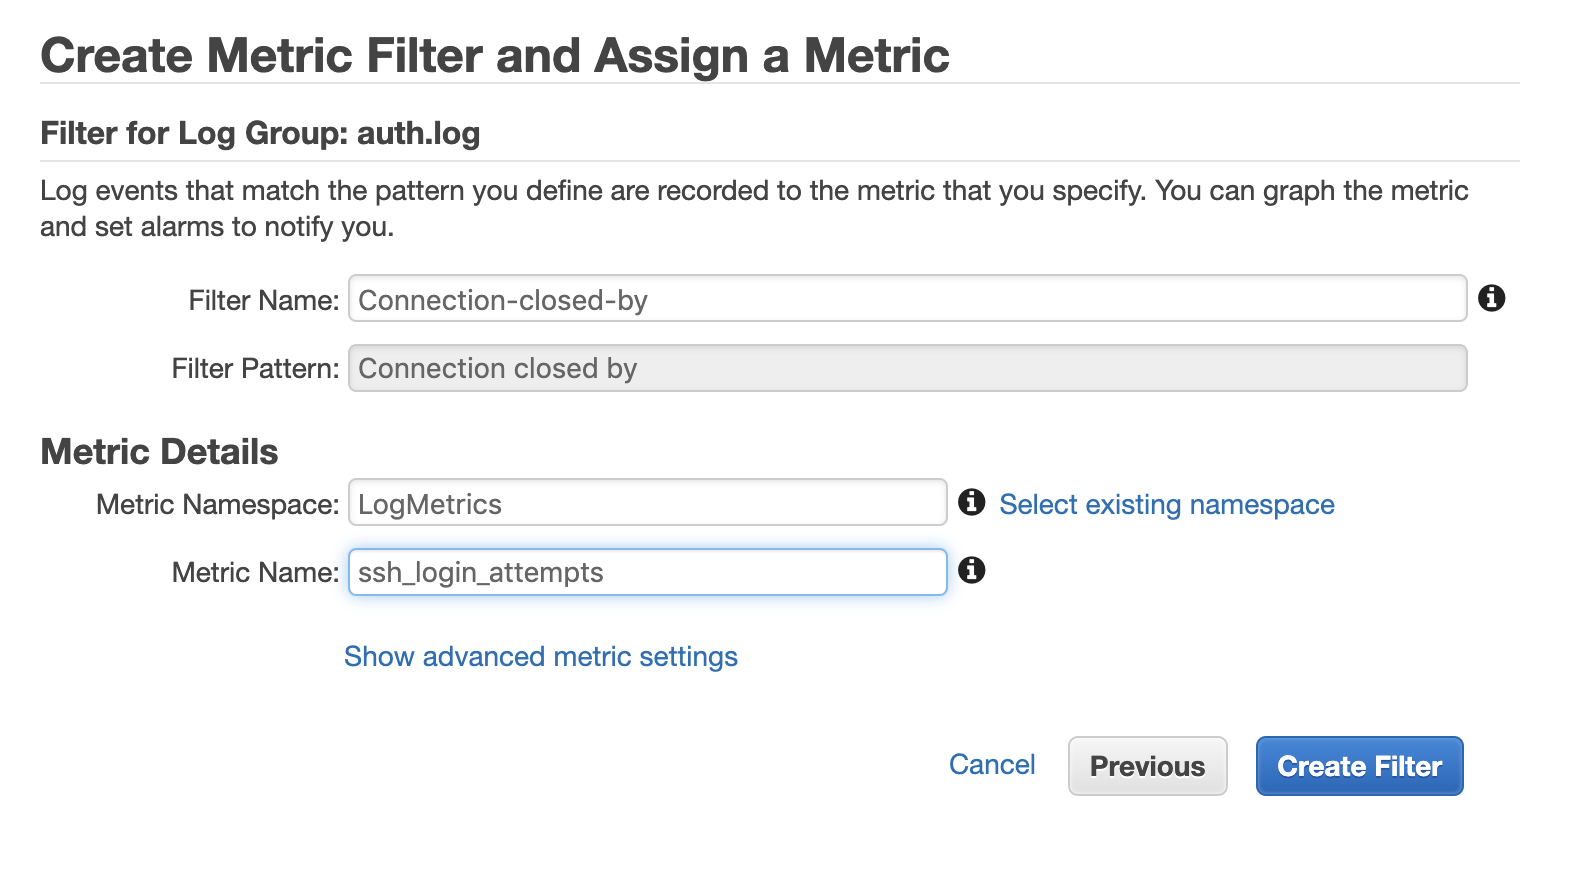
Define the pattern for the filter and select “Assign Metric.” This example filter will search for failed SSH login attempts:

Give the filter a metric and name it. Then select “Create Filter”:
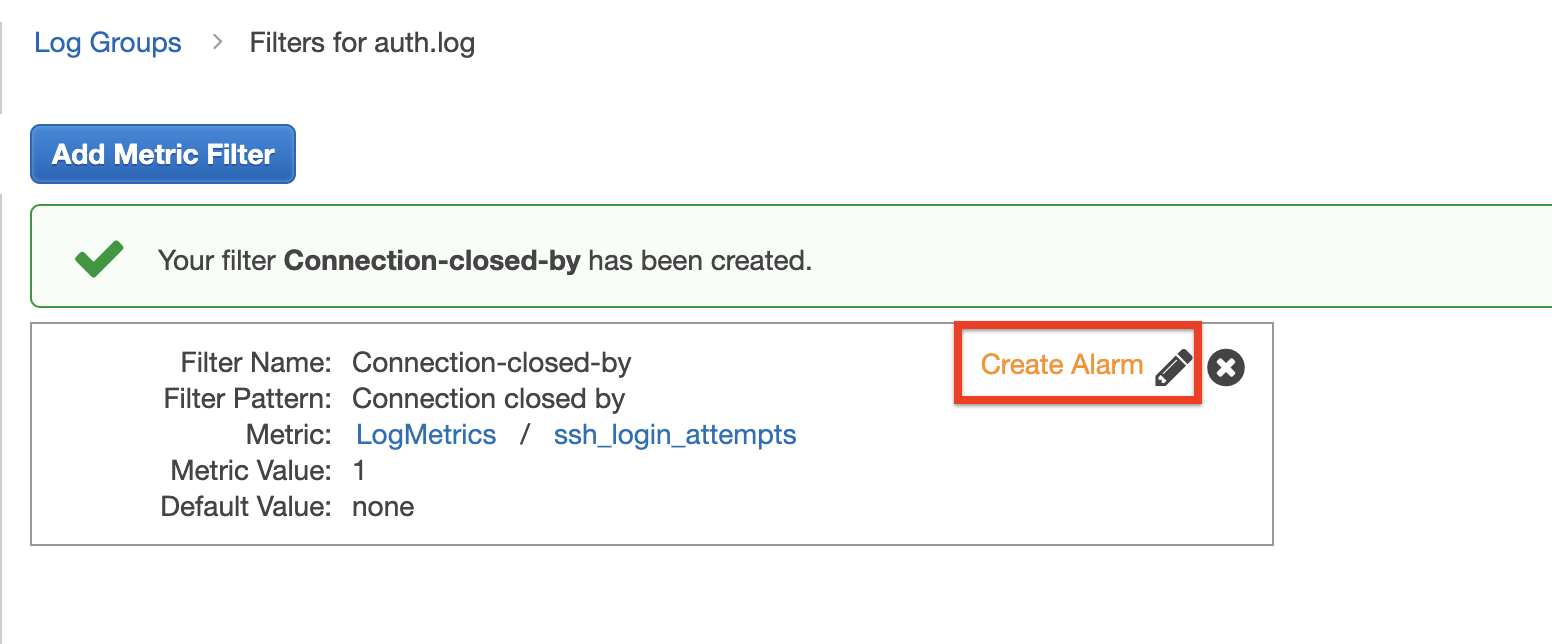
After the new metric is chosen, create a new alarm for it:
Set alarm thresholds and assign ALARM and OK notifications for your CloudWatch-Opsgenie integration topic:

Then, trigger the alarm to verify the alert has been created and closed in Opsgenie:

Now you’re all set up to receive alerts for logs. Pairing CloudWatch Logs and Opsgenie enables you to leverage your detailed, centralized logs with the control and flexibility that Opsgenie offers. Since Opsgenie will escalate an alert until it’s acknowledged or closed, problems in your CloudWatch Logs won’t go undetected. This means increased reliability and an improved customer experience.
Curious? Have questions? Try it out for yourself and let us know what you think.


