


Triangles at work: GPU rendering shapes and connectors in Confluence whiteboards
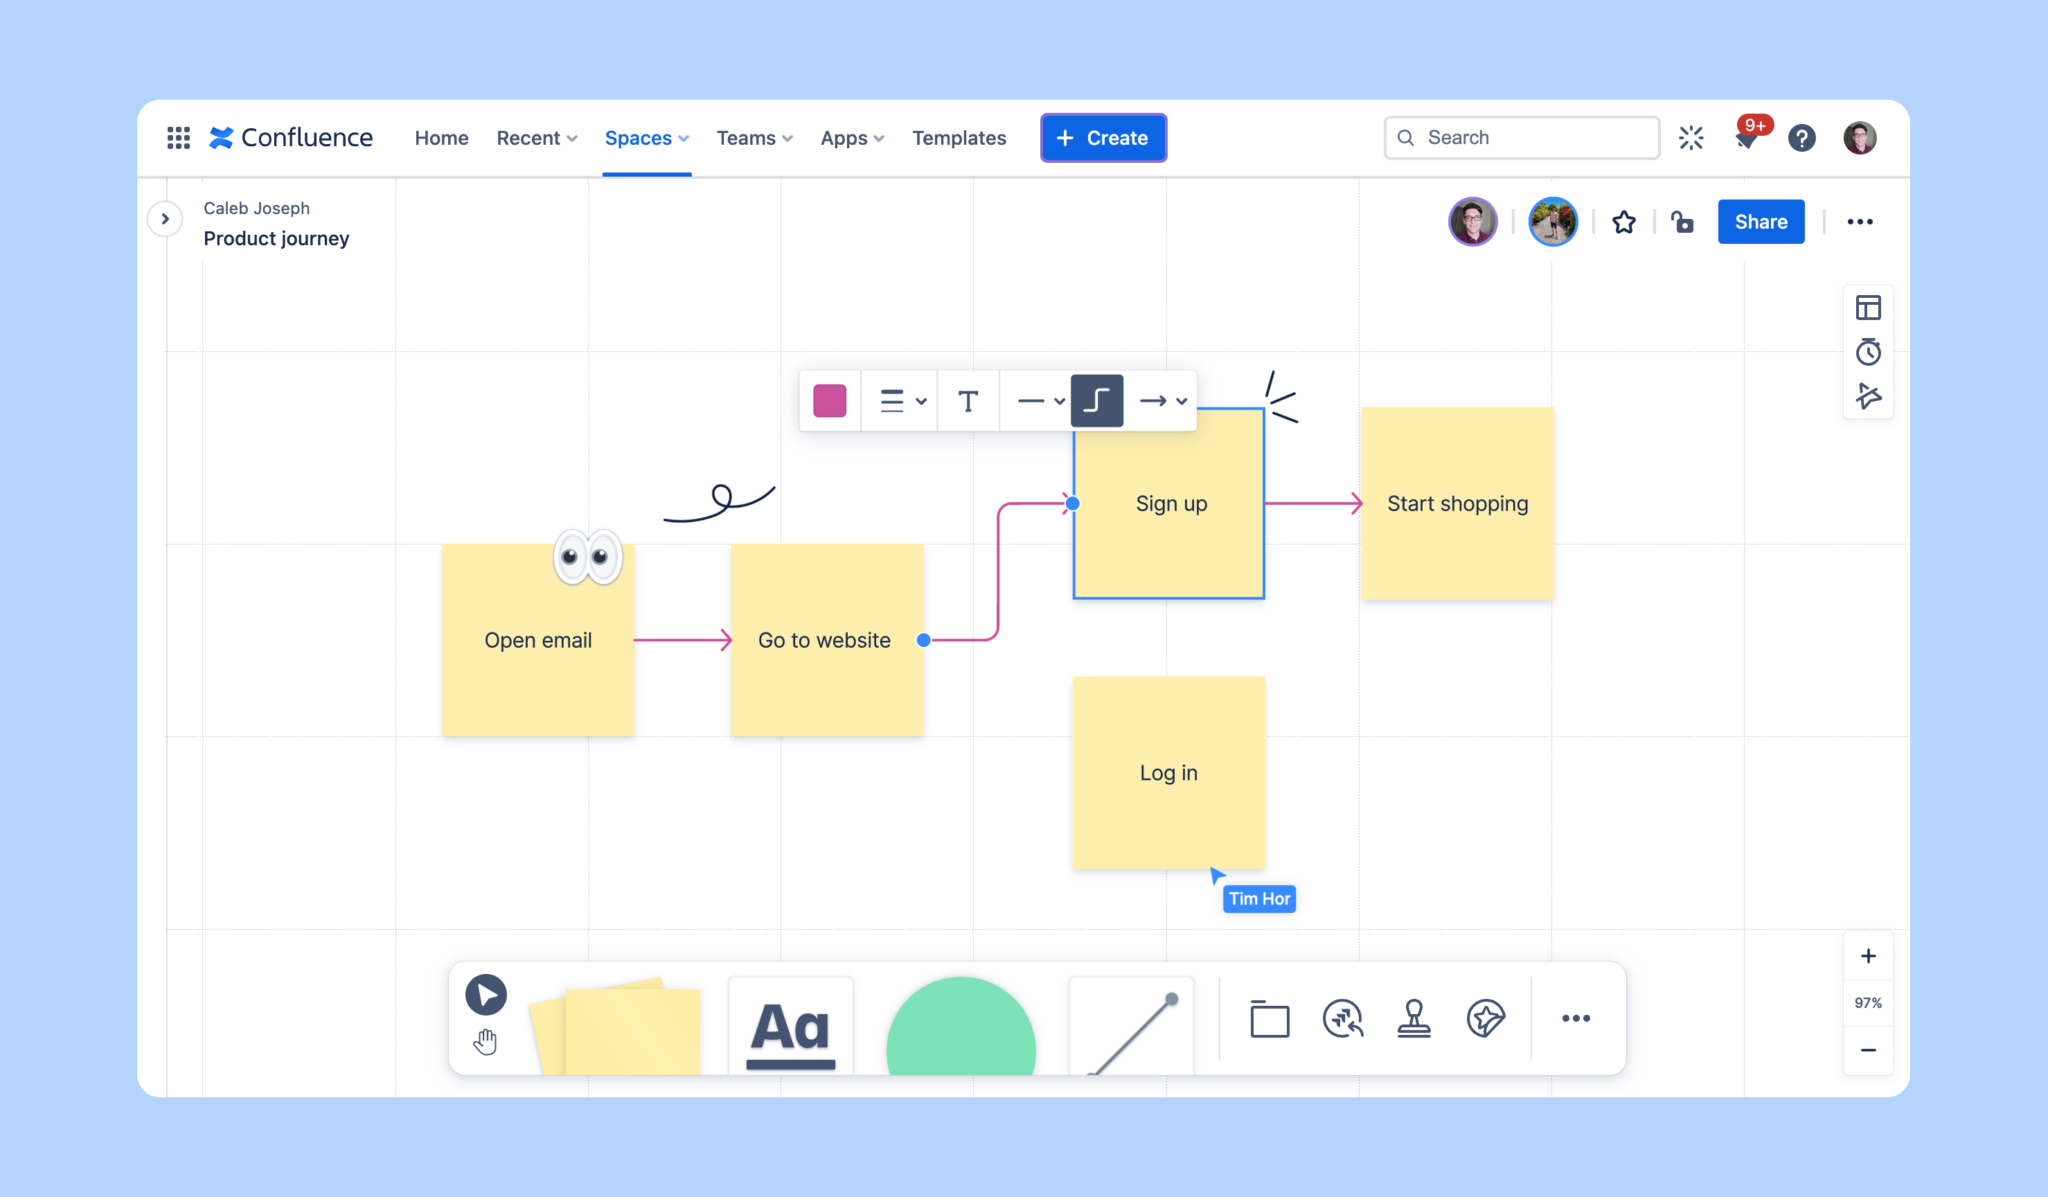
Atlassian is built on the power of teamwork and collaboration. One of our latest offerings in this vein is Confluence whiteboards. Unlike traditional blogs and pages in Confluence, whiteboards provide an infinite canvas for real-time collaboration, brainstorming, and diagramming.
Providing a fluid experience, even as users pan and zoom freely around large whiteboards, is a challenge. We explored a few options but ultimately determined that an ordinary approach of using HTML and CSS wouldn’t suffice. That’s why we built our own WebGL graphics pipeline, ensuring that even huge boards full of sticky notes, shapes and connectors display at a consistent 60+ frames per second (FPS).
We weren’t content with settling for a quick, easy solution that didn’t deliver the quality we wanted. So we didn’t cut corners – literally! In this blog post, we’ll dive into how we leveraged our WebGL graphics pipeline to render thousands of shapes and connectors without sacrificing performance.
More precisely, we’ll explore:
- The challenges involved in displaying different types of shapes, each with smooth rounded corners
- The concept of polygon triangulation
- Our approach to resizing shapes
- The intricacies of rendering connectors with seamlessly smooth arcs
Shapes vs. sticky notes
Let’s start by talking about shapes.
When we first started building shapes, we already had sticky notes implemented. Rendering a sticky note is easy – it’s just a square with a solid color fill.
But shapes are different. They can be resized to any size and aren’t limited to only squares or rectangles. We also wanted rounded corners and edges on shapes to make boards more visually appealing.

Displaying lots of different shapes with rounded corners and edges is a challenge compared to simple sticky notes. How do you render 5000 of them quickly? How do you round the corners? What happens to the rounded corners when you resize a shape? You get the idea.
Shapeception
Your computer’s graphics processing unit (GPU) was made to display triangles. If you want to display any shape – from a rhombus to a circle – using a GPU, you need to turn it into a series of triangles. The process of creating triangles from shapes is known as triangulation and powers everything from video games to user interfaces.
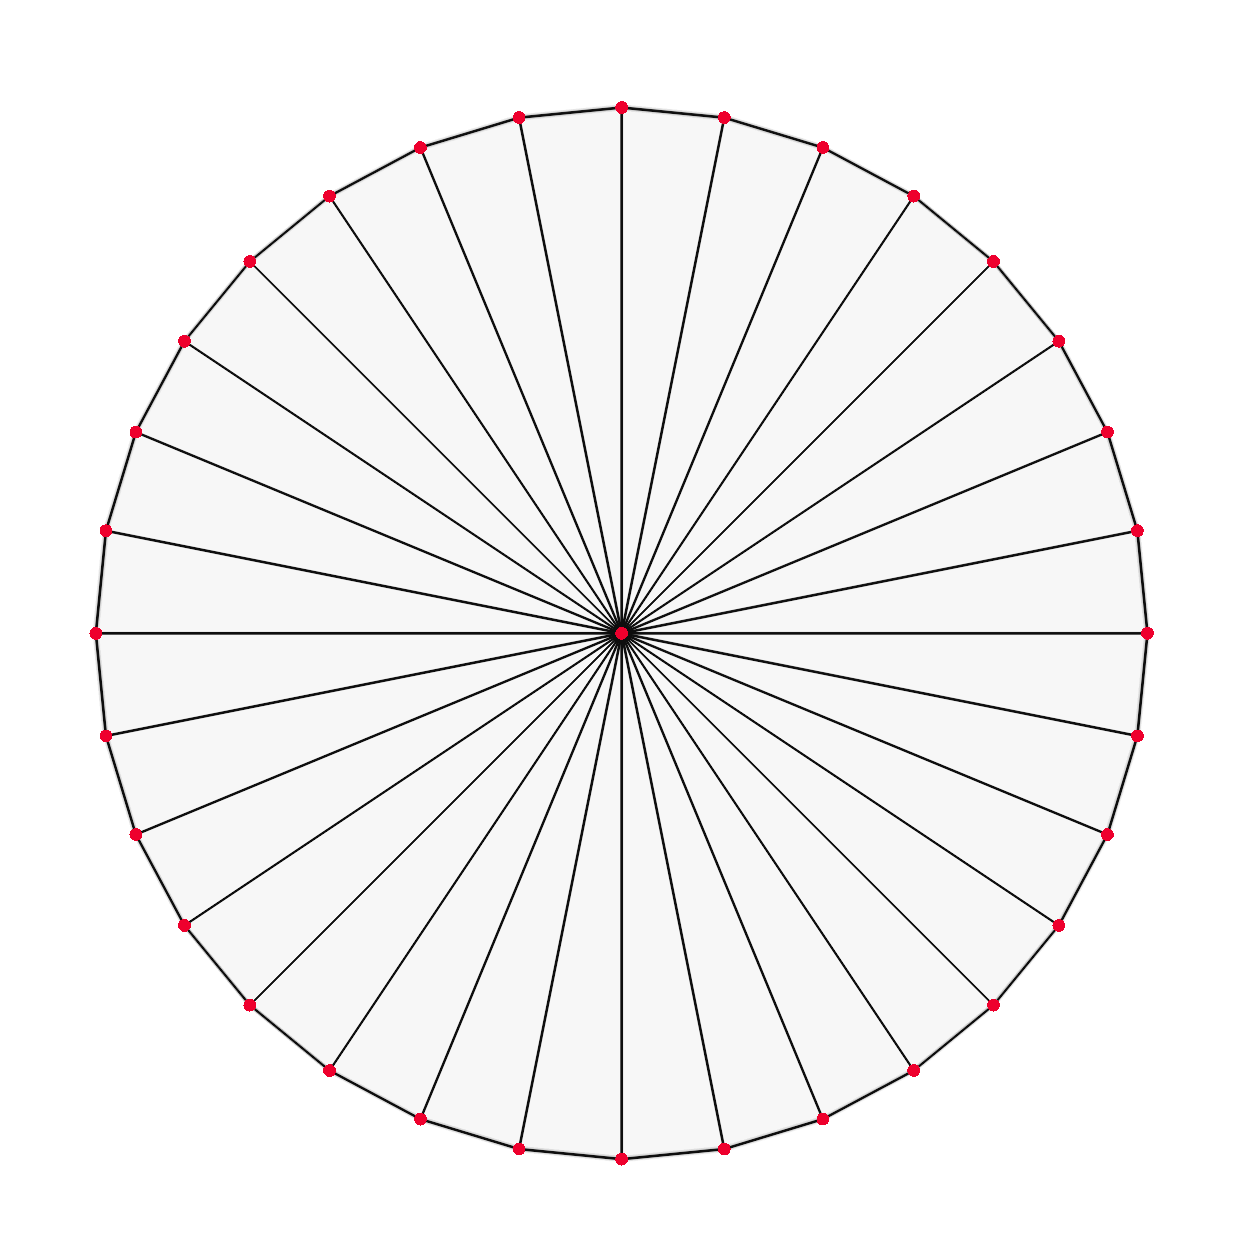
But how do we display a rounded shape like a circle, which theoretically has an infinite number of corners, when we can only use triangles? Well, we build an approximation of a circle by joining several thin triangles. The number of triangles used can be adjusted according to how smooth we want the shape to look and the performance cost we can afford.
Defining the edges of shapes
Now, how do we decide which triangles to generate for a rounded shape?
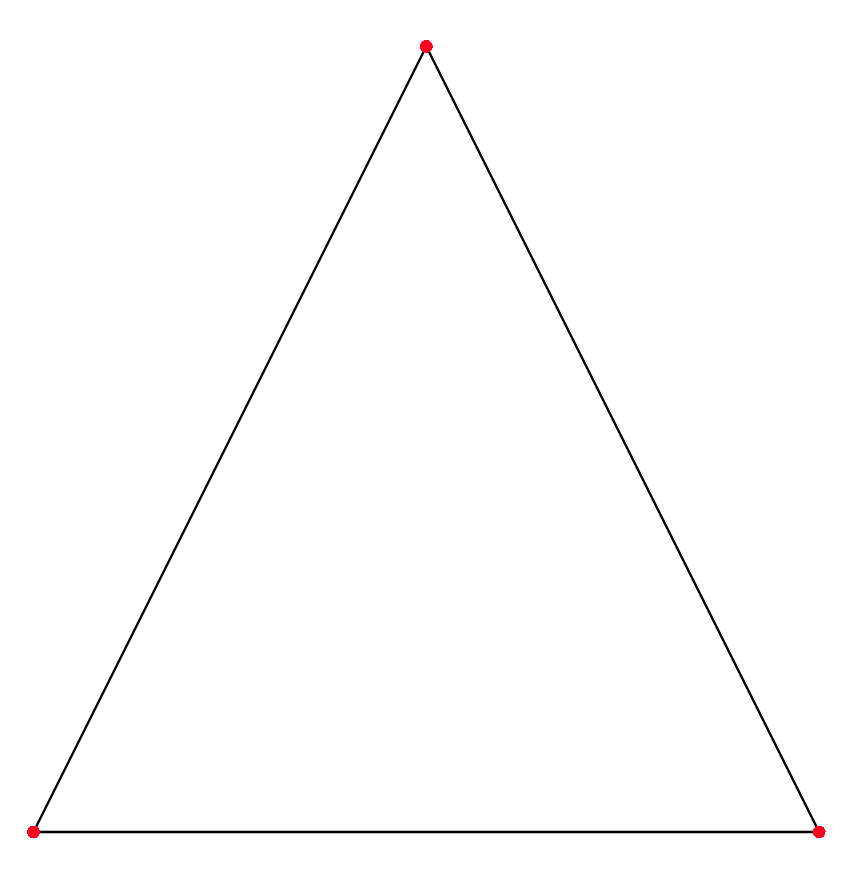
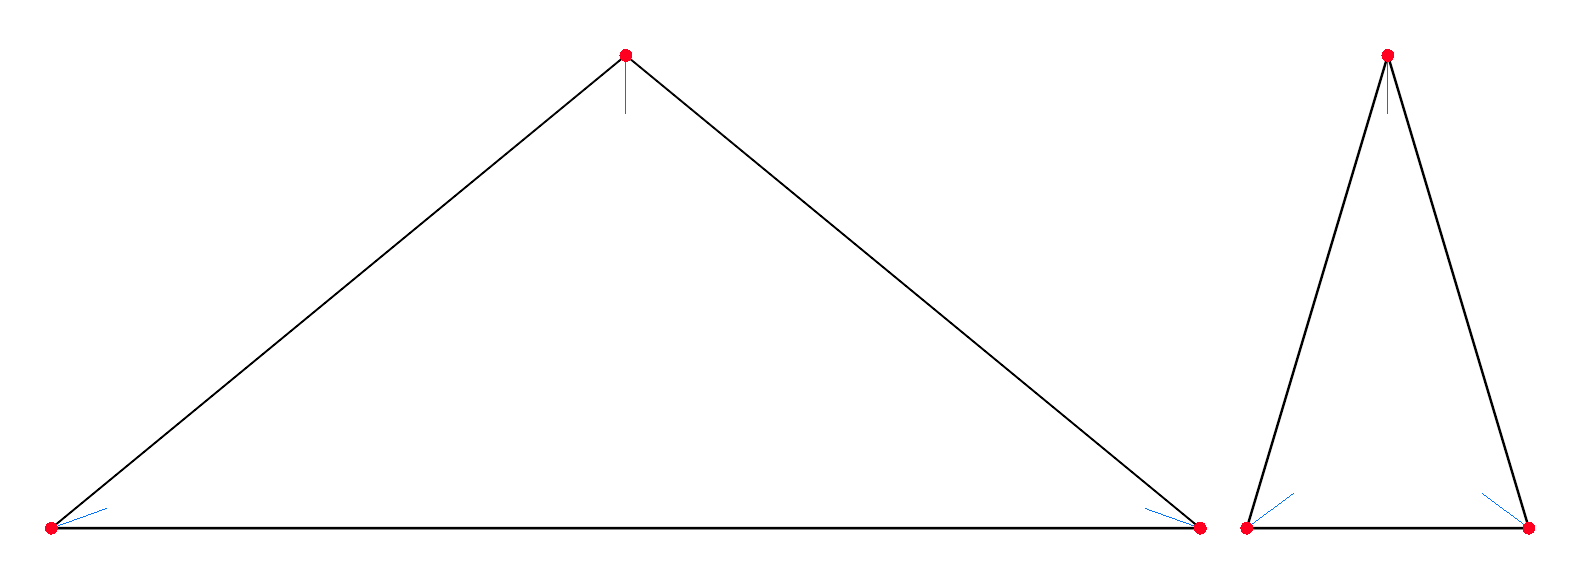
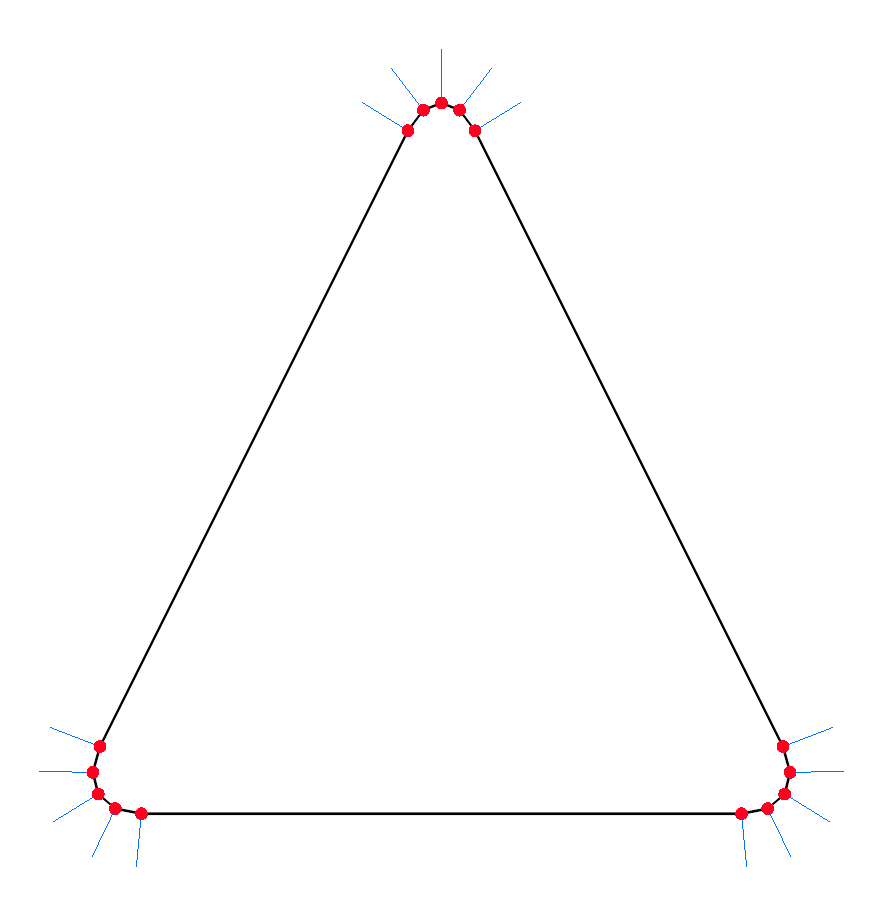
First, we need to define the outer edge of the rounded shape using points or vertices. Let’s use an isosceles triangle as an example. It has three corners, two of which are at equal distances from the third one, making it symmetric around a vertical axis. These points and edges are trivial to define.
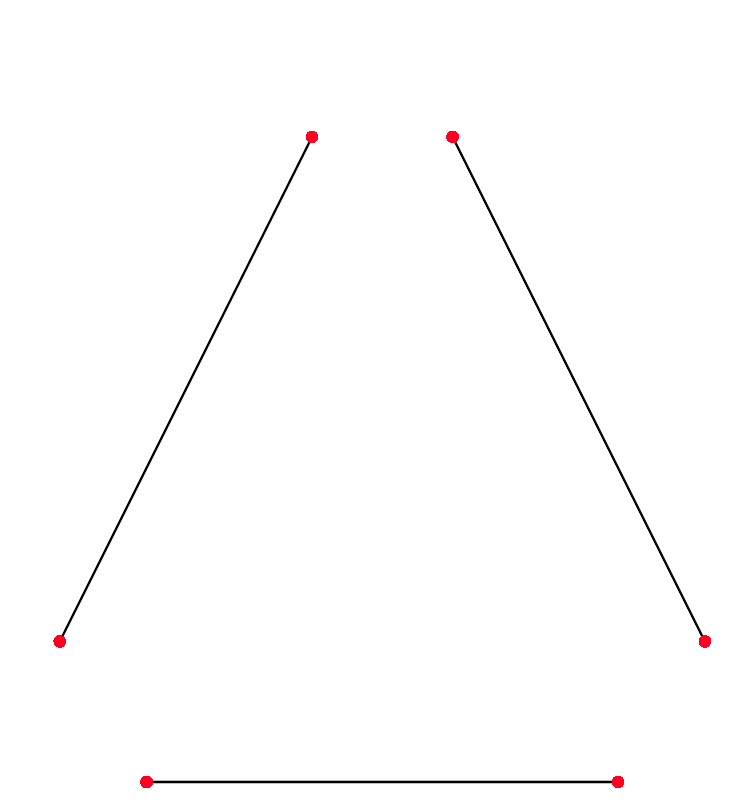
The next step is rounding off the sharp corners. If you look at a rounded shape, you’ll notice that the edges are mostly straight except at the corners, where they’re curved. So, we start by adding a gap at each corner of the shape to create the flat edges. Then, we can fill the gaps with rounded points to make the shape look smoother.
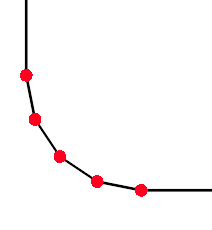
To fill in the gaps with curves, we can place a quarter of a circle at each corner.
This would work great if our shape were a square or rectangle since we’d pretty much be done already. But here we have a triangle, so we need to do a bit more work to make it fit.
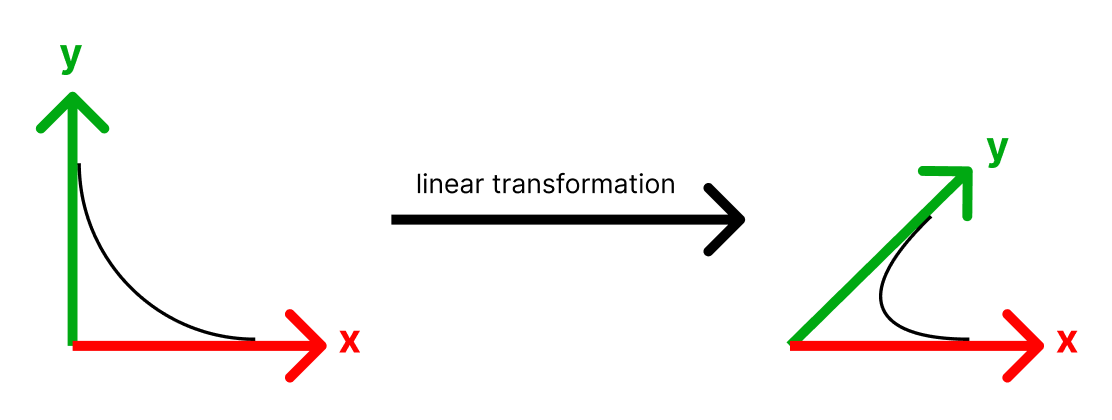
What we can use is a simple mathematical operation known as a linear transformation. This involves stretching and rotating the quarter circle to fit the gap.
More precisely, we’re changing the basis vectors (the x and y axis) of the quarter circle. Instead of ‘up’ pointing up and ‘right’ pointing right, we warp space so that ‘up’ points in the direction of the first edge connected to the corner, and ‘right’ points in the direction of the second edge connected to the corner. This is one way of thinking about what a linear transformation is – it’s changing which direction is ‘up’ and which direction is ‘right’. For example, to transform something to be twice as tall, you make ‘up’ twice as big!
Why not use transparency?
You might be wondering why we defined our shapes entirely using geometry when we could have used some transparent texture or shader for the rounded corners to reduce the triangle count.
There are many other approaches to doing this, such as signed distance fields (SDFs), which give vector graphics crisp edges even as you zoom in. In fact, we already use SDFs to render text!
There were two main reasons we opted against using any transparent geometry for shapes:
Corners change as shapes are resized.
As you’ve seen, the angles of rounded corners change as shapes are resized to different aspect ratios. Using any static pre-generated transparent texture or SDF for rounded corners simply wouldn’t have worked with resizing.
The performance gain isn’t worth it.
Our geometry for rounded shapes is already pretty simple and not a performance bottleneck. We’d need to be rendering an order of magnitude more shapes per frame for simplifying the geometry further to be worthwhile.
Filling it in with triangles
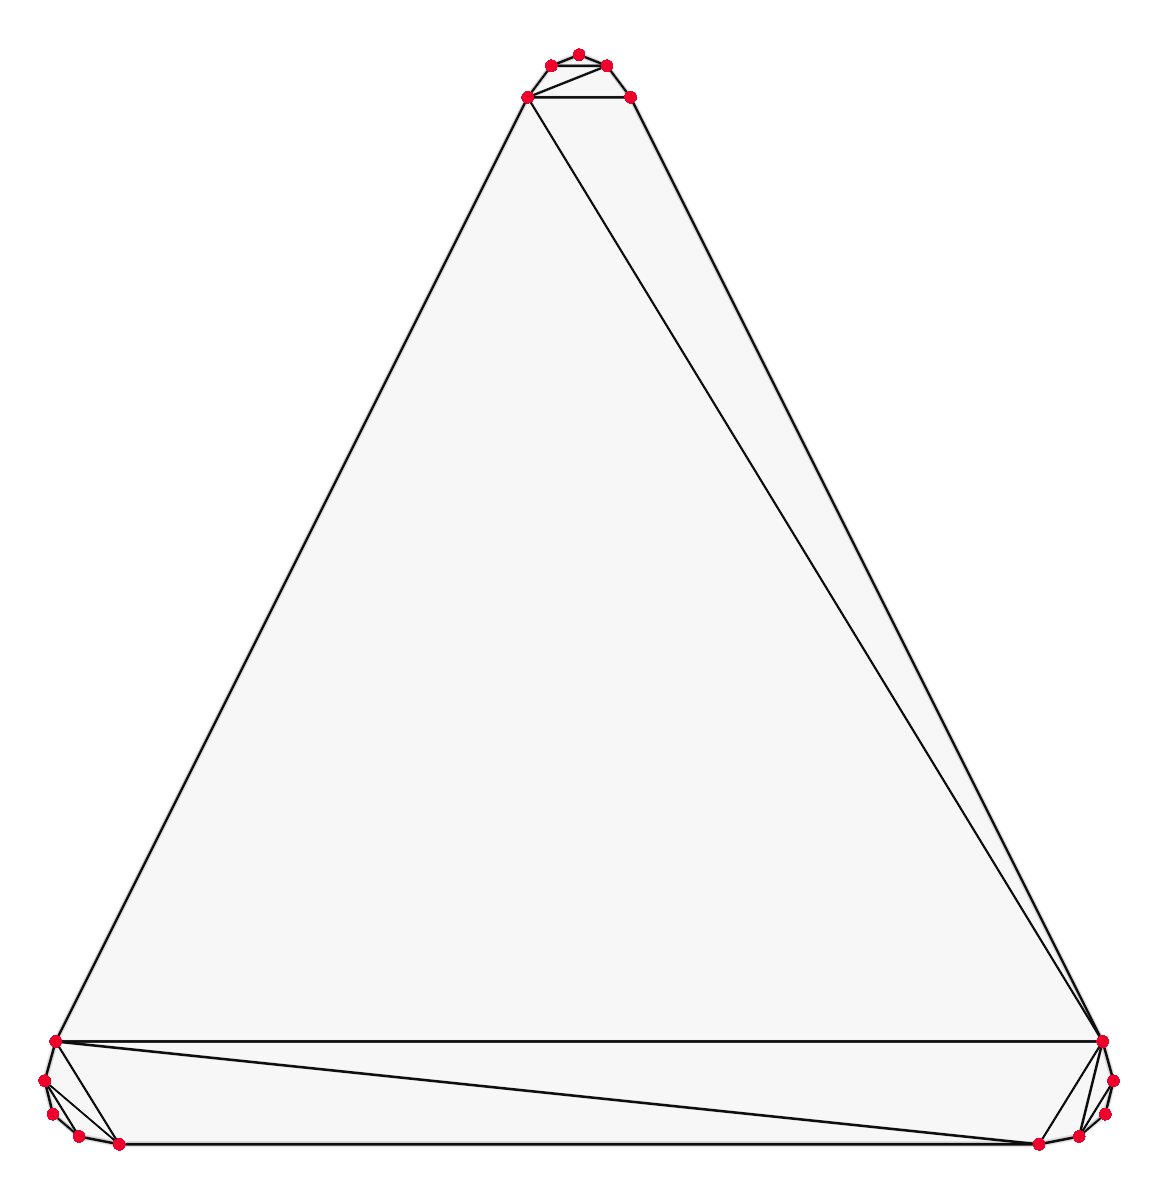
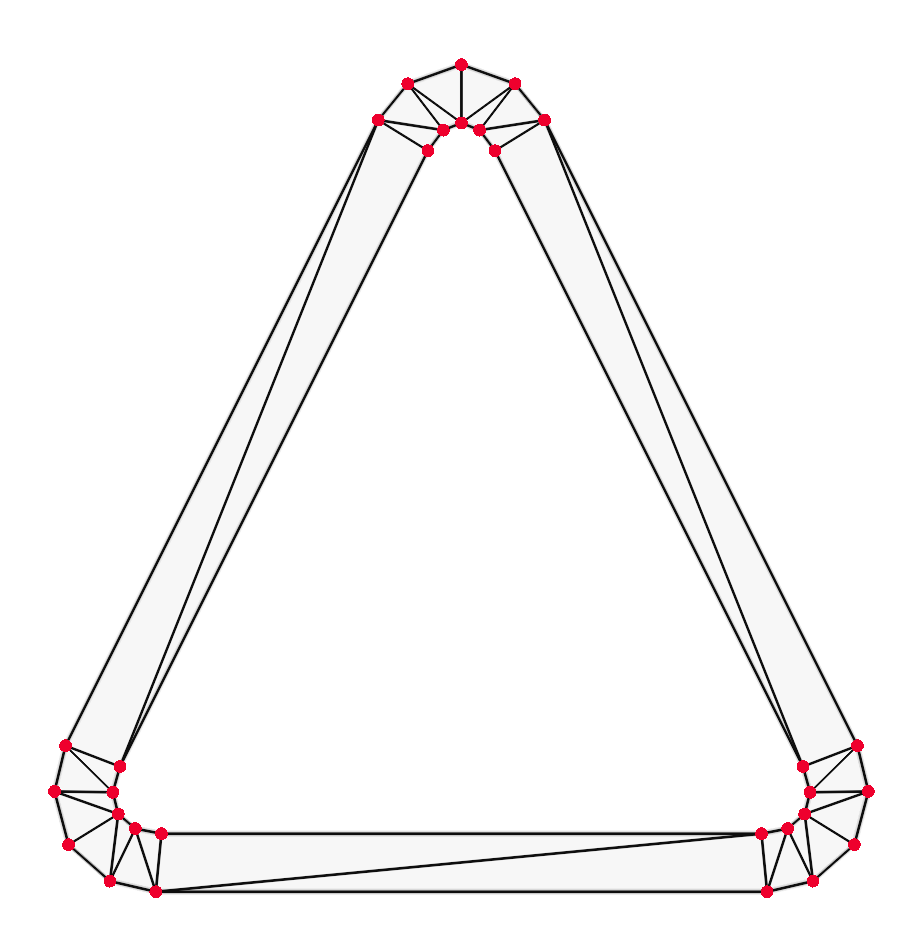
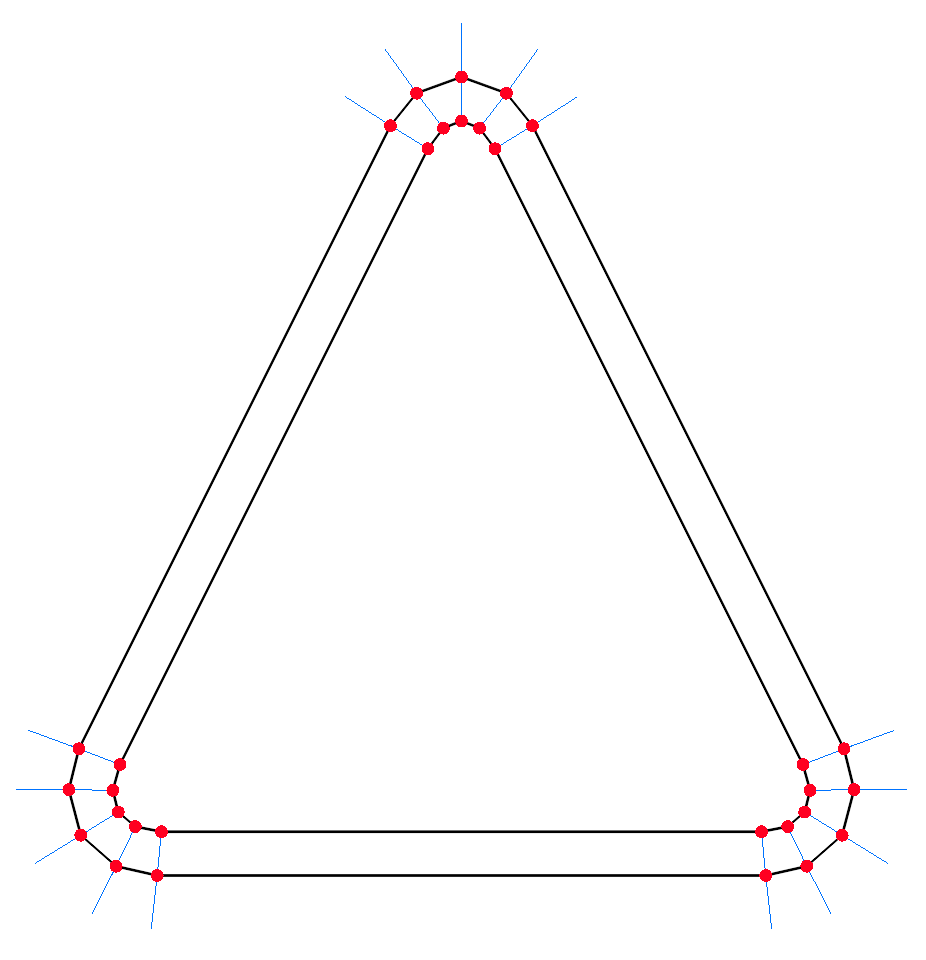
After figuring out the rounded points, we now need to fill them in with triangles for the GPU to render. For this, we used the open-source triangulation library poly2tri – a piece of software that’s been around since 2009 and is quite popular for its speed and efficiency.
When we plug our rounded points into poly2tri we get the following:
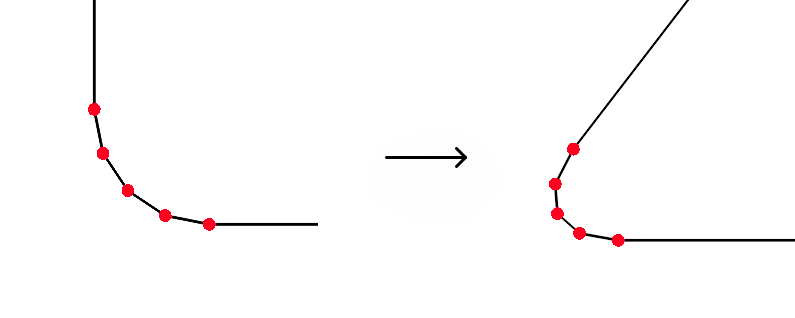
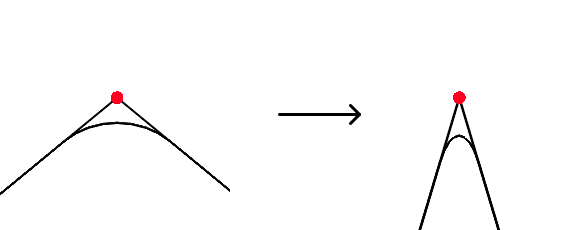
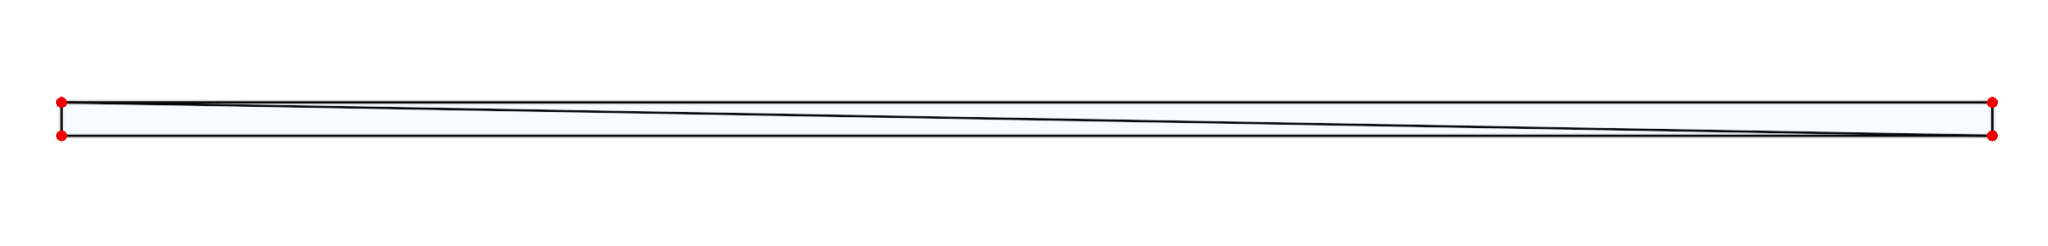
But wait. What if the shape is resized? This would end up distorting the rounded corners.
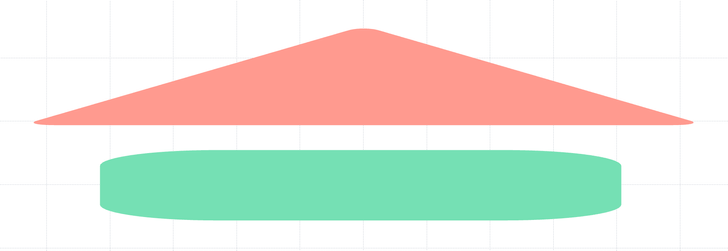

On the left, you can see what this would look like – the tip of the triangle becomes flat, and the rounded rectangle looks more like a loaf of bread. We instead want the image on the right, where the corners remain sharp and retain their proportions.
To fix this, we need to be smarter about how we stretch the shape.
Stretching shapes
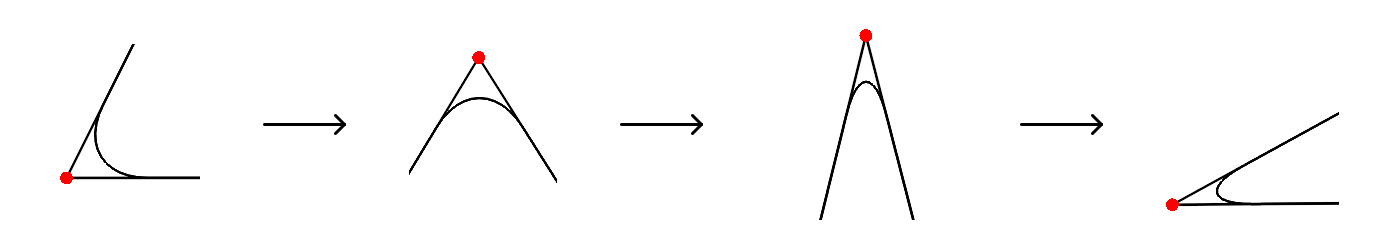
When we resize a shape, its internal angles change. When we make a triangle wider, the bottom two corners become narrower while the top corner becomes wider.
We can use this property to scale the rounded shape without distorting the corners. Instead of trying to scale the entire rounded shape at once as we initially tried, we can instead scale each corner individually depending on how much its interior angle changed.
When the interior angle for a corner becomes smaller, we squish the rounded points in a single direction to be narrower. Likewise, when the interior angle becomes larger, we stretch the points in a single direction to be wider. When you do the math, you end up with the equation tan(newAngle / 2) / tan(oldAngle / 2) as the amount of scaling in one direction you need to perform on a corner to fit everything correctly.
There’s a bit of extra math involved as well. For instance, narrowing a corner like the one in the example above is trivial since we can squish the points in the horizontal direction. But when the corner is at an angle, such as one at the bottom of our triangle, we need to rotate everything to align it vertically, apply the narrowing, and then rotate everything back to get the correct result.
The best part about this approach is that we can quickly do it on the GPU. When generating the initial rounded points, we had to do a lot of math on the CPU to get the right shape. But once we have the vertices generated, we can use a vertex shader to modify them on the GPU. This piece of code runs on the GPU for each vertex in parallel and is used to transform the vertices into the correct position on the screen. We can use a vertex shader to apply the scaling to each corner all at once, avoiding the need to recompute all of the rounded points on the CPU every time a shape is resized.
Empty shapes
We also wanted to have shapes without a fill, allowing a shape only to have a border visible. We needed to be able to render these as well.
To render borders, we essentially take the rounded points, carve out a hole in the middle, and triangulate everything using poly2tri.
But first, we need to figure out the exact shape of the hole. We can do this by using the normal vectors of each vertex. You can think of the normal vector as an arrow pointing away from the surface of something. For example, take your desk – the normal vector for its top surface would be pointing straight up to the sky.
We can use the normal vectors to figure out the shape of the hole. For each point, we move a fixed distance in the direction of the normal vector. When we do this for every vertex, we end up with a nice even outline, which can then be triangulated.
Introducing connectors
Another core feature of whiteboards is connector lines, which can connect two elements on a board or one element to a fixed position on a board. You can also toggle between straight and dynamic connectors, with the latter having its shape determined by a custom path-finding algorithm.
We had previously built a WebGL line renderer that was already being used to render straight lines. It draws each line as a very thin rectangle composed of two triangles.
This was simple to use for straight connectors, which are fundamentally just straight lines that move with their source and target elements. However, dynamic connectors involve rendering curved lines on the screen, which was uncharted territory for us.
Let’s explore how we made that happen.
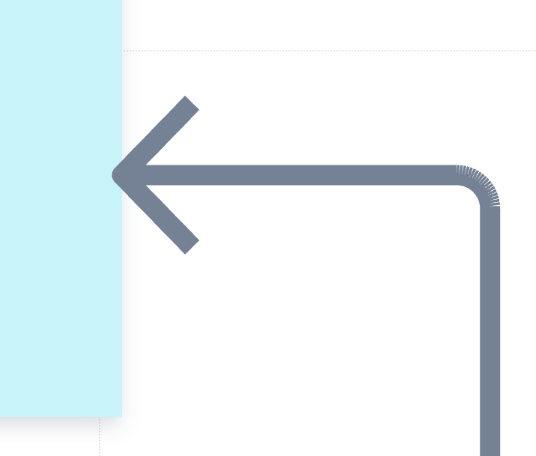
Going from corners to arcs
Unless you only connect things that are neatly aligned and close to each other, most dynamic connectors will inevitably have to ‘turn corners’ to get from source to destination. Our first iteration worked like this with sharp right-angle turns, which looked a bit jarring.
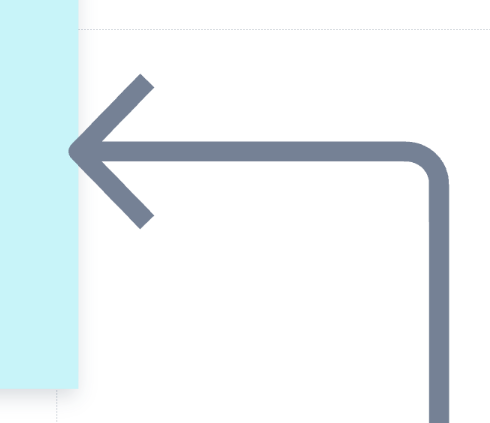
Take the example on the left and consider how you would physically draw it using pen and paper but with a rounded corner:
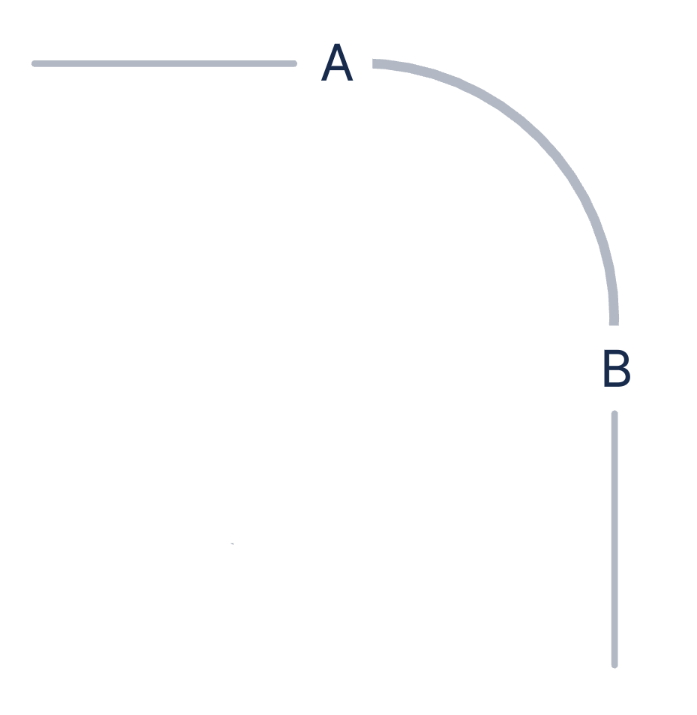
You would draw a line going into A, start rounding out the corner through to B, and then draw a straight line going out of B. Breaking this down further step by step, you would:
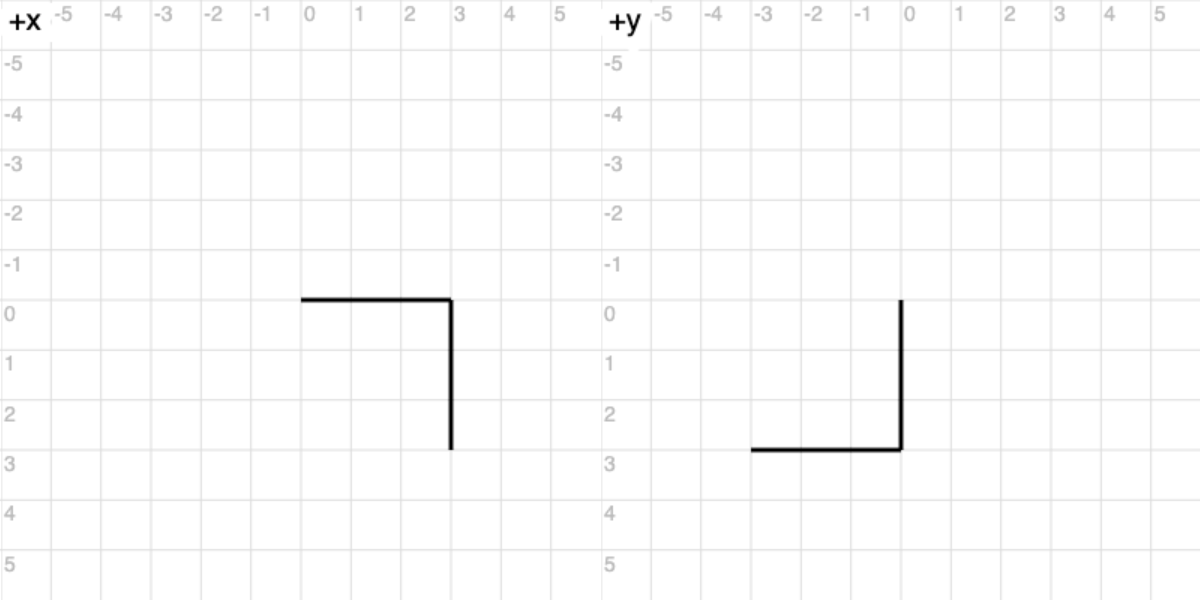
- Start from a point in the top left
- Move a certain distance going right until reaching A
- Curve clockwise by 90°, travelling along an arc with the appropriate centre and radius until reaching B
- Move a certain distance going down until reaching the end
The above example illustrates the basis of our data model, with each arc having a radius, start/end angles, and direction (clockwise/counter-clockwise). This was heavily inspired by the way <path> SVG elements are defined using commands.
Now that we had a data model for describing connectors and how to draw them, we had to actually render them with WebGL. Given that we already had an existing line renderer, we wanted to try and also use it to display arcs. Just like a circle, an arc composed of enough straight lines will look indistinguishable from a real curve, so we added the ability to sample each arc segment into a series of lines that can be drawn on the screen.
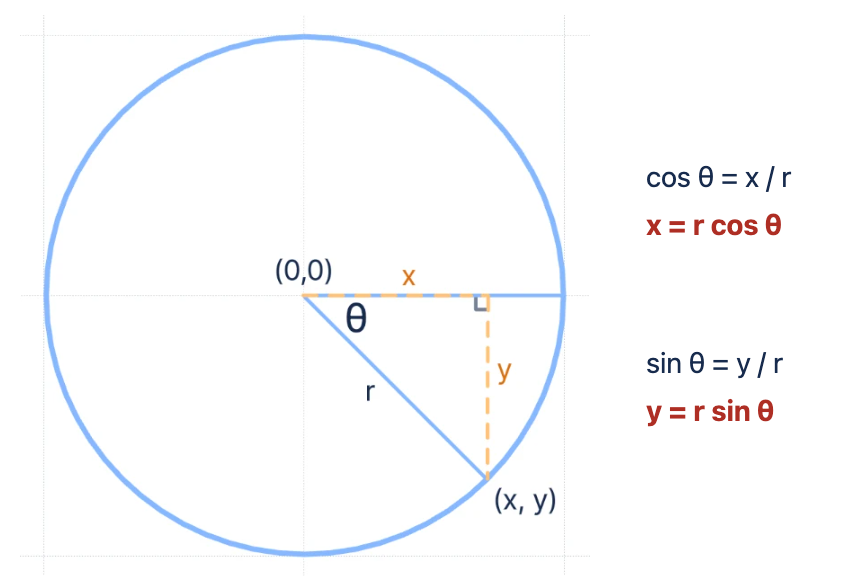
Let’s explore this logic a bit further. Since an arc is just part of a circle, we can derive the following formulae using some basic trigonometry. This allows us to generate a set of points along an arc, and from there, it’s just a matter of ‘joining the dots’ into lines and rendering them with our existing line renderer.
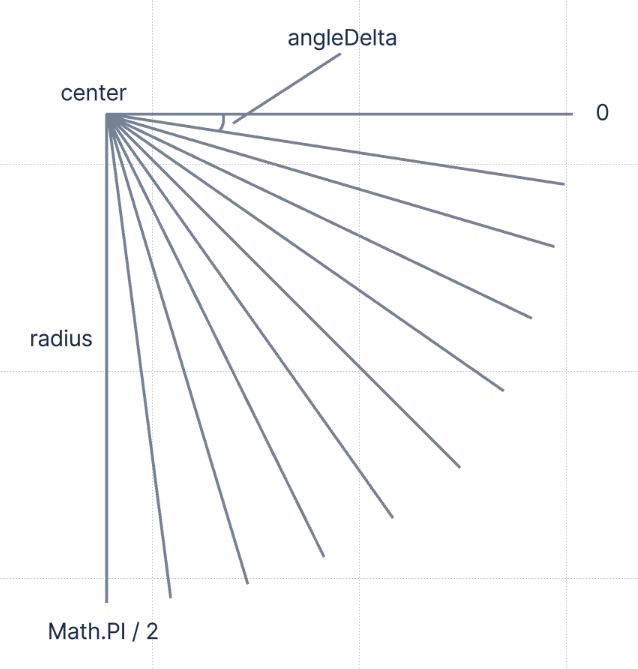
Depending on how many constituent lines we want, we can also figure out an angleDelta by calculating (endAngle - startAngle) / numberOfLines. We can then arrive at each subsequent point by adding a multiple of the angleDelta onto the startAngle.
Finally, when we consider that each connector has a distinct start and end position and a series of line or arc segments that join those positions, we can come up with this algorithm to draw it:
- Begin from the given start position on the board
- Loop through each segment in order
- For each segment, determine whether it’s a line or an arc
- If line: move the ‘pen’ to the next position based on the line’s angle and length
- If arc: break it down into individual lines and move the ‘pen’ accordingly based on each constituent line’s angle and length
- Repeat until reaching the end position
Since our data model retains information about the ‘real’ arc, we could easily swap out this algorithm to use a more purpose-built arc renderer in the future if we decided to build one. That said, it’s unlikely we’d need to. Our line renderer, along with all of our other renderers, are very fast as they use instanced drawing in WebGL. This means instead of telling the GPU to render each line once at a time, we maintain an array of all lines and their attributes, like length or thickness, directly in GPU memory. The GPU can then render 1000 lines all at once – much faster than telling the GPU to draw a line 1000 times.
What about Bézier curves?
Given how ubiquitous they are in vector graphics, you might be wondering why we didn’t use Bézier curves to define rounded shapes or connectors.
Although it wouldn’t be too difficult to sample points along a Bézier curve and plug them into our line renderer, there wasn’t any reason for us to use them. Our shapes and connectors have simple geometry, which can easily be defined in terms of arcs. Expressing the arcs at the corners of shapes and connectors in terms of Bézier curves didn’t provide us with any advantage, so we decided to skip the complexity of dealing with them.
That said, our data model for shapes and connectors remains flexible and separate from any rendering concerns. If we needed to define more intricate curves in the future, we’d likely revisit support for Bézier curves.
Zooming out
This approach, using a series of straight lines to render an arc, worked well at a standard 100% zoom. However, as we zoomed in, we started noticing some visual artifacts. Prominent gaps began appearing when the connectors were viewed at higher zoom levels.
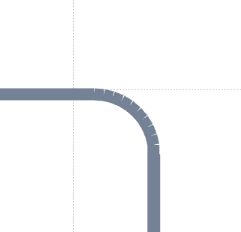
This was happening because we decided to use lines to render arcs. Remember that each straight line is just a very thin rectangle after being composed of triangles. When two thin rectangles join to form an angle, they create a tiny void between them. Imagine trying to arrange a series of books flat on a table to emulate a curve; from afar, the arrangement may seem like a smooth curve, but when you look closer, you’ll spot spaces between each pair of books – similar to the problem with our lines here.
Zooming in enhances these tiny gaps, making them appear more like glaring holes. As line thickness increases, these gaps become even more evident. We needed to come up with a solution.
Initially, we tried dynamically increasing the number of lines depending on the zoom level. We settled on a baseline of 10 lines per arc multiplied by the current zoom level, ensuring a minimum of 10 lines so they still looked acceptable at lower zoom levels.
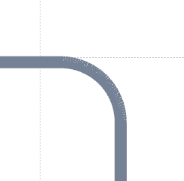
This was a significant improvement, but there were still gaps if you looked closely enough. We could do better – especially since those gaps were more obvious as the line thickness increased.
To address the gaps once and for all, we added overlap between the lines. Essentially, instead of each line being directly next to each other, we made the second line start in the middle of the first one and the third line start in the middle of the second one. This helps avoid visible gaps when the angles of adjacent lines deviate from each other.
In simpler terms, instead of having:
- Line 1 covering 0 – 5°
- Line 2 covering 5 – 10°
We have an overlapping pattern:
- Line 1 covering 0 – 5°
- Line 2 covering 2.5 – 7.5° (a ‘midpoint line’)
- Line 3 covering 5 – 10°
This tactic ensures gaps created from previous lines are conveniently filled in by the overlapping lines. While this does mean we are rendering more lines, we can comfortably do this because our line renderer uses instanced geometry. Additionally, when zoomed in, a customer will naturally see less content and lines, allowing us to perform visibility culling to further improve performance.
The result? Dense, continuous curves that look smooth at any zoom level.
Summing up
Building a smooth and performant experience for our customers can sometimes be a lot of work. While we could have written a few lines of SVG for shapes and connectors and avoided delving into WebGL, we wouldn’t have created an experience that worked nearly as well or seamlessly.
Take this test we ran as an example, rendering 1024 rounded triangles.
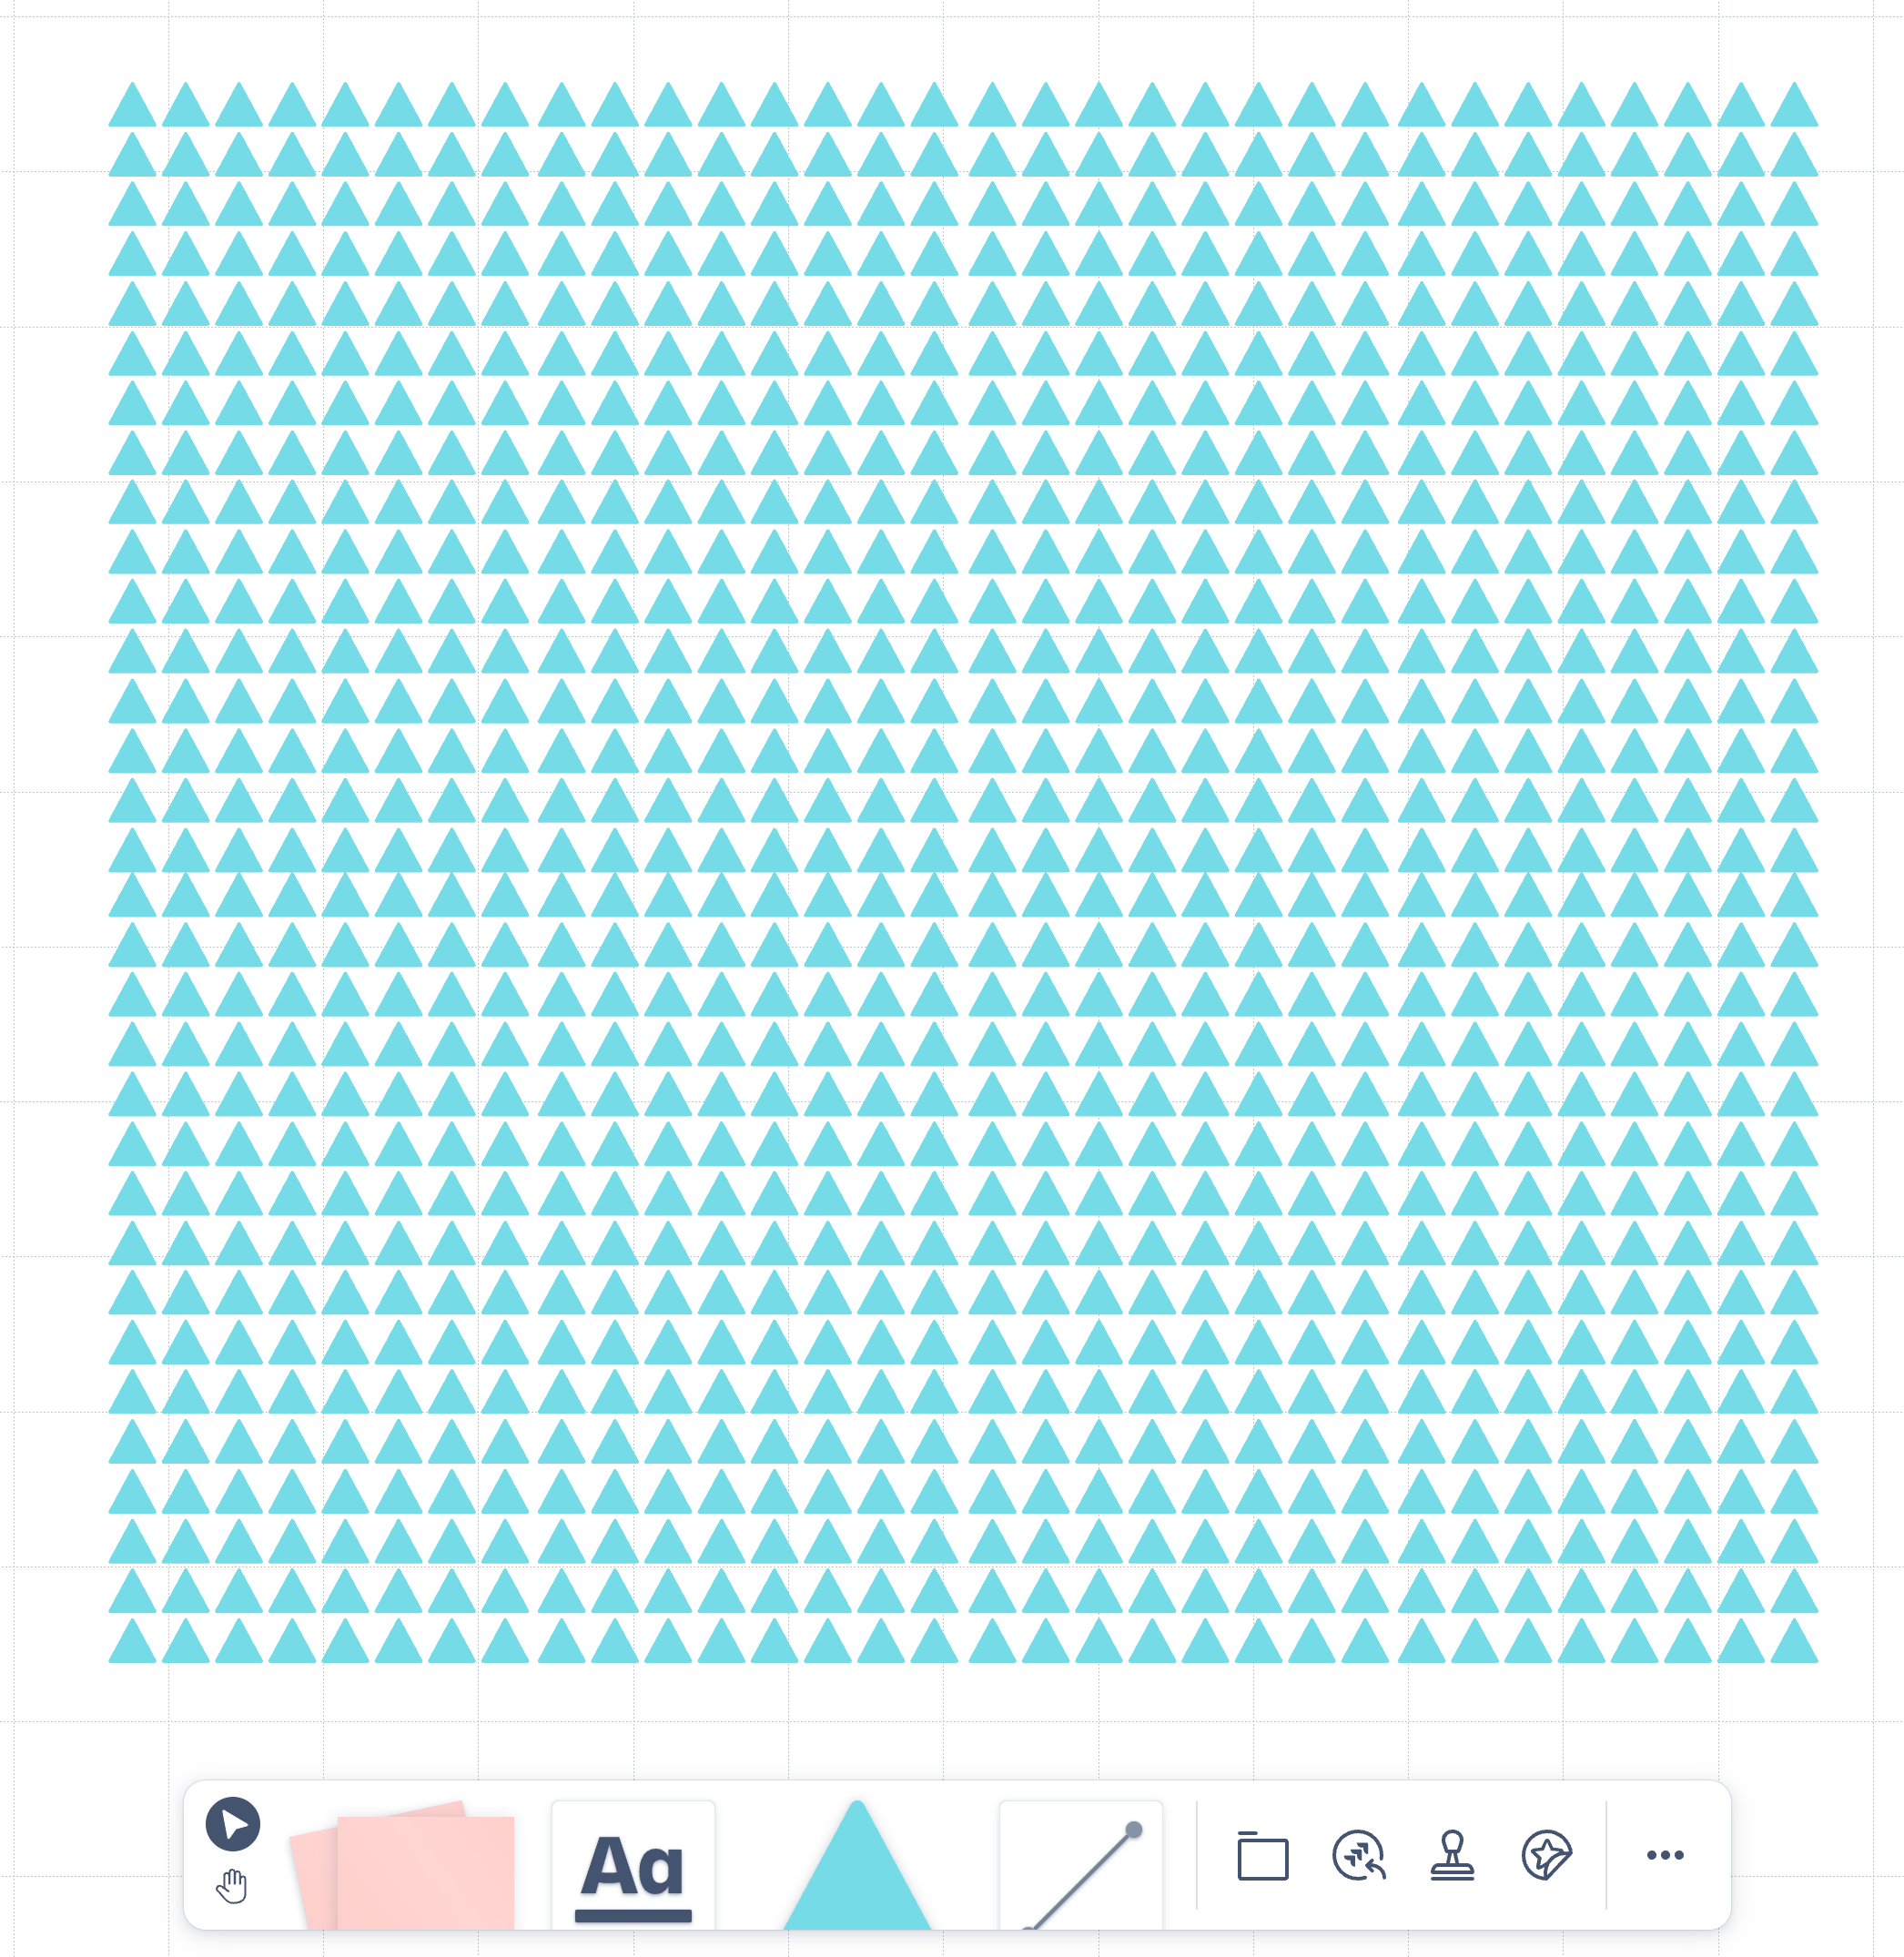
When we panned and zoomed the board using SVGs to draw each shape, we could only achieve 28 FPS. To the customer that’s 50% slower than our 60+ FPS WebGL renderer, but frame rate alone doesn’t tell the whole story.
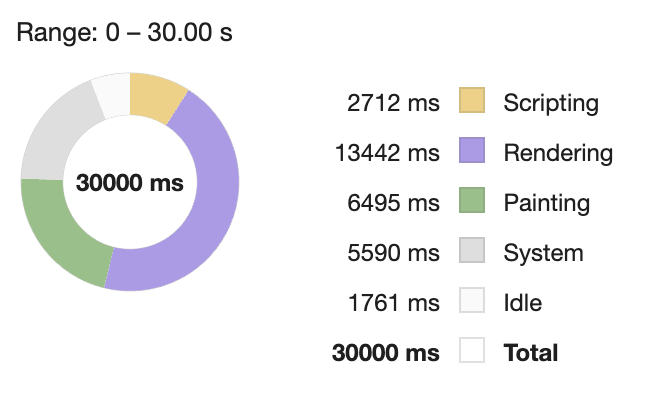
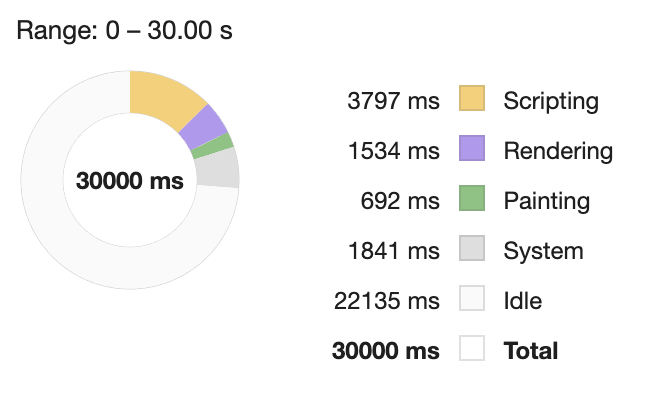
When you look at a performance profile, you can see a much bigger difference! The rendering phase, where the browser processes style and layout changes, is 893% worse when using SVGs. Likewise, the painting phase, where the browser actually draws things to the screen, is 839% worse.
By optimising for what the computer can do easily rather than what the developer can write quickly, we can better serve our customers and push the boundary of what a web application like Confluence whiteboards is capable of.
The beauty of engineering lies in harnessing the available technology to its fullest potential and delivering something beyond the ordinary. We don’t hesitate to take the path less travelled if it means we’ll arrive at a superior result in the end. We truly believe that this commitment to excellence, driven by our engineering principles and customer-first approach, brings Confluence whiteboards to life in a remarkable way.