
Rendering like Butter – a Confluence Whiteboards Story
At Atlassian we build software which unleashes the potential of all teams.
As cross-disciplinary teams ourselves, we empathise with one key fact: work and collaboration is messy. Indeed: how often have you found yourself brainstorming ideas and immediately turning them into a perfect arrangement of tasks others can collaborate on, or into a pixel-perfect Keynote presentation? Never! The reality is: collaboration is a lifecycle which begins with ideas and ends with action.
This is why we built Confluence whiteboards, an Atlassian-flavoured digital whiteboard, which allows you to collaborate freely with your team on an infinite canvas, and move from ideas → action .
In this blog, I’d like to share some of the engineering challenges the Confluence whiteboards engineering team has tackled as part of building out this digital surface for customers of Atlassian Cloud. In particular, this blog will focus on how we render Confluence whiteboards using a homegrown rendering engine.
We’ll cover:
- Why we decided to focus on rendering 1000s of elements at ≥ 60FPS
- Uni-directional interaction management, featuring state machines
- Architectures from the world of game development – Entity Component Systems
- Rendering fast with WebGL and JavaScript, and the associated quirks of doing so
- Visibility culling with virtual tiling
– and much, much more .
Let’s dive in: Welcome to the journey of a pixel in Confluence whiteboards
Setting the scene: Whiteboards get massive
Upon initial research into the digital whiteboarding space, it seemed like there was quite a bit of over-engineering going on. For example: many whiteboards out there support rendering of hundreds of elements with realtime updates. It forced us to ask – is all of that necessary?
Well, it is indeed. Whiteboards get big – very big:
An example of a whiteboard from a Confluence customer. It’s massive!
As we talked to more and more customers, it became clear that digital whiteboards are seen as a ‘living brain’ for individuals and teams, re-used across days and weeks with huge amounts of content. Being a highly tactile medium, customers expect a smooth, low-latency surface they can interact with too.
This led us to set the following goals as an engineering team:
- Scale: Rendering 5K elements on a board with 50 realtime collaborators.
- Performance: Rendering at 60 FPS minimum for low-latency interactions.
We also wanted to remain nimble in our architecture to allow us to pivot & iterate fast, in a competitive market. Hence, we also set ourselves an additional third goal:
- Flexibility: The ability to build and iterate fast.
If you think this is a set of ingredients with a tight balance – agreed, it is! Despite this, we’re super proud of what we’ve achieved in Confluence whiteboards so far. Without giving anything away yet, we are comfortably achieving all three of our goals above, rendering huge boards performantly, and building on top of flexible foundations.
Let’s dig into our homegrown rendering pipeline, aptly named Canvas .
The Canvas rendering pipeline
Summarised in a sentence, the Canvas rendering pipeline is a uni-directional, multi-phase rendering engine, which executes over a persistent game loop.
Breaking this down:
- Uni-directional: Data flows through different system units from left → right.
- Multi-phase: Each phase answers one fundamental question, and prepares for the next phase of the pipeline.
- Persistent game loop: We
executeour application once per frame (60 or 120 times per second, depending on your display’s refresh rate).
For example, here’s a simple game loop using the requestAnimationFrame API available in all modern browsers:
import { player } from '@game/player';
import { obstacles } from '@game/obstacles';

const loop = () => {
  player.move();
  obstacles.forEach(obstacle => {
    if (obstacle.collidesWith(player)) {
      player.health(-10);
    }
  });

  // Invoke the loop for another frame.
  window.requestAnimationFrame(loop);
};

// Kickoff the loop.
window.requestAnimationFrame(loop);
As the above name suggests: the Canvas rendering engine is heavily inspired by architecture patterns from the gaming industry Inspired by our game development peers, each frame is executed in independent phases. This gives us logical ways to break down the activities we need to perform in a frame, and assign ownership of different routines, pinpoint bugs + divvy up architecture investments.
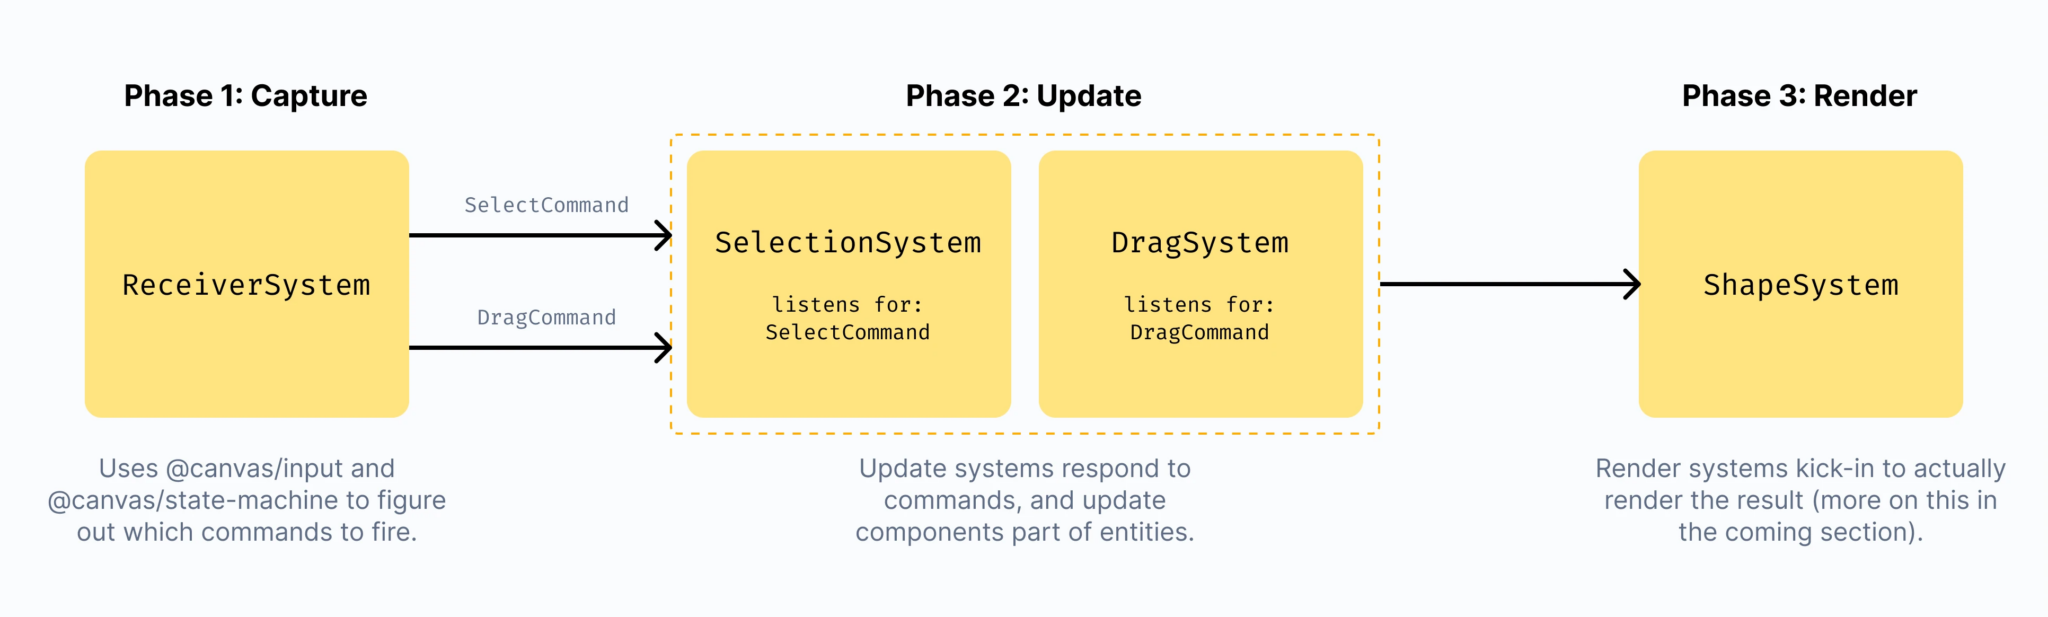
In each phase (Capture, Update, Render) we ask one question and perform one corresponding job:

The Canvas rendering pipeline
I’ll be describing each of these phases for the rest of this blog. A note: All references to @canvas refer to internal packages built by the Confluence whiteboards team.
Phase 1️⃣: Capture – Input + State machine
In the Capture phase, we make use of two abstractions:
@canvas/input– a class which registers DOM event listeners and collects input events triggered on thebodyof the whiteboard.@canvas/state-machine– a performance-optimised Finite State Machine (FSM) implementation built in TypeScript for strongly-typed state definitions.
Our goal in this phase is to figure out what a user is currently doing.
To do this, we look at a stream of events captured by our input capture (1) and feed them into our state machine (2). Firstly, for each event in our input capture queue, we perform hit testing. This is done to compute which element a user is interacting with, since DOM based hit-testing is not enough for a WebGL-based application (WebGL-rendered elements cannot have DOM listeners attached to them). After we have computed the target of an interaction, our state machine computes what the interaction is. E.g., it may determine the user is dragging or selecting an element.
Combined together, this results in the following:
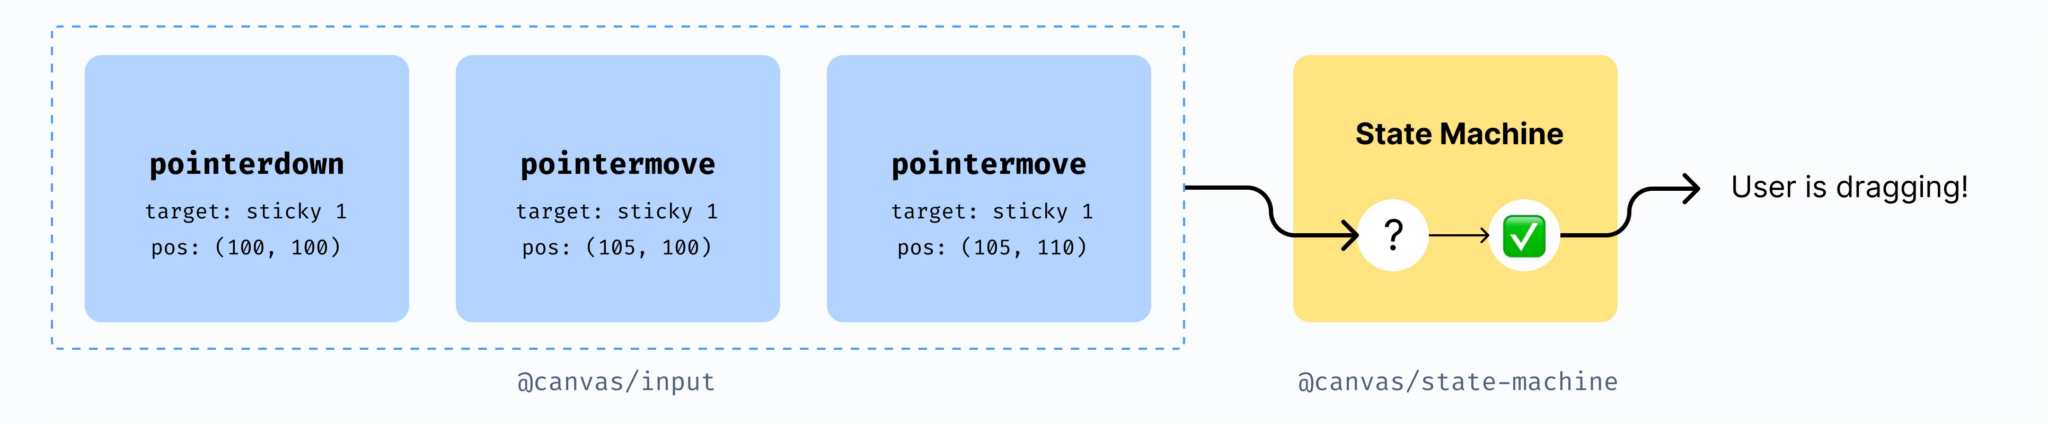
Example of a stream of events which lead to a selection and then a drag.
Some insights from this phase include:
1️⃣ We centralise handle all DOM event handling in one place
Input handling is hard.
From detecting double clicks to reflecting complex user requirements into code, input handling needs special attention. To reduce (1) the surface area for bugs, (2) the # of event listeners invoked per frame for performance reasons, and (3) assert the correctness of our input handlers independently for different input devices (keyboard, mouse, clipboard, etc.), we centralise the collection of all input events in @canvas/input and use raw DOM APIs to achieve event delegation on document.body rather than registering events per element on the board.
What finally emerges from this is a queue of events mapped to a clean set of TypeScript interfaces, which look a bit like this (represented as JSON for brevity):
{
  type: 'pointerDown',
  target: 'sticky-note-1',
  properties: {
    x: 10,
    y: 15,
  }
}
2️⃣ We model all interactions using a state machine
We do not believe interaction management on a digital whiteboard is possible without a state machine – whether it be an implicit or explicit one.
Here’s one of many examples why. Let’s pretend you have triggered pointerDown on a sticky note. What happens when you move your cursor a little bit and lift your finger? We can either (1) put the sticky note in focus, allowing you to type in it (i.e., treat it as a double click), or (2) drag it to a new position. In reality, we allow you to drag whilst your pointer is down, and only focus the sticky if the pointerUp we detect when you lift your finger is not far from the initial pointerDown – is roughly 5px from where you started. This is one sample of many complex interactions which you need to handle when building spatial apps. It truly becomes a combinatorial explosion of complexity if left untamed!
A FSM is a perfect fit for modelling this kind of behaviour. We make extensive use of guarded transitions to capture and describe these complex interaction rules declaratively. As of today, our application is composed of 15+ state machines which describe a huge number of interaction patterns. Across all our state machines, we have modelled ~80 distinct states, and upwards of 300 guarded transitions.
3️⃣ We built our own state machine for performance reasons
Whilst technology re-use is essential when building new products and experiences, embracing complexity is sometimes necessary to meet your goals and pursue world-class customer experiences.
When surveying options for our state machine layer, most were either too slow, or lacked the features we needed at the speed we needed. On a benchmark with our required feature-set, the popular XState library was able to perform ~100K operations per second, including state transitions. Comparatively, our @canvas/state-machine implements a subset of the StateCharts spec and performs ~90 million operations per second. This translates to <0.1ms to process a stream of events at the beginning of a frame. We purposefully built this to be a hierarchical state machine, as many interactions can be modelled using nested states (e.g., dragging is a substate of selecting).
At the end of the Capture Phase, we know what the user is doing, and tell the Update Phase about it by scheduling a DragCommand (extending the above example) using the Command Pattern. This is a pattern often applied in gaming applications to loosely couple different parts of an application. In our rendering engine, we use it to decouple the work we need to be done from where it is done.
Phase 2️⃣ Update – Entity Component System
In the Update Phase, we make use of an Entity Component System (ECS) to model the state of the rendering engine and the elements part of it. An ECS is composed of the following concepts:
- Entity: A bag of Components, without any notion of identity.
- Component: Small pieces of data, used to model a behaviour or attribute.
- System: A class which queries for entities with particular components, and operates on them.
ECS has become a widely accepted way to architect games in modern game engines including Unity and Rust-powered Bevy, as well as in modern game development circles. ECS is an alternative to scene graphs, making use of Data-Oriented Design. In this approach data and behaviour are modelled whilst being highly aware of how underlying hardware manages memory. For example, Data-Oriented Design is employed in ECS implementations to optimise for key performance characteristics such as cache locality.
Here’s what a ‘Sticky’ could be modelled as using Object Oriented Design vs Data-Oriented Design. Whilst it primarily boils down to Composition vs Inheritance, the primary outcome achieved by the ECS-inspired Sticky is that every attribute of Sticky is managed in contiguous blocks of memory:
// An object-oriented approach:
class Sticky extends
  Element,
  SelectableElement,
  FocusableElement {}
// A data-oriented approach:
class Sticky {
// All of the below are managed in a contiguous
// block of memory with instances of the same type.
private position: PositionComponent;
private selectable: SelectableComponent;
private focusable: FocusableComponent;
}Whilst this can be achieved even with Object Oriented Design utilising techniques such as Object Pooling, an ECS builds upon this concept from the ground-up. In particular, systems operate on specific component combinations using queries, iterating over contiguous blocks of memory. Whilst JavaScript doesn’t offer the low-level access to memory a game built in C++ or Rust might (unless one ventures into WASM-based techniques, which we’ll leave as a subject for another blog), Typed Arrays offer an approximation supported in modern browsers and greatly aid in reducing one’s memory footprint.
We use @lastolivegames/becsy for our ECS – the heart of our @canvas/renderer abstraction. Our ECS’ main job is to (1) react to Commands fired from the Capture Phase, or (2) react to any other changes in the components part of entities and operate on them using queries. Notably, the Capture and Render phases technically reside inside of our ECS (at the very start and end of a frame), but are still conceptualised as separate phases. Extending the example we dug into above of dragging a sticky note, our ECS performs the drag in the following manner – as you can see, it brings together all three phases:
A simplified example of the DragSystem looks like:
import { System } from '@lastolivegames/becsy';
import { DragCommand } from '@canvas/command';

class DragSystem extends System {
  initialize() {
    this.command(DragCommand, (entity, delta) => {
      entity.position.x += delta.x;
      entity.position.y += delta.y;
    });
  }
}
And that’s your drag, done! Some insights from this phase:
1️⃣ The memory and performance characteristics of an ECS are fantastic
Our Update Phase takes 1-2ms, even on busy frames. This is largely due to the way an ECS encourages you to organise your application base on common behaviours. As a result, unneeded branches and code duplication are avoided all whilst optimising memory usage and access patterns. The way in which @lastolivegames/becsy utilises Typed Arrays greatly aids us in this, by reducing the amount of memory pressure our application faces due to JavaScript Garbage Collection events.
Lastly, as we’ll cover further onwards, whilst minimising the amount of JavaScript we execute on each frame continues to be an explicit goal for us, we’ve also learned that careful use of JavaScript still yields extremely performant experiences. Modern browsers have been hyper-optimised to execute JavaScript at speed and scale. Avoiding JavaScript GC events and designing your application around efficient data structures and algorithms might just be enough. Measure it and give it a try!
2️⃣ The flexibility an ECS affords is huge for a digital whiteboard
Our goal of achieving a nimble architecture was satisfied by using ECS as an architecture pattern. For example, since the advent of Confluence Whiteboards, we’ve built three text renderers. Over the course of doing so, we’ve only had to modify a single ECS system to change which renderer we are plugging into our architecture. Beyond that, all 100+ ECS systems in our application have remained unchanged.
This achievement of loose coupling between (1) conceptualising a behaviour of our overall application (rendering of text) and (2) the underlying implementation detail (the algorithms and rendering techniques at play) has been immensely beneficial for iterating in a pragmatic manner. Just recently, we faced this once again with our addition of a VisibilitySystem which attaches a VisibleComponent to entities in the viewport. We were able to choose a data structure specific to the problem without impacting the rest of our architecture – we chose an architecture which affords us choice, not one which locks us in.
3️⃣ Careful design in an ECS means implement-once doesn’t remain a dream
Questions like, “What should a component be – are we being too granular or too broad?” are tricky to answer when no entity has a specific ‘identity’ in an ECS, as everything is a bag of components. Once we got the hang of this however, key behaviours such as dragging were implemented once for the first element type which needed it, and carried across to all of the newer element types we built after that by simply attaching a DraggableComponent (commonly known as trait components in ECS design). From there, the system responsible for dragging would see the ‘new’ element and implement the behaviour.
Today, Confluence whiteboards supports 15 types of elements on a whiteboard including sticky notes, sections, shapes, and more. For each of these, we have been able to re-use entire interaction patterns by simply attaching ‘traits’ to them, and iterate at an increasing rate on the features we are building. For a recently added element (sections), copy, paste, cut, selection, dragging, deleting, undo, redo, duplicating and a whole host of other interactions were re-used without any additional code being added.
Once state mutations have completed in the Update Phase, we go to the last phase – Render. By the end of this phase, our ECS has gone from state A → state B, where the delta between A and B can be described as a change in components belonging to entities in the ECS.
Now, we need to figure out what to render and what to re-render.
Phase 3️⃣: Render – WebGL rendering engine
Lastly, we end up in the Render Phase. This phase makes use of our homegrown WebGL rendering engine (@canvas/gl) for high-performance rendering of huge numbers of elements. We make use of our Rendering ECS Systems in this phase, with a light transformation taking place first from Entity → RenderingPrimitive[] as displayed below. This transformation takes place based by mapping the data inside of specific ECS components on each entity into rendering primitives, as shown below:
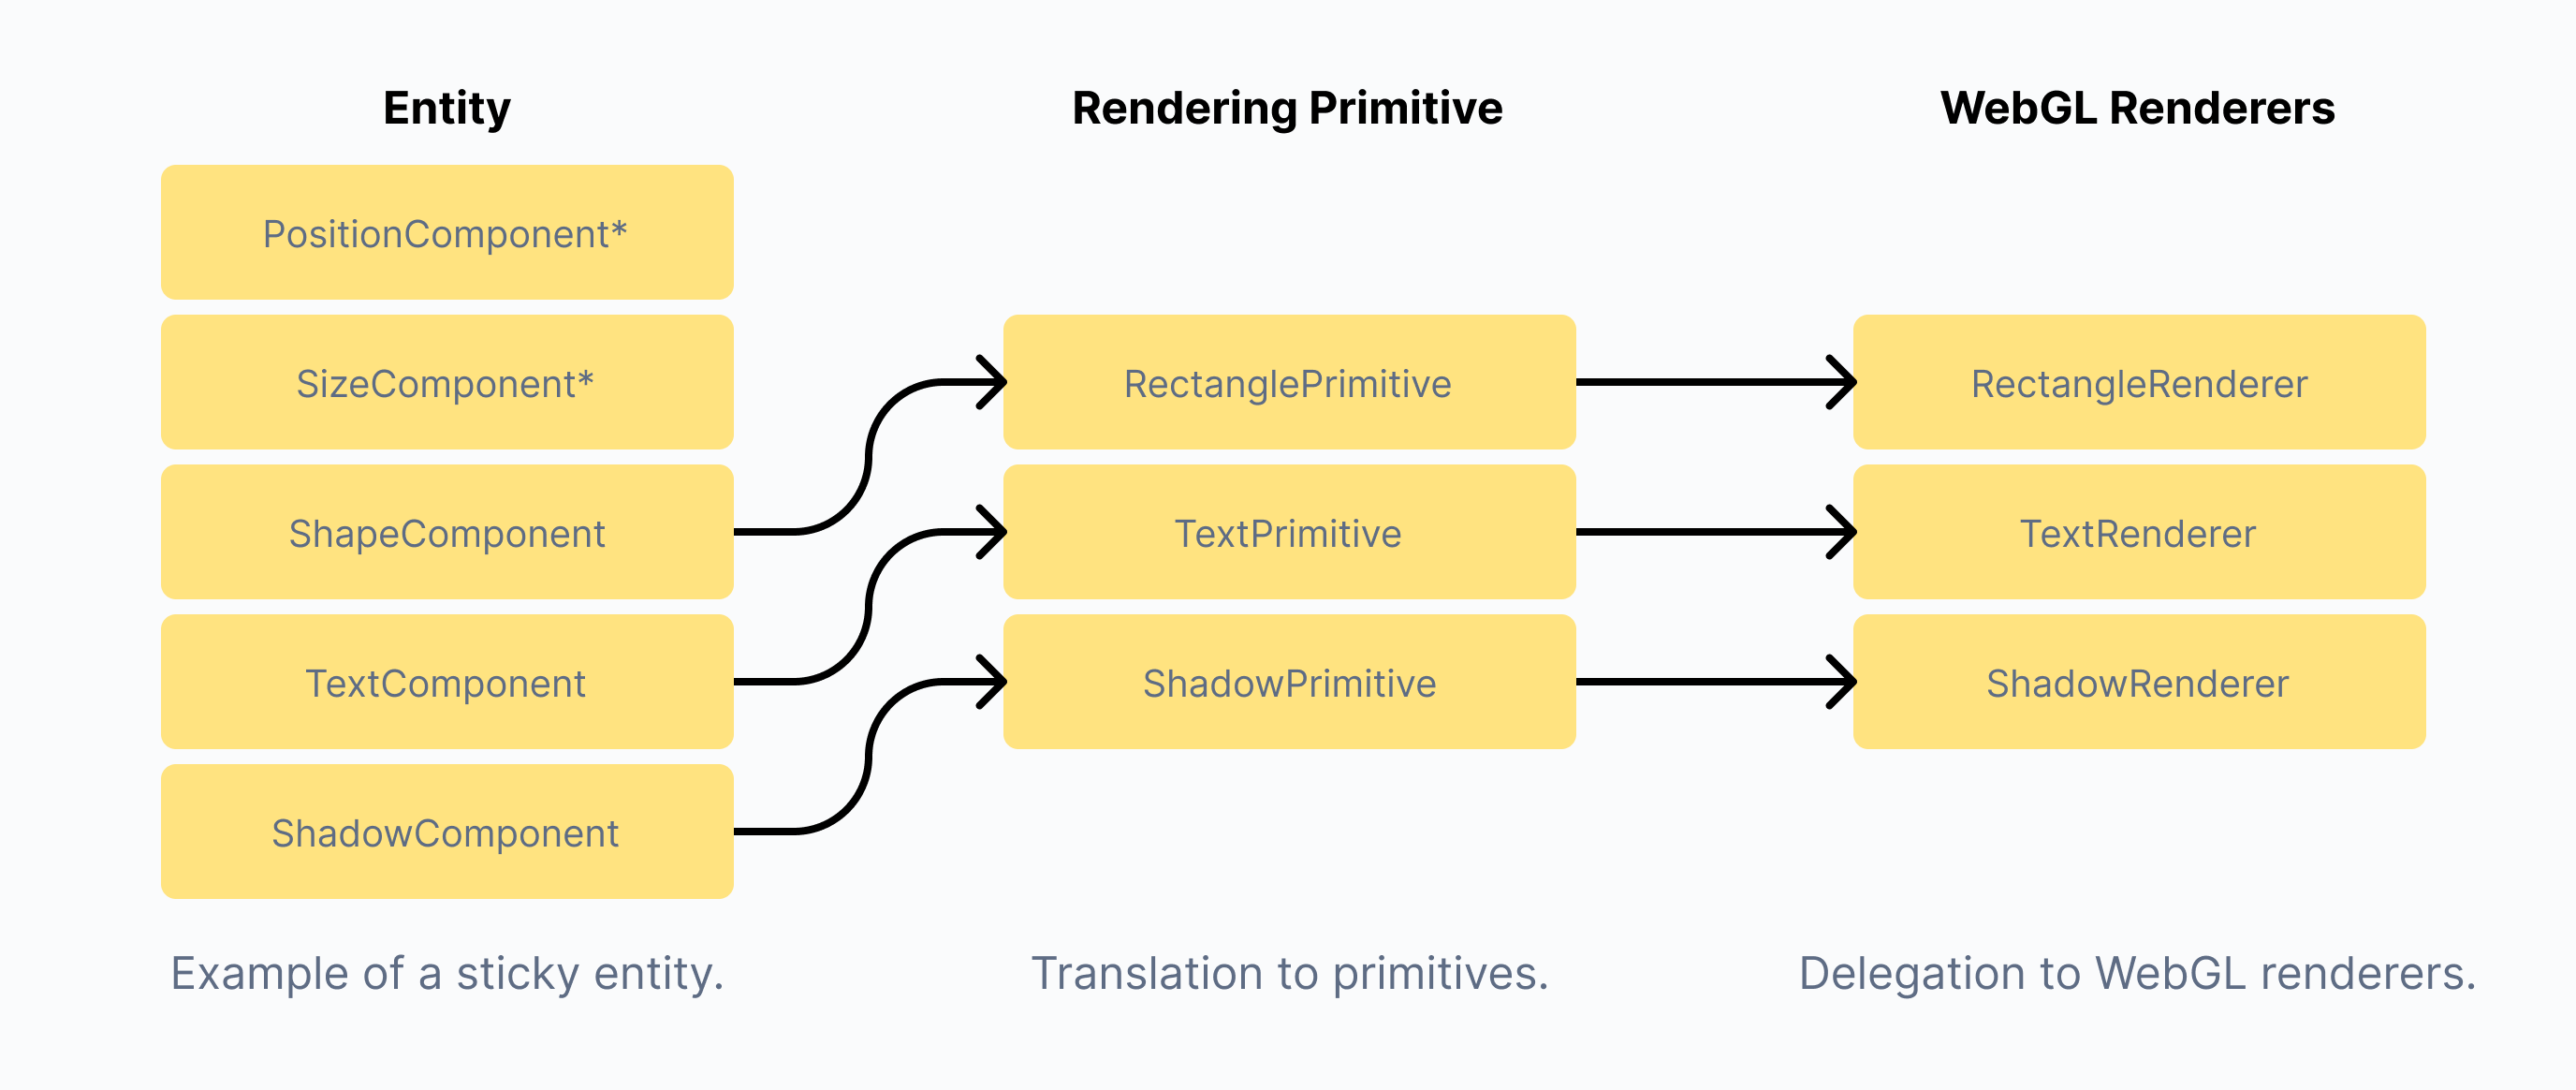
Transformation from ECS entity → a rendering primitive for WebGL.
We have one renderer per rendering primitive. Whilst most of them are implemented in WebGL, we once again leave this as an internal detail – some are implemented in DOM to bridge with existing Atlassian Platform components, whilst some are in WebGL for high-performance rendering purposes. Combined with our transformation to rendering primitives, we end up with an ECS system rough like below.
class RectangleSystem {
  entities = this.query(q => q.with(RectangleComponent));

  execute = () => {
    entities.forEach(entity => {
      this.shapeRenderer.upsert(toRectanglePrimitive(entity));
    });
  }
}
After being triggered from the ECS our WebGL renderers take over and render 1000s of objects at incredible speeds – such is the power of modern GPUs!
For the keen-eyed, you may be wondering – why not re-use the same abstractions across the Update and Render phases? We’re a big fan of carefully designing abstractions – over-abstracting too early is never a good idea. In the case of our rendering primitives, loose coupling was essential to allow our rendering layer to evolve independent of other layers our application (most likely WebGPU in the future).
Today, Confluence Whiteboards are rendered using WebGL2 – an immediate-mode rendering technology built into all modern browser engines for 2D and 3D graphics. WebGL affords one unique ability which no other frontend JavaScript framework does today – a way to directly communicate with your GPU, through the magical language of shaders. We chose WebGL because it’s fast, very fast.
For a rough idea, here’s a benchmark from an experiment we did in mid-2021, where we compared implementations of DOM, WebGL libraries and raw WebGL for the most expensive interaction on a whiteboard – zooming out and panning on a large board (50K elements, each with variation in size, colour and amounts of rich-text content):
| DOM + React | React Three Fibre | PixiJS | Raw WebGL | |
|---|---|---|---|---|
| p50 | 9.47ms | 7.39ms | 4.14ms | 2.92ms |
| p90 | 11.26ms | 10.06ms | 8.23ms | 3.37ms |
| p99 | 12.92ms | 14.19ms | 17.07ms | 3.87ms |
Some insights from this phase:
1️⃣ We minimise draw calls using GPU instancing
All renderers in the Canvas rendering engine make use of GPU instancing. This is a technique in which the same geometry is rendered multiple times each by the GPU with separate shader variables – i.e., separate ‘instances’. This minimises the most expensive part of WebGL programming in JavaScript: the work required to instrument a draw call. By utilising instancing, rather than doing 1000 draw calls for 1000 rectangles, we reduce it to 1 by storing the data for each shape in one instanced buffer. This means we do not have to perform 1000 individual buffer uploads and CPU → GPU transfers. Typically speaking, it is in this CPU → GPU transfer where the bulk of time is spent in instrumenting WebGL draw calls.
2️⃣ We upload only one buffer per rendering primitive to the GPU
A lot of graphics programming comes to down to efficient buffer management. When uploading data to the GPU, you ideally want it to be as small as possible to reduce the CPU → GPU transfer cost. Additionally, data needs to be carefully handled on the CPU, otherwise as further above, JavaScript Garbage Collection (GC) events can eat into your frame budget. Imagine arrays being recomputed and reallocated each time you render. This is a common recipe for extremely expensive and frequent GCs.
To form a pit of success in this part of our application, we baked best-practices into our own WebGL buffer abstraction. This abstraction exposes a light interface through which all buffer operations for a single rendering primitive (e.g., rectangles) take place on one interleaved buffer, whilst carefully managing memory on the CPU and the GPU. This means we upload very few buffers to the GPU which is especially effective for low-powered devices. Furthermore, this means we can optimise our choices around rendering. Today, we only render when our interleaved buffer has changed, by keeping track of if our interleaved buffer is dirty and accordingly invoking our WebGL renderers.
In a similar vein: when uploading to the GPU, we submit ‘patches’ to the parts of the buffer which changed, rather than re-uploading the entire buffer. Again, this greatly reduces CPU → GPU transfer costs. This pattern of working with deltas persists throughout our entire WebGL rendering layer, and has been hugely beneficial for building a performant set of WebGL renderers.
3️⃣ We lazily compile our WebGL shaders
If you’ve ever visited an application or portfolio site built in WebGL, you may have noticed a loading screen which lasts for 10-30 seconds. While slightly longer loading states are common in video games, modern single page applications (SPAs) are quite unforgiving of them. We initially faced the same problems with our use of WebGL, wherein we would recompile 10+ shaders every time a customer visited a whiteboard. While this is ultimately dependent on browser implementations as some implement shader caching, it is still an expensive operation for first-time customers, and blocks the main thread. This is since each WebGL shader must be compiled for the specific drivers on a customer’s machine. Overall, this led to ~3s boot times for our renderer even on ample hardware, and made the app feel quite sluggish on startup.
Using JavaScript proxies, we made a change to only instantiate WebGL programs and shaders on the critical path of first-render. This significantly reduces startup time of the application from a few seconds to at most 0.5s on ample hardware. In the background after having completed our first render, we then pre-warm any renderers which still need to be bootstrapped using a requestIdleCallback queue.
All in all, this phase occupies ~0.4-0.5ms per frame in our current application, and supports huge amounts of elements when rendering. If you’re interested in high-performance rendering, we would definitely recommend giving WebGL a look. You will most definitely find yourself surprised by its speed!
A word of caution
Some things are really hard to do in WebGL! A classical example is text rendering: How do you render 1000s of glyphs with good quality, whilst retaining 60 FPS?
We will be exploring how we solved this in a future blog. Stay tuned!
Rendering at scale with the GPU
To keep it short and sweet, here are the browser task times we report per-frame in a homegrown performance testing harness, powered under-the-hood by Chromium’s tracing API and Playwright. These tests run against all development and main branches in our development repository, utilising fixed datasets and browser environments to provide stable performance numbers for key interactions.
| Interaction | p90 Interaction Performance |
|---|---|
| Adding an element to large a board | 1.6ms |
| Dragging an element on a large board | 2.5ms |
| Panning on a large board | 2ms |
| Zooming in and out on a large board | 2ms |
This means that in our current state, Confluence whiteboards comfortably achieves 60-120FPS on machines with a mid-range GPU and multi-core processor.
The details can of course vary slightly machine to machine and use-case to use-case. We are currently in the process of collecting field data from our open Beta customer cohort and are excited to continue on our performance journey. We see the achievement of ‘buttery’ performance as a constant pursuit and investment, rather than a once-off . A non-canonical list of performance and hardware quirks we’ve faced while tuning the rollout of Confluence whiteboards to Beta customers are:
- Hardware quirks can be exaggerated across different machines and operating systems. For example, we discovered an issue where a regression with instanced rendering in ANGLE was especially exarcebated on MacOS machines with AMD GPUs. The Chrome team is actively working towards moving WebGL rendering on MacOS to being backed by Metal to help address this issue.
- Devices all have varying capabilities. From support for a specific amount of texture units to depth buffers, we’ve had to ensure our homegrown rendering engine is compatible with the lowest common denominator of hardware all whilst meeting our performance targets.
- Software rendering is slow. Many corporate environments disable GPU acceleration in browsers by default for security reasons. We’ve had to ensure we provide adequate messaging for this to customers, and have also prototyped an SVG-based rendering layer as a fallback implementation inside of our renderers (re-using the same ECS renderer systems and rendering primitives).
- Servers don’t have graphics acceleration. This is why for some time, we had our own cluster of Windows machines in the Cloud for running performance tests. We have since vested in headless performance testing, and focused profiling of our WebGL layer using the high-resolution timers offered by the EXT_disjoint_timer_query WebGL2 extension. These tactics enable us to capture performance regressions before they land in customer’s hands with considerable confidence.
Visibility culling
One last performance technique we’d like to share in this blog is one we borrowed once again from the gaming industry – Visibility Culling, or what you may also know as Virtualisation.
In Confluence whiteboards we make use of a sparse tile data structure to break up the ‘infinite’ digital canvas into regions 2048 x 2048 in size. Our tiling map is capable of 8 million add operations and 5 million query operations per second. It attaches a VisibleComponent to all visible entities in our ECS, which is then used to act only on visible elements when rendering or performing expensive computations.
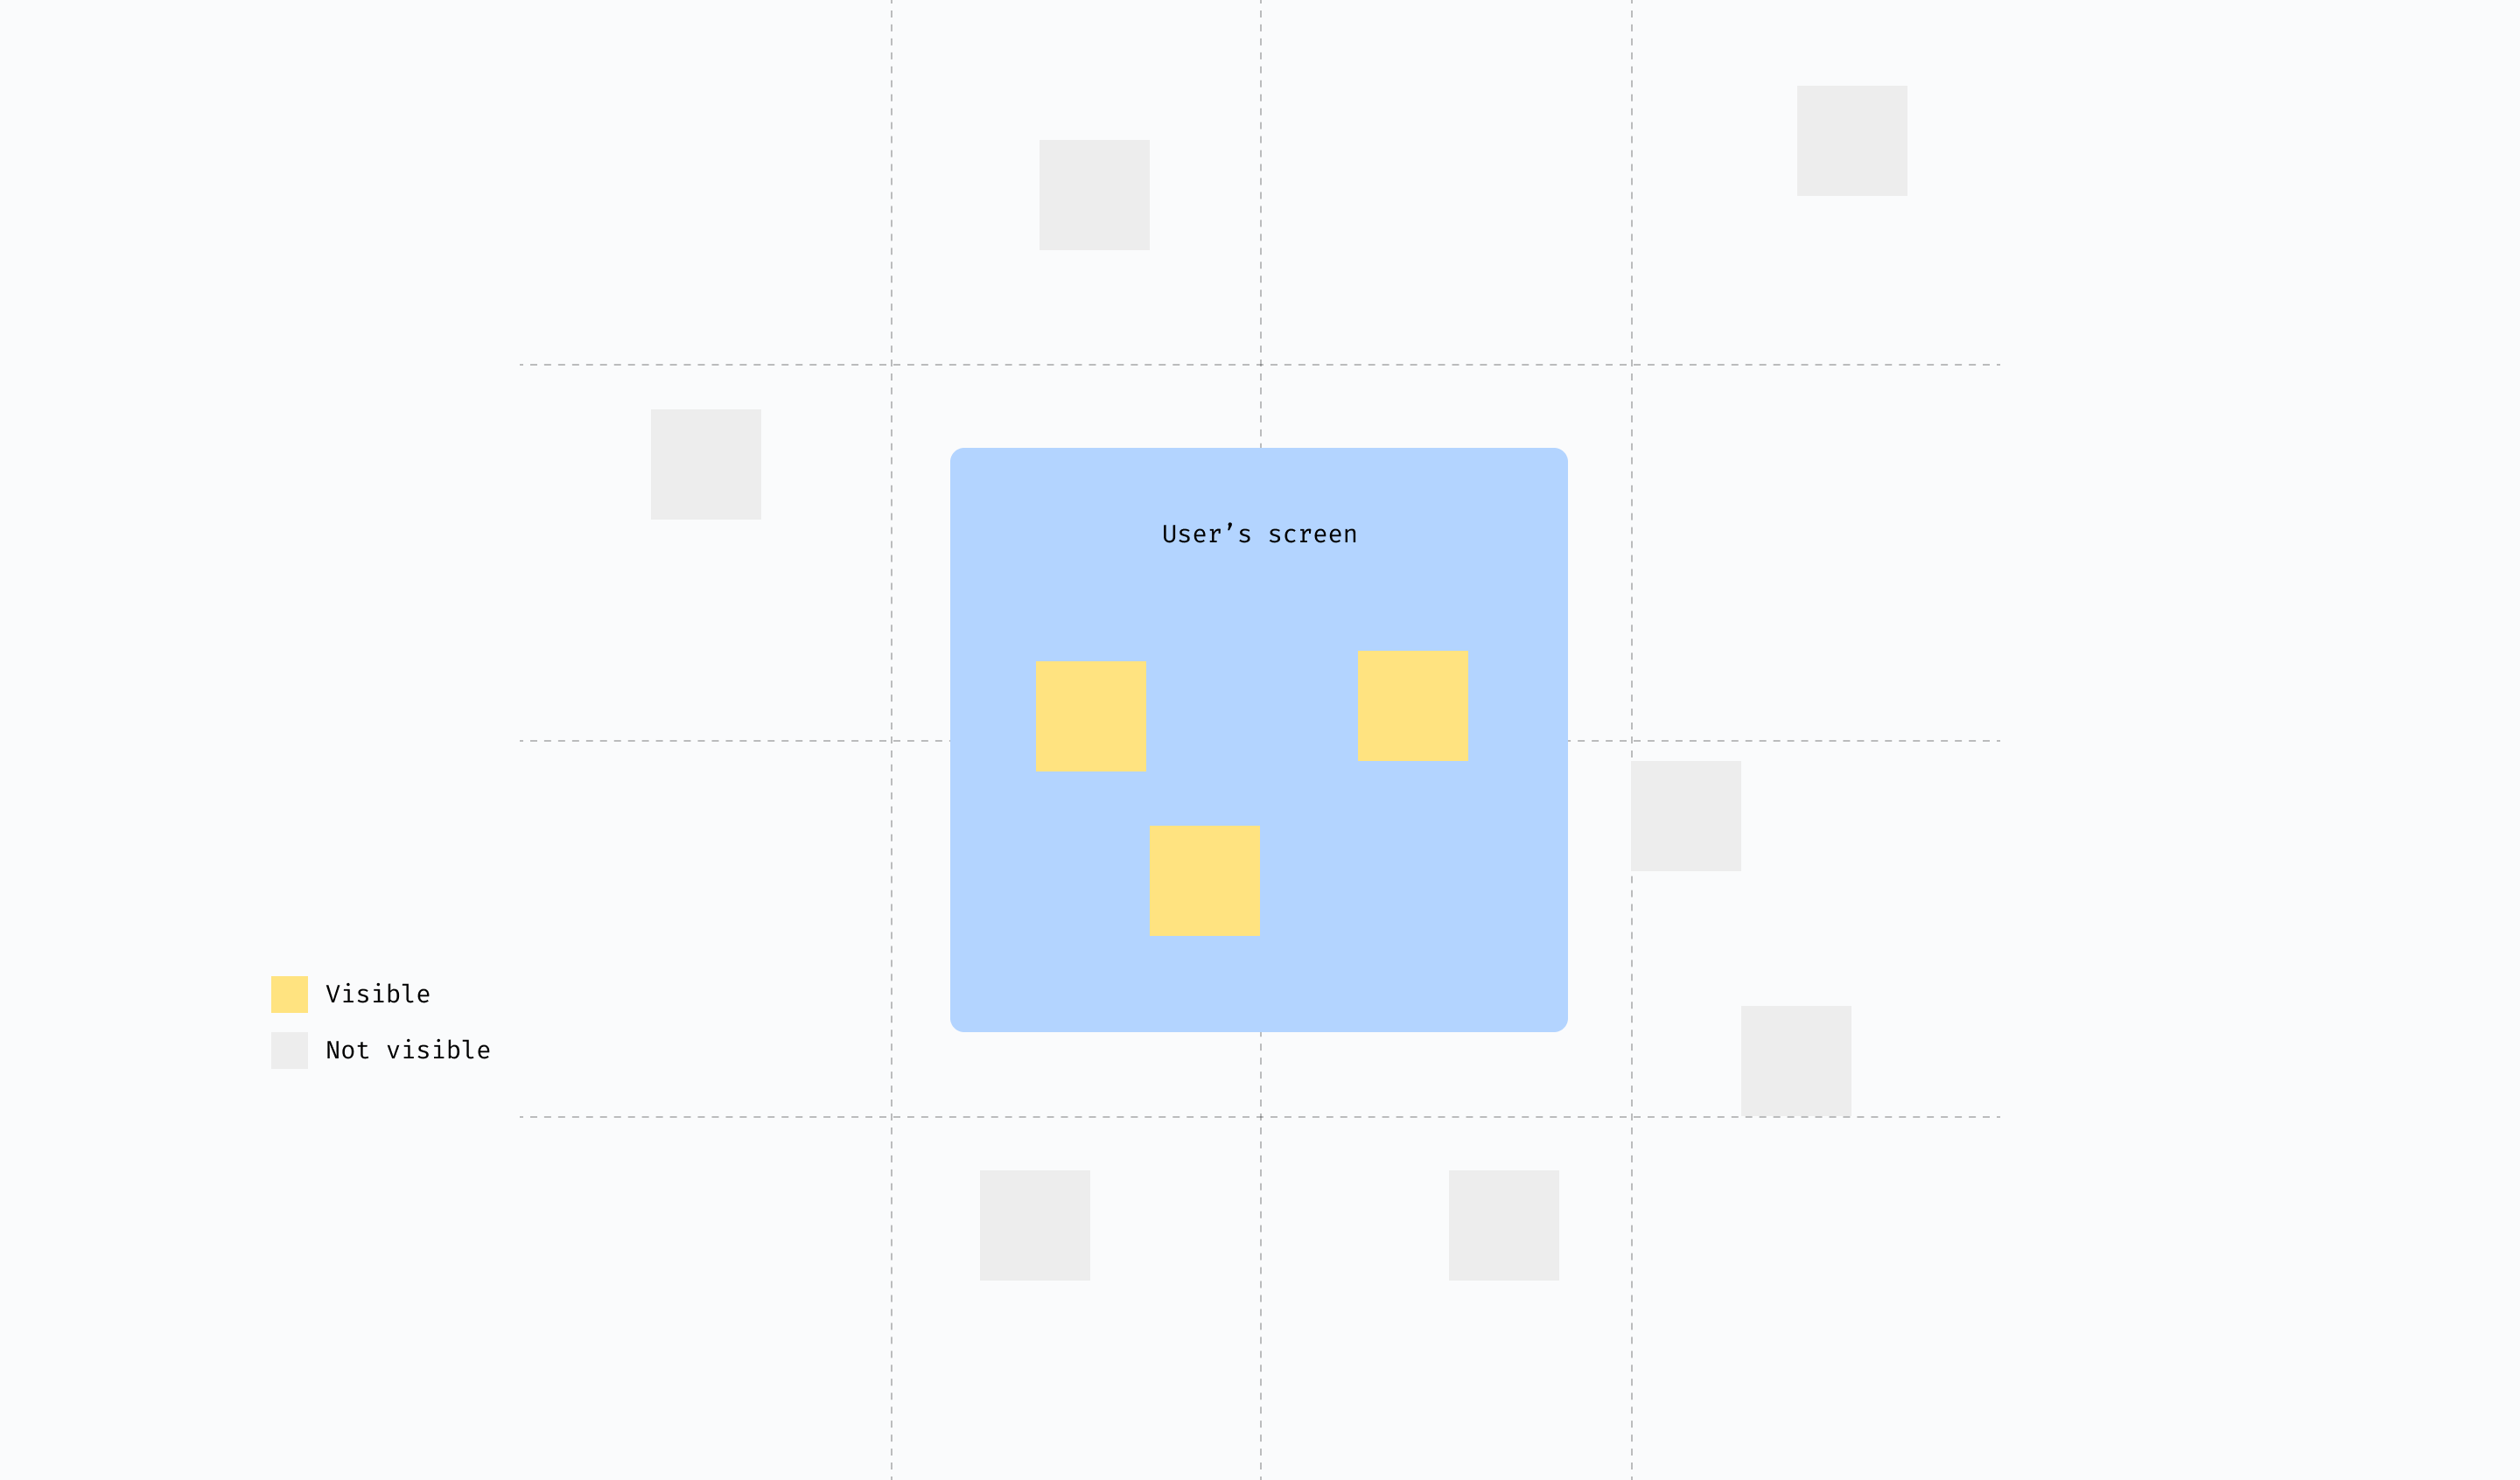
Items which are within ‘visible’ tiles are rendered & included in algorithmic computations. The rest are ignored.
There are other flavours of data structures we’ve considered including Quad Trees, k-d trees and more. While some of these are a great fit for spatial apps in general, digital whiteboards have one unique requirement where elements move quite often, especially in collaborative sessions. This can be an expensive operation in tree-based data structures, requiring the rebuilding of indexes which can eat into frame budgets. A sparse tiling map therefore offered the best trade-off for us between memory footprint, insertion speed and query speed, along with the highest opportunity for re-use across the entirety of our stack. For example, by reflecting tiles into our data model itself, we can in future decide to return only those elements which are in view all the way from our server → a customer’s browser. This is a common technique employed in maps rendering and servers, referred to as tiled web maps.
Future opportunities
While we’re really happy with how our rendering architecture is performing, we still have a long list of ways we want to make it better. A few opportunities we plan to explore include:
- On-demand game loop: A persistent game loop makes for an easier mental model around frames in our application but can lead to quite a bit of CPU consumption on devices which are low-powered (e.g., battery-powered devices). To address this a more ‘reactive’ game loop where we schedule a frame based on whether any work actually needs to be done is of keen interest to us. Popular libraries such as React Three Fibre offer this as a mode out-of-the-box.
- GPU picking: To speed up hit-testing on large boards, we may invest in the well-established technique of GPU picking, which relies on rendering of the contents of a
<canvas>element into a special frame buffer, rather than JavaScript loops and functions. This would require analysis into the performance gains we expect, traded off with the complexity incurred. - WebGPU for rendering: Whilst the use case of WebGL is admittedly simpler for a whiteboard than a 3D browser-based game, squeezing out as much performance as we’d can from WebGL has proven to be a bit of a black-box at times. The flexibility and control WebGPU offers is an exciting prospect we’re keen to experiment with in the near future to further push the boundaries on performance.
Closing thoughts
The process of assembling our rendering pipeline and architecture has been a major learning for us as the Confluence whiteboards team. From learning about the world of ECS and game engineering patterns to thinking more deeply about GPUs, we have come to learn a tonne about how capable modern web browsers are. If wielded well, the modern web browser is a workhorse capable of rendering giant, interconnected experiences which push the boundaries of visualisation and ideation.
In no particular order, our three biggest learnings building out Confluence whiteboards so far have been:
- Performance is always about doing as little as possible. While smart algorithms and data structures are always helpful, a frame in which nothing happens is the fastest frame. We’ve very critically assessed what needs to happen per-frame to achieve the above results, and continuously ask ourselves how we can do less rather than do more. After all, the best code is no code.
- When pursuing world-class experiences, rebuilding things is sometimes a necessity. Not every off-the-shelf solution is tailored towards 60+ FPS applications. This can lead to building your own abstractions and going very low-level into different spaces. We’ve learned that’s okay to do. Embracing complexity when it is necessary is arguably one of the missions of an engineering team. What is essential is to have done your due diligence and only build the things you truly need to. I.e., don’t get caught up by the not-invented-here syndrome!
- Having a flexible architecture is essential for rapid development. For an early stage codebase, rather than debating whether a
QuadTreeorTileMapis ‘better’ and distributing it across N parts of our application, enclosing it into one unit of our architecture means it can evolve at its own pace as we learn more about the problem space. We’ve repeatedly seen this pay off: an architecture where technical choices can be delayed or iterated upon without compromising the architecture as a whole are arguably the architectures which are most flexible and capable of incremental delivery.
There are a plethora of other details, side-quests and rabbit holes which we have gone on to build Confluence whiteboards. To start with, I hope this blog gives you a sense of excitement at the wonderful space of digital whiteboarding. Stay tuned for more in future instalments – we have plenty more to share.
Thanks for reading!