“Ohhhhh $#!τ. We broke Confluence.” In one of our first Confluence Cloud releases in 2016, we broke our users’ ability to edit pages. As the head of Atlassian’s site reliability engineering group, this kind of thing falls right into my wheelhouse. In this post, I’ll walk you through how we responded to the situation to get Confluence working again. I’ll give an insider’s view of our incident management process, as well as how we’ve configured Atlassian tools to support this work.
“Ohhhhh $#!τ. We broke Confluence.” In one of our first Confluence Cloud releases in 2016, we broke our users’ ability to edit pages.
As the head of Atlassian’s site reliability engineering group, this kind of thing falls right into my wheelhouse. We have a way of dealing with like this, and as crazy as it might sound, I kinda get a kick out of seeing something break in a new and exciting way since there are two important things to remember (which closely align with Atlassian’s values):
- We’ve built an amazing team of engineers who will do what it takes to ensure that we get our services up and running again (“Don’t #%@& the customer”).
- I know that we’ll get to the bottom of this, learn from it, and fix things so that they don’t happen again (“Be the change you seek”).
In this post, I’ll walk you through how we responded to the situation to get Confluence working again. I’ll give an insider’s view of our incident management process, as well as how we’ve configured Atlassian tools to support this work.

“Wait… where’d my page go!?” – lots of Confluence customers, earlier this year
Hit the ground running
When something breaks, every second counts and the race is on. And who are we racing? Ourselves! Like any good athlete, we keep a record of our personal bests (and worsts) and reflect on these results (tracked as KPIs) regularly. So naturally we want to do whatever we can to improve.
There’s also another challenger in the race: the sun. We typically release new features outside of business hours for our customers so in a case like this, we have until the start of the next business day to roll back or get a fix in place.
Find out about things as soon as (or before!) they break
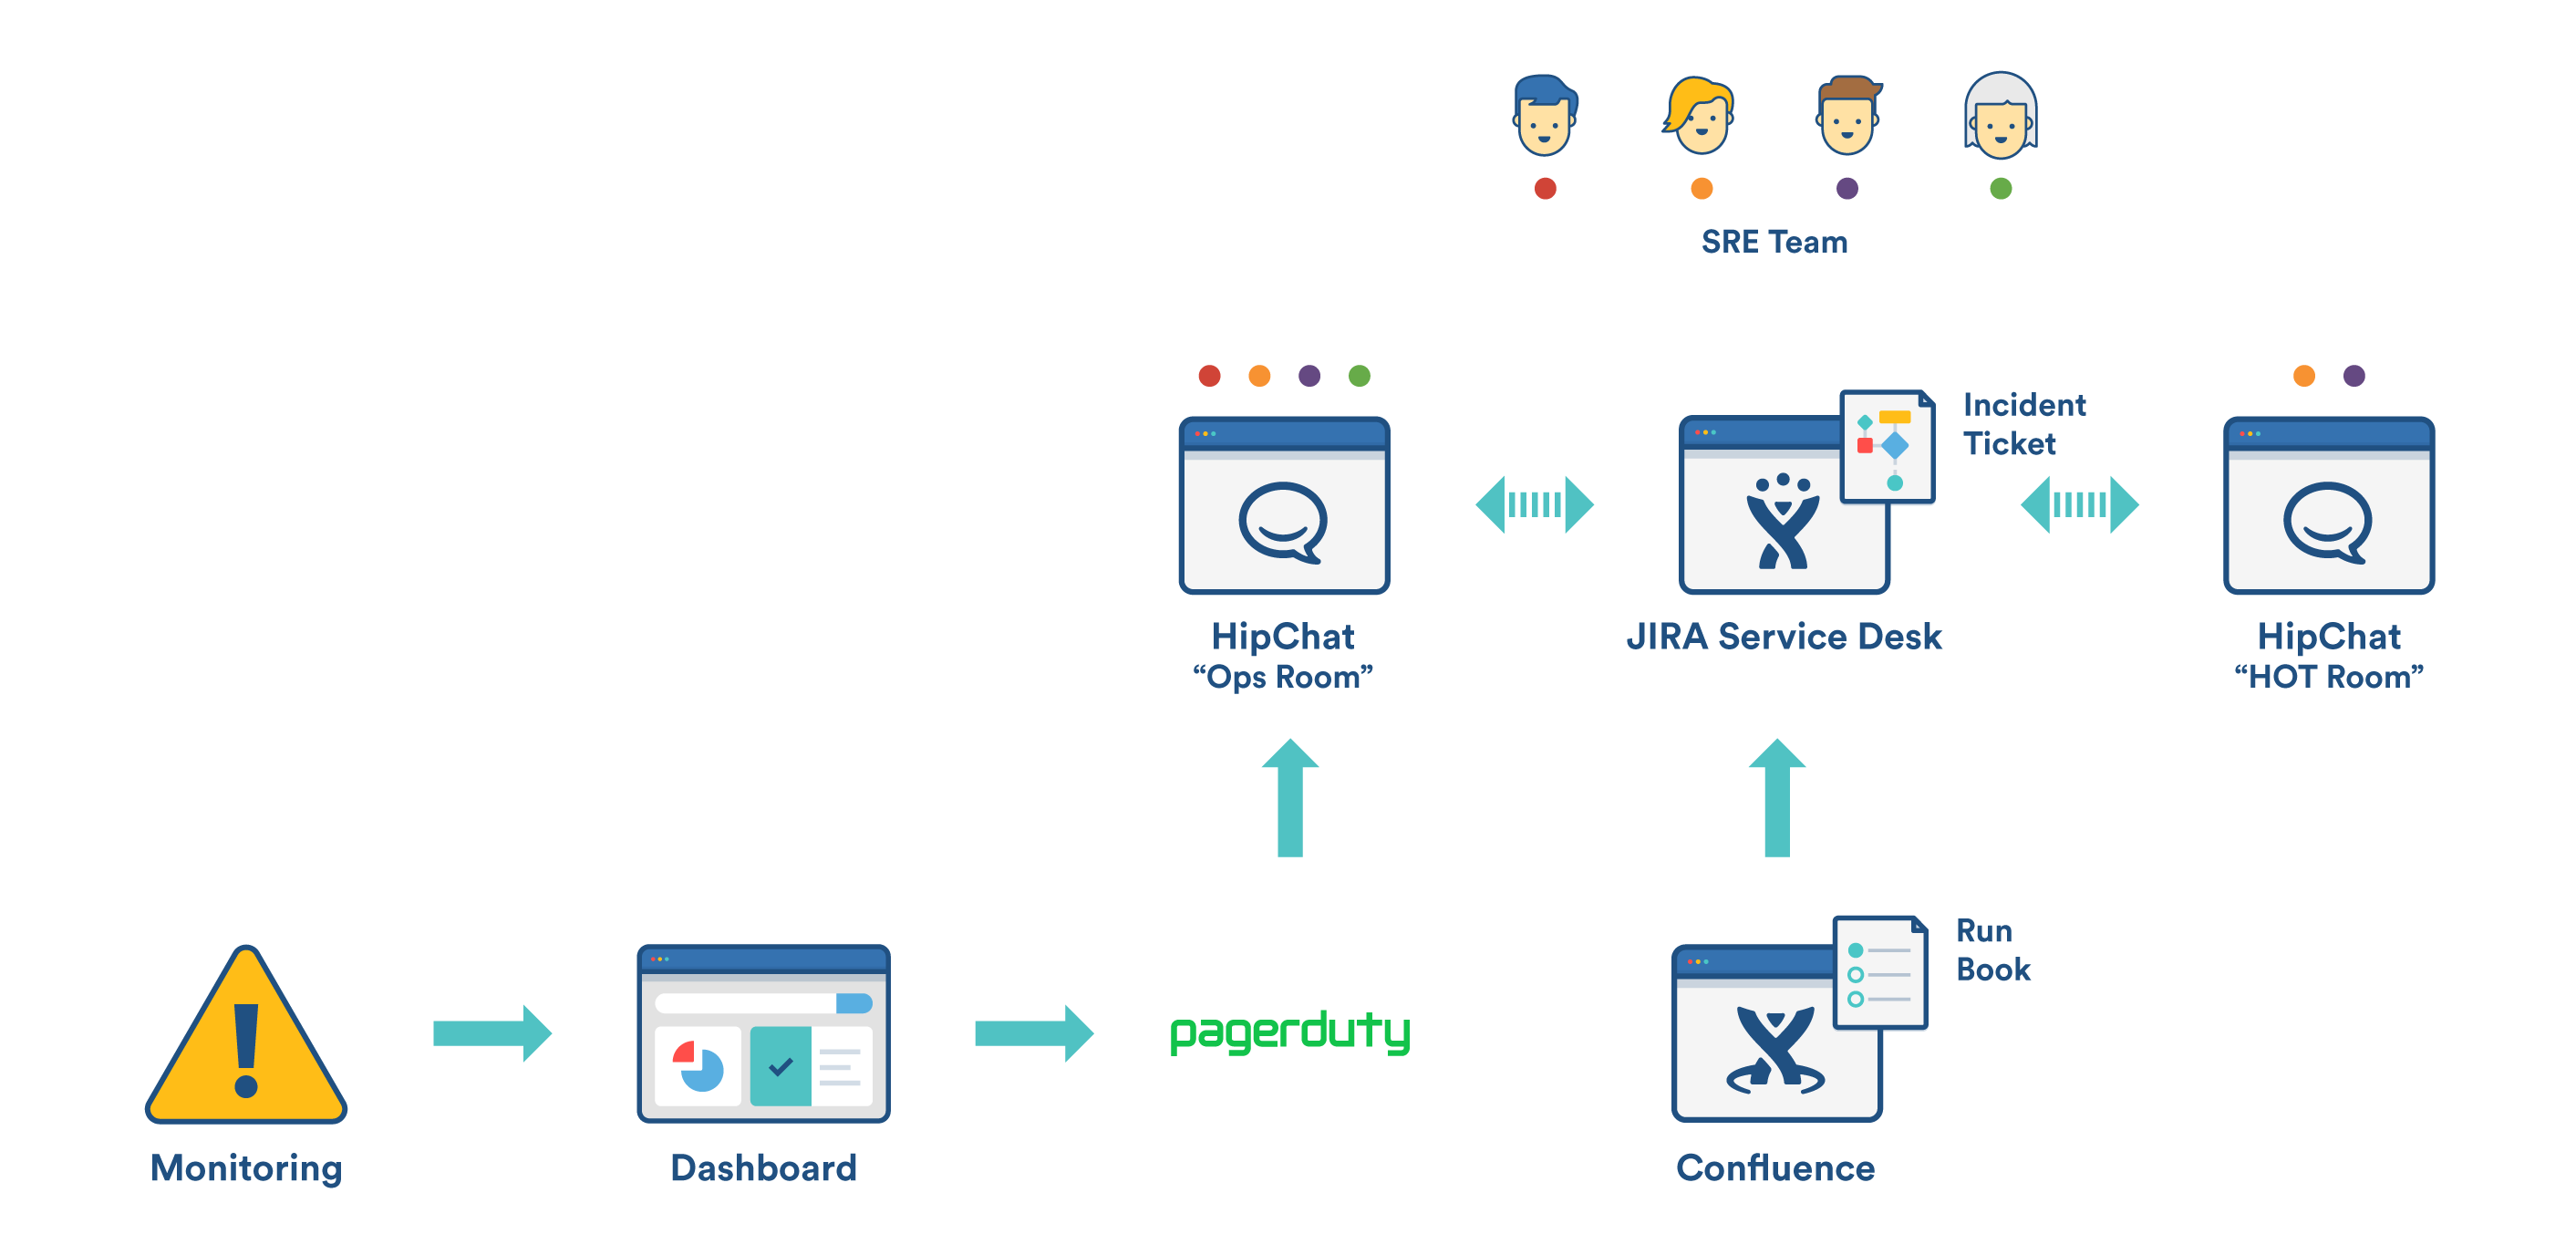
It might sound obvious, but the first thing we need to know is that the failure has actually gone wrong. We have a comprehensive set of monitoring systems tuned to detect failures and anomalies. These monitoring systems fire alerts to our team via Hipchat notification as well as direct to on-call phone numbers via integrations withPagerDuty.

Anomaly detection
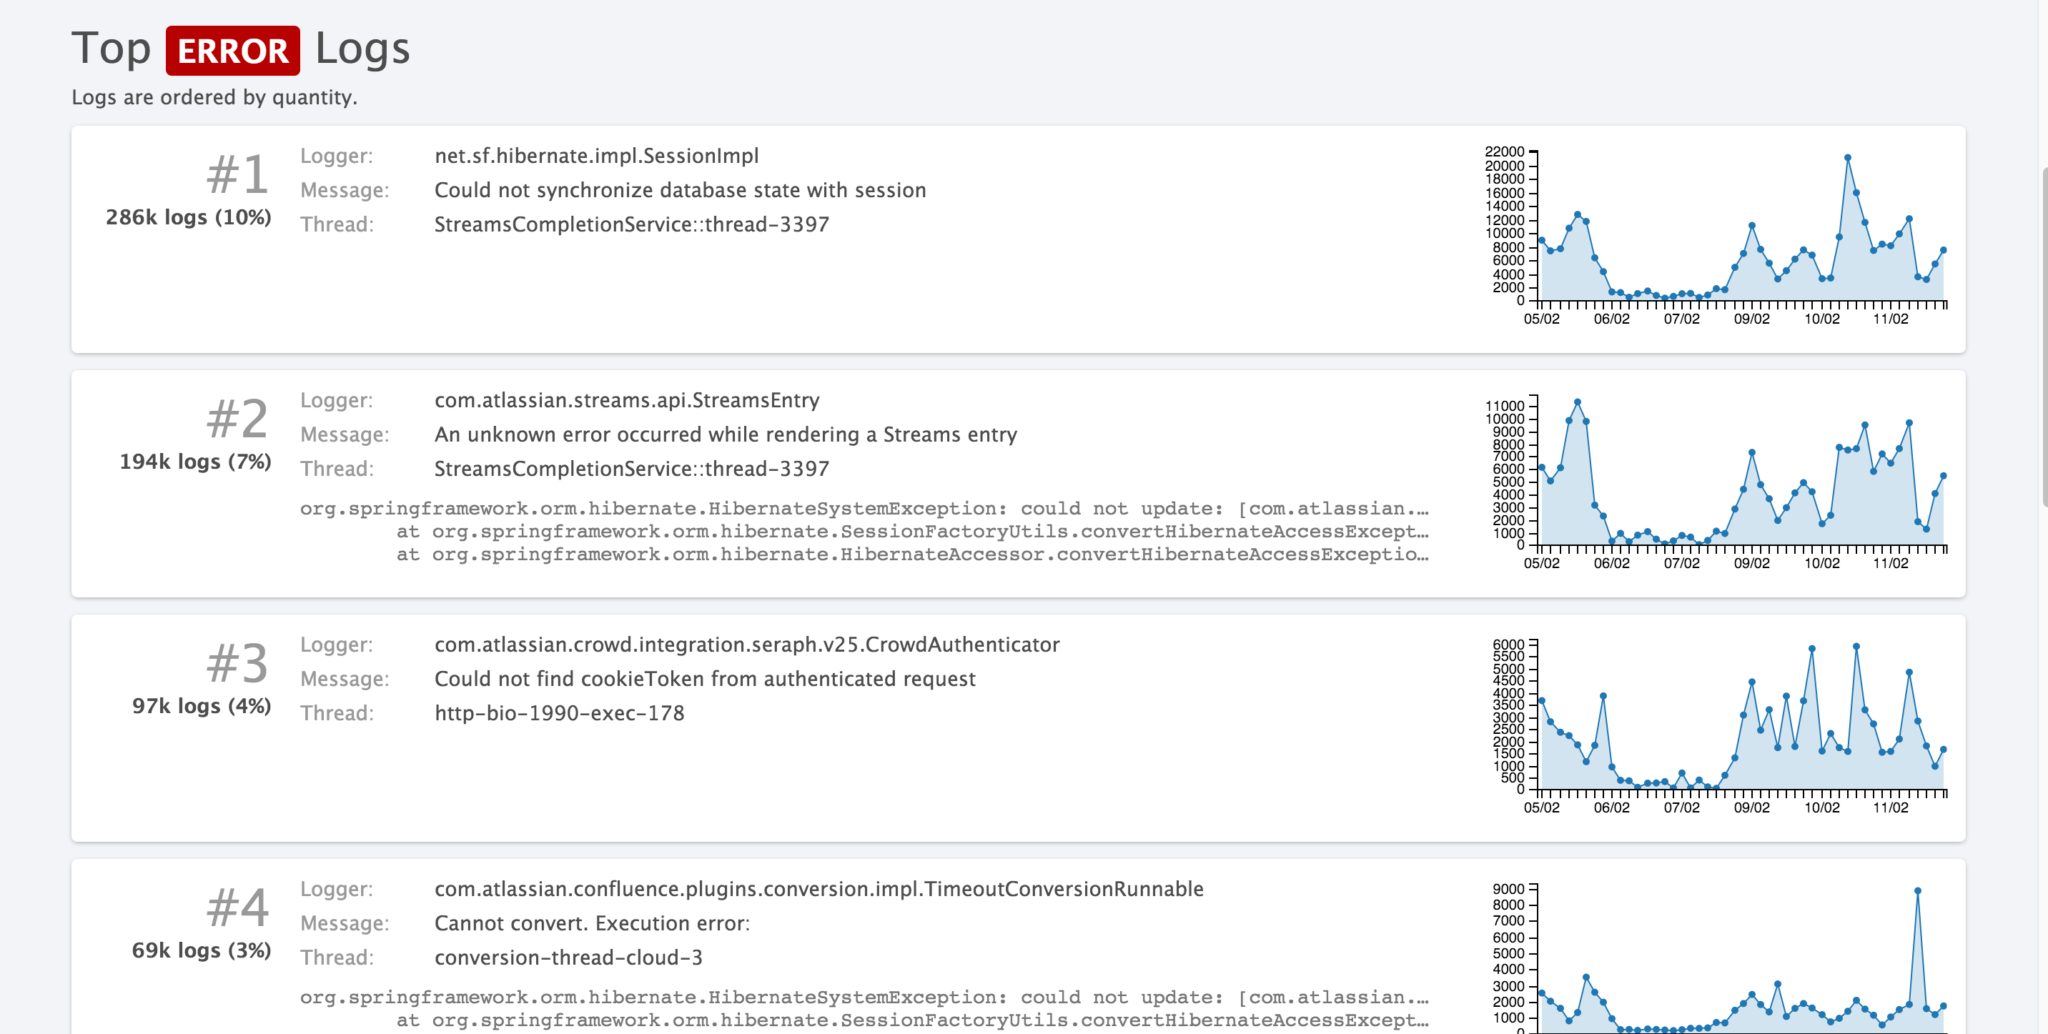
We can’t have a check in place for every possible thing that will fail. There are just too many things to look for. So our monitoring is supplemented by an aggregated log capture and analytics tool which we call Logging As A Service (LaaS). This system is an Elastic Search, Logstash and Kibana stack (ELK) which receives application logs from all Confluence Cloud servers. It churns away in the background, keeping a log of basically everything that gets… well, logged.
Using this data we can surface unusual behaviour in our cloud services which we don’t explicitly have monitoring for, as this query dashboard demonstrates – in this example I am viewing error messages ordered by frequency. Our SREs keep an eye on this for anything out of the ordinary.
If all else fails, there’s a big blue button to sound the alarm
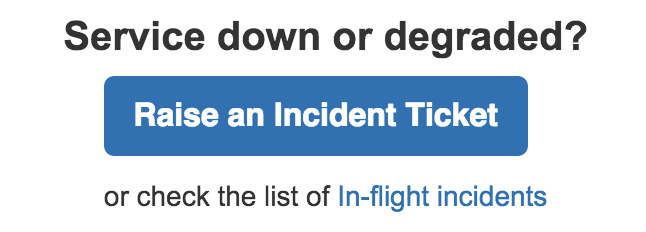

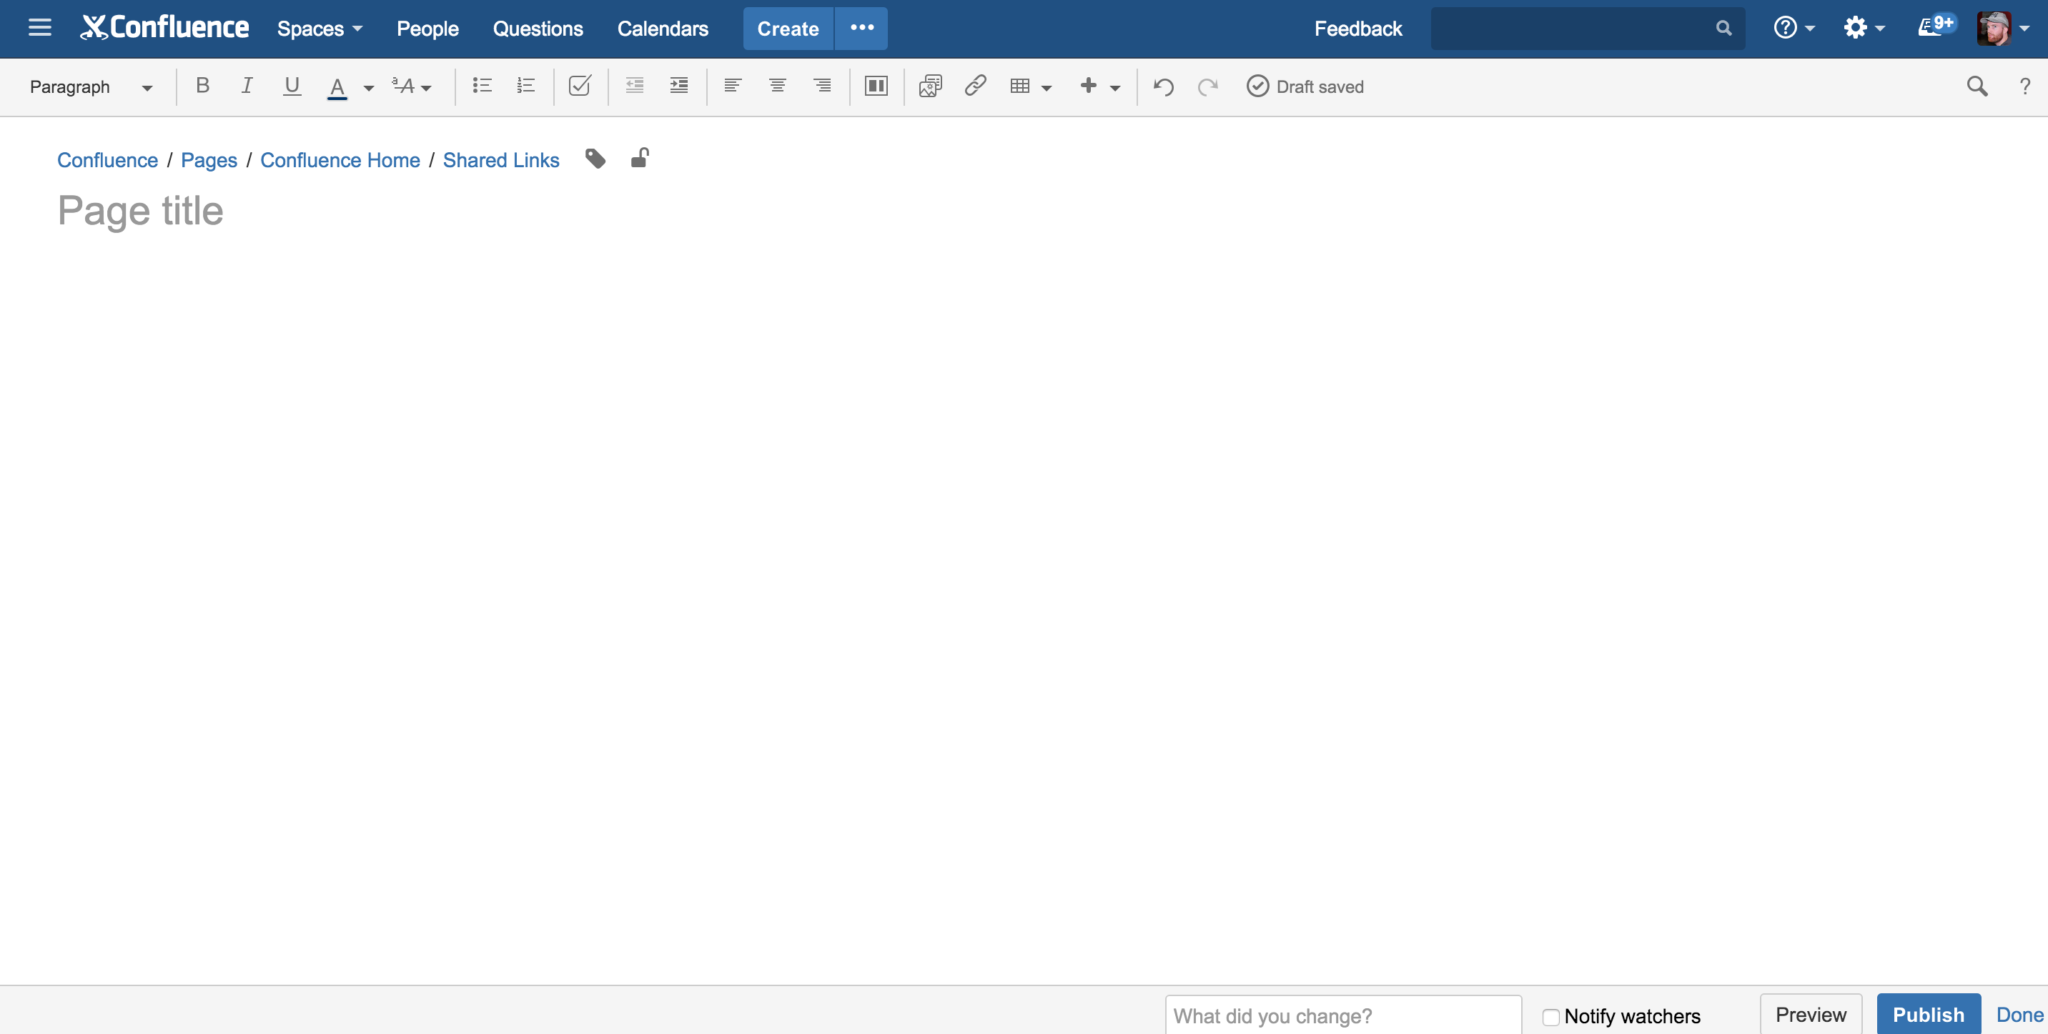
Everyone at Atlassian plays a part in the reliability of our services. This can even mean raising the alarm if something isn’t working as it should be. Right on the front page of our internal Confluence, we have a big friendly button so that anyone can raise the alert to our SRE team as soon as they spot something not working as it should be.
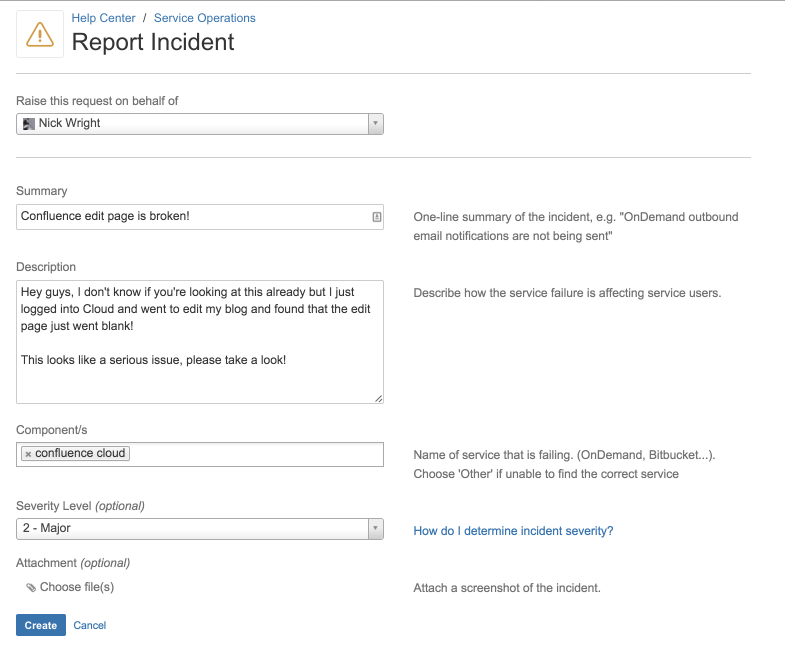
Clicking this button takes our staff straight to our internal instance of Jira Service Desk that powers the “Service Operations” portal, where a simple form and a couple of clicks is all it takes to launch our team into action. All Atlassian staff, from interns to senior management, are empowered to sound the alarm if they see something that doesn’t look right.

Introducing the incident manager on call (IMOC)


Let’s use that incident when we broke page editing in Confluence as an illustration. After we got the initial report, the first thing we needed to figure out was what was really going on here:
- Who is affected? Is it just a few users, everyone with a ‘q’ in their name, or the entire West coast? Establishing scope is key to problem definition.
- What are they experiencing? What does it look like when they experience the problem? Someone get me a screenshot! Is it every time or just some times?
Being an incident manager is largely a non-technical role. There’s no judgement for asking “dumb” questions – the incident manager makes sure of that (often by being the first to ask them).
If we need a specialist, we add them to the incident team via PagerDuty. If the situation warrants, we might escalate the issue and wake someone we need in another time zone.
As the team worked to answer these questions, signs pointed to Atlassian Connect, our plugin framework for Cloud. We received a detailed technical assessment from the Connect team. The basic facts were becoming clear:
- For a large set of users, the Connect framework is enabled but there are no plugins installed.
- In this circumstance, the page-render code would fail to deliver critical javascript modules as part of the page content.
- As a result, the (largely javascript-based) Confluence Editor would fail to initialise, resulting in an empty edit window.
So… Lots of users potentially impacted. In a highly visible way. Every time. Not good.
These are the four incident management stepsour Ops team takes each time:
Step 1: keep people informed


Part of the role of incident manager is to make sure we keep key people informed of what’s going on. For us, this means keeping both internal and external teams in the loop while at the same time informing our customers at a high level that we are aware of the problem and working to fix it.
Step 2: restore service – quickly
The primary goal of the incident team is to restore service. This is not the same as fixing the problem completely – remember that this is a race against the clock and we want to focus first and foremost on restoring customer experience and mitigating the problem.
A quick and dirty workaround is often good enough for now – the emphasis is on “now”!
In our case, we found out that if we disabled Atlassian Connect, we were able to get the Confluence editor working again. Keep in mind that only people with no plugins enabled were affected here, so by disabling the framework for specific users, we could restore service without causing a negative impact.
Clearly leaving the plugin system disabled is not ideal as this meant that people could not install new plugins while we developed a proper fix. Rest assured that the team continued to work on a fix once the true root cause was discovered. We were able to deploy after the appropriate tests had passed.
Step 3: capture everything
From start to finish, every detail should be recorded, big or small. You never know what will turn out to be vital information and this will help in a post incident review (PIR).
In our related blog about ChatOps, we cover how we ensure that actions carried out by the incident team are visible in Hipchat which allows us to easily capture a complete timeline from everyone involved.
Step 4: learn and improve
Every incident is a learning opportunity. We have a robust PIR process that focuses on lessons learned and opportunity to improve how we work. This is never about blame . We know that our teams are always working with the customer in mind because “Don’t #@!% the customer” is at the very core of our values.
Rather, we recognize that there are many factors that come into play in a complicated situation like this. We focus on how we can work to build technical solutions, improve our processes and put best practices in place to provide the best experience for our customers.
Interested in learning how Atlassian’s IT and support teams use Confluence, Jira Service Desk, and Jira Software to deliver legendary service? Download our free ebook with tips from our co-CEO Mike Cannon-Brookes.
Get the ebook on legendary IT service
Did you find this post informative? Share it on your social network of choice and help your fellow IT pros learn too!