Atlassian built a unified customer data lake to overcome limitations in analytics, data export, and operational database strain as their cloud customer base grew. By adopting a logical replication and data mesh approach, they enabled real-time analytics, secure data exports, and scalable dashboards for millions of users across regions.
Why Atlassian needed a customer data lake
At Atlassian, we serve millions of users across Jira, Confluence, and our other cloud products. As our customer base grew and their needs became more sophisticated, we hit a fundamental limitation: our existing systems couldn’t deliver what customers needed from their data. Our systems at the time consisted of distributed operational databases optimised for transactions, with no unified analytics layer – each product stored data in its own siloed databases, and there was no consolidated view for analysis or reporting. Three critical problems were blocking us
- Lack of instant analytics: We acquired a web BI tool (Chartio) and set out to create a seamless analytics experience (now Atlassian Analytics) for our cloud customers. Our goal was to let users immediately start analyzing their Jira and Confluence data – they could log into a web interface and start creating insights without needing to set up ETL pipelines or export data themselves. To achieve this “instant insights” experience, we needed a performant, consolidated data store for each customer’s data, pre-modeled and ready for analysis.
- No data export path for cloud customers: Many of our largest customers were moving from on-premises (Server/Data Center) instances of Jira and Confluence into Atlassian Cloud. In the self-hosted world, admins had direct database access and could run
SELECT *queries or dump their data into their own warehouse. In Cloud (a multi-tenant, distributed environment), direct DB access isn’t possible. This lack of data export was a blocker for cloud adoption. We needed to give migrating customers a way to extract their data from Atlassian Cloud in a simple, secure form so they could continue feeding their existing data lakes and integrations. - Analytical workloads straining operational databases: Our products like Jira had built-in dashboards and reports that were querying the production databases in real-time. This was far from ideal – those databases are optimized for transaction processing (creating and updating issues), not for heavy analytical queries. For example, loading a complex Jira dashboard could put significant strain on the primary database. We wanted to move these analytical workloads onto a separate system designed for fast queries, thereby improving performance and reliability for everyone.
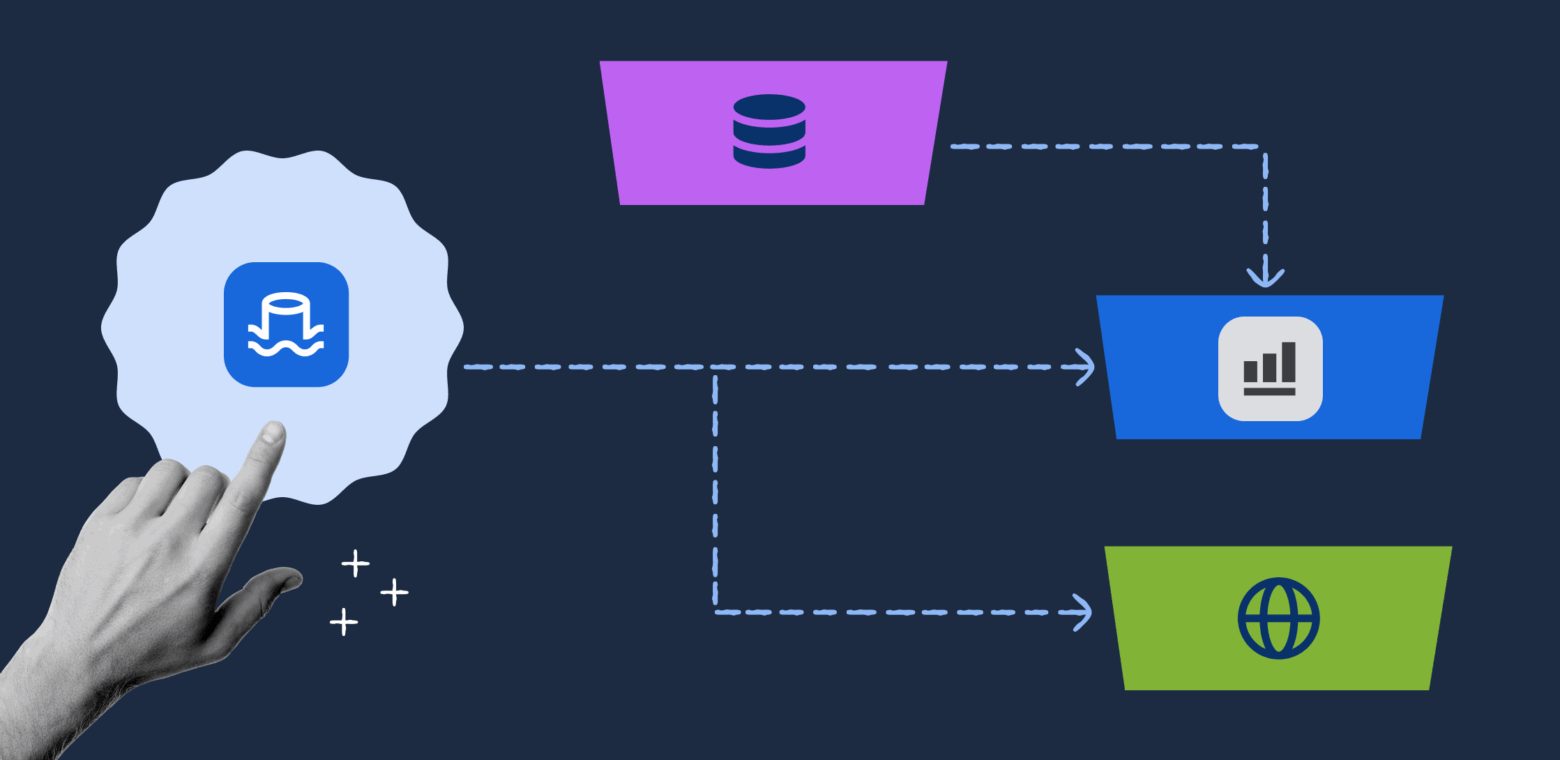
These needs convinced us that a unified customer data lake was the right path. A data lake is a collection of tables that stores data at massive scale, specifically designed for analytics rather than day-to-day operations. Unlike our operational databases (which are optimized for fast transactions like creating Jira issues), a data lake excels at complex queries, historical analysis, and powering business intelligence tools. By funneling product data into an analytics-optimized lake, we could provide new value (analytics and exports) while also protecting our operational systems. Of course, deciding to build a data lake was just the beginning – next we had to figure out how to get all of our product data into it.
Logical vs. physical replication: Choosing a data mesh approach
The first technical challenge was data replication: how do we capture changes from dozens of cloud products and hundreds of databases and funnel them into our data lake in real time? Atlassian’s engineering ecosystem is extremely heterogeneous – we have everything from monolithic legacy apps to modern microservices, using a variety of databases (sharded Postgres, DynamoDB, MongoDB, and more). We needed a replication approach that could work across many tech stacks and storage technologies. We also have many independent teams, so the solution had to empower each team to publish their data without a central bottleneck. This aligns with data mesh principles – a decentralized approach where each team owns and manages their own data as a product. Instead of a central data team extracting and modeling everything, the “mesh” refers to multiple interconnected data sources managed by their respective domain experts, creating a distributed yet coordinated data architecture.
Early on, we weighed two broad approaches for change data capture (CDC):
- Logical replication (application-level CDC): Instrument application code to emit data change events (for example, when an issue is created or updated in Jira, the code would send an event to the data lake pipeline). This approach is technology agnostic – it doesn’t matter what database or service is behind the scenes, as long as the app can serialize the change into a standard event format. It aligns with data mesh ideas by letting each service own its data contract and publish changes to a shared “bus.” It also offers better stability across schema changes – since producers control the contract, they can evolve it carefully with backwards compatibility and tests. And it gives teams flexibility to refactor their systems without breaking downstream consumers, as long as they honor the stable data contract. The downside: it requires significantly more upfront effort because each product team must instrument their application code to emit structured data change events, and then maintain this instrumentation as their services evolve over time.
- Physical replication (database-level CDC): Tap into the databases’ transaction logs (e.g. Postgres WAL or MongoDB oplog) using tools like Debezium to capture every insert/update/delete. This approach can get you instant coverage of all tables with less initial coding – you can start streaming all data changes fairly quickly. However, it’s highly dependent on each database’s technology and schema. Every product uses different storage tech, so a one-size-fits-all CDC tool wasn’t feasible. Physical replication can also break when teams make schema changes or switch databases, since it’s tightly coupled to how the data is stored. In short, it’s easier to get started, but harder to evolve.
After evaluating these trade-offs, we decided to take the longer road and implement logical replication across our products. It required more upfront work (instrumenting many codebases to emit events), but it gave us technology independence, stability of schemas, and flexibility for teams to change their internals without breaking the pipeline. In hindsight, this was absolutely the right call – the effort paid off by enabling a robust, scalable foundation. Each product team now treats their data events as a first-class product, and our central pipeline (the “mesh”) can ingest from any system that speaks our standard protocol.
To make this happen, we built a “replication bus” – a set of common APIs and infrastructure that product teams publish their change events to. Here’s how it works:


- Application emits an event: Whenever a change happens in a product’s database (e.g. an issue is created, a page is edited), the application code produces a CDC event describing that change. We defined a unified Protobuf schema for these events (more on that shortly). Each event represents one CRUD operation on a domain entity (such as a Jira Issue, Confluence Page, etc.
- Replication Bus API receives event: The event is sent to a central Replication Bus service, which acts as an intake API. This service immediately writes the event onto an AWS Kinesis stream for the appropriate product/domain. Downstream consumers (like our data lake pipeline, or search indexing jobs) can then consume from these Kinesis streams in real time.
- Initial bootstrap via S3: Each customer has their own isolated data lake (a dedicated set of tables partitioned by their own id). If a customer’s data lake needs a full snapshot of existing data (for example, when we first onboard a product or if a customer migrates a large instance), reading an entire database through Kinesis could overwhelm the stream or cause throttling. Instead, we perform one-time bulk exports (bootstraps) by dumping the current state of the database to Amazon S3, bypassing Kinesis. The data lake pipeline can load this snapshot from S3 to initialize its tables, then switch to consuming deltas from Kinesis. This two-path approach (real-time stream for incremental changes, bulk S3 for large backfills) prevents any “big bang” stress on the streaming system.
A standard Protobuf event protocol (with last-write-wins)
Consistency and schema evolution were paramount, so we developed a common Protobuf-based event envelope that all teams use. Protobuf gives us a compact binary format and built-in support for backward-compatible schema changes. In our protocol, each event includes metadata like an entity type, a unique entity ID, the operation (created/updated/deleted), a version number, and the actual data payload of the entity. The payload itself is also encoded as a Protobuf message – and we allow it to be any type (using Protobuf’s google.protobuf.Any) so that each product can define the schema that makes sense for its domain.
Our design uses a “last write wins” versioning strategy. Every change event carries a monotonically increasing version number for that entity. This means if events arrive out of order (which can happen in distributed systems), consumers can always apply the highest version and ignore older ones. By relying on version rather than perfect ordering in the stream, we sidestepped the complexity of globally ordered delivery. As long as producers send events in the correct sequence for each item, our data lake will converge to the latest state for each record.
We also anticipated cases where events might contain very large payloads – think of a giant Confluence page or a complex Jira issue. Kinesis has a payload size limit (~1 MB), so our protocol supports S3 offloading for large messages. If an event’s data is over a threshold, the producer will upload the raw content to S3 and just include a reference (S3 URL) in the Kinesis event. The consumer pipeline can detect this and fetch the full content from S3 on the other end. This keeps our streams flowing smoothly without dropping large updates.
With our change events flowing into Kinesis (and initial snapshots in S3), we had the raw ingredients for the data lake. The next step was turning those event streams into actual queryable tables in near real-time.
Streaming architecture: from raw events to analytics-ready tables
To process the incoming streams from the replication bus, we built a streaming ETL pipeline using Apache Flink. Our pipeline continuously reads the Protobuf events from Kinesis, applies transformations, and writes out to Delta Lake tables stored on S3. We chose Delta Lake (an open format built on Parquet files) for its ACID transactions and efficient upsert capabilities, which are crucial for our use case.


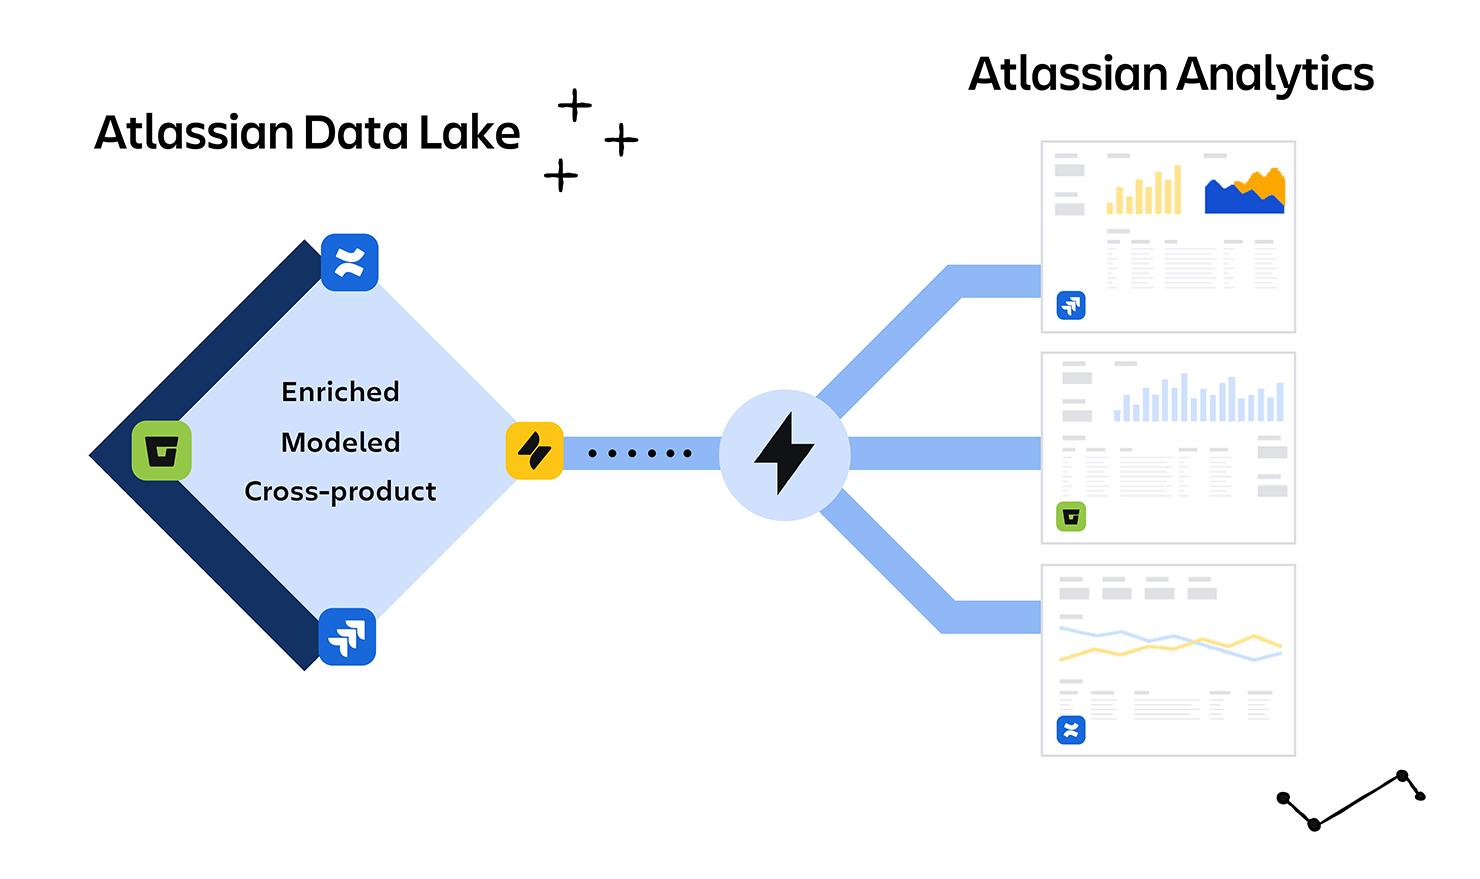
Conceptually, our data lake tables are organized in two layers:
- Raw tables (immutable log): These tables are an append-only log of every event we’ve received, stored in untransformed form. For each product entity (e.g. Jira Isseue, Confluence Page), we have a raw Delta table where every change event is recorded as a new row, essentially an audit trail. We don’t expose these raw tables to customers – they are mainly for internal use, such as reprocessing, debugging, or recovering data. For example, if we need to re-run a transformation or backfill data for a customer, we can replay the raw events. Having the unmodified data archived is a life-saver when dealing with accidental drops or schema changes.
- Refined tables (analytics model): These are the customer-facing tables that power Atlassian Analytics and other features. The refined tables are modeled and optimized for querying – they might aggregate or join data, rename fields, filter out internal columns, etc., to make the data user-friendly. Each refined table corresponds to a specific DBT (Data Build Tool) data model that our data modeling team defined. In essence, the streaming job reads a raw event, transforms it according to the business logic in our DBT model, and upserts it into the refined Delta table for that model.
We maintain a single configuration repository that houses all the Protobuf schema definitions alongside the DBT model SQL for transformations. This is powerful – it means the schema of the event and the transformation logic for that event are co-developed. When a product team wants to add a new field to their Protobuf, they raise a pull request in the shared configuration repository. The data modeling team reviews this PR and works with the product team to update the corresponding DBT SQL transformation logic to handle the new field appropriately for analytics. This collaborative review process ensures that schema changes are properly reflected in the analytics layer before they’re merged. Only after both the Protobuf schema and the transformation logic are updated and tested together is the PR approved and merged. All of this config (Protobuf schemas, DBT SQL) is versioned together. The streaming job pulls the latest config to know how to parse each event type and which transformations to run.
Here’s a simplified view of what happens for each event in the streaming pipeline:
- Read from Kinesis & decode: Flink jobs read events from the Kinesis streams. We deserialize the Protobuf messages (applying any decompression if needed) to get structured records in the stream.
- Write to Raw Delta Lake: Immediately, we append the event into the raw Delta table for that entity as a new row. This gives us a permanent record of the change in S3. (We do this before any heavy transformations or joins, so we never lose the raw data even if downstream steps fail).
- Transform to refined models: Next, we determine which refined models need to be updated from this event. We have a mapping of Protobuf entity types to one or more DBT models. For instance, a single Jira Issue event might feed into a “Issues” table, a “Projects” aggregate, and other downstream tables. We “fan out” the event to all relevant transformation queries. Our pipeline writes events to Delta Lake, where we use Spark (via Databricks) to execute the DBT-generated SQL transformations. This might filter fields, compute derived columns, or even exclude certain records based on business rules.
- Upsert into refined Delta tables: We apply the last-write-wins logic here to handle updates. Each refined Delta table is keyed by the primary ID of the entity (and partitioned by customer). When we have a new event, we need to merge it with the existing table: if the record already exists, update it with the latest values; if it’s a new record, insert it. We use Delta Lake’s MERGE operation to perform these upserts in the streaming job. We accumulate a batch of events and then do set-based MERGEs, which is much more efficient than one-by-one operations. The result is that the refined table always reflects the current state of each entity (with the most recent data), rather than a history of changes.
- Serve to customers: Finally, customers can query these refined tables via Atlassian Analytics. We also create specialized customer views via our provisioning service that enforce row-level security, so each customer only sees their own data. Essentially, when a customer’s query runs, it’s filtered by their organization or instance ID. Customers can also scope their analytics to specific projects or spaces – we achieve this by creating on-the-fly views with the appropriate predicates (e.g. “project = XYZ”). This view mechanism makes it easy for users to define data sources that include exactly the data they need and nothing more.
Handling complex joins with “enhanced” tables
Our streaming pipeline processes each event stream independently – when a Jira issue changes, we update the Issues table; when a user changes, we update the Users table. This means our refined tables contain individual entities without relationships pre-computed. For simple analytics queries like “show me all issues in project X,” customers can query a single table directly. However, some analytical questions require joining multiple tables – for example, “show me issues with the full user profile of the assignee” requires joining the Issues table with the Users table.
One limitation we faced is that our real-time streaming jobs don’t perform joins between different event streams during the transform (to keep things simpler and faster). Customers can always write SQL queries that join our refined tables at query time – that’s standard SQL functionality. However, some joins are computationally expensive (joining large tables with complex predicates), and if many customers run similar expensive joins repeatedly, query performance suffers. Additionally, some of our higher-level analytic models require joining data from multiple sources – for example, combining Jira issues with data from our identity service or with Confluence pages. To support these common, expensive join patterns efficiently, we introduced Enhanced Tables/Views as a complementary batch layer (scheduled jobs that run periodically, as opposed to our real-time streaming pipeline).
For cases where a transformation is too complex for the streaming job, we do one of two things:
Enhanced Views: We create a Databricks SQL view that joins two or more refined tables on the fly. These views live in the query layer. When a user runs a query, the join happens at query time (the data isn’t stored joined). This approach is fine if the query performance is acceptable with live joins.
Enhanced Tables: If the join is expensive and frequently needed, we offload it to a batch job that materializes the joined result as another Delta table. Think of this as a periodic ETL that populates a pre-joined “cache” table for analytics. This gives faster query responses at the cost of some data staleness (since it’s updated on a schedule).
By being flexible with streaming vs. batch, we ensured that our customers get a good balance of real-time data and rich relational context in their analytics. Most simple things (like “list of issues with their latest status”) are real-time, and only the really complex aggregations or cross-product metrics rely on a periodic batch job.
Multi-region architecture for data residency
Atlassian serves customers all over the world, and many have strong preferences (or regulatory requirements) about where their data is stored. We knew our data lake needed to support multiple regions from day one – allowing a customer’s analytics data to stay in the US, EU, Australia, etc. as needed. Operating in multiple regions also gave us performance and reliability benefits:


- Customer choice & compliance: We want to give customers control over where their data lives, to meet data residency laws or internal policies. If a European customer needs all data in the EU, we will honor that by keeping their data lake partitions in our EU region.
- Lower query latency: Analytics queries run in the same region as the data, so by moving data closer to the customer’s locale, we can reduce query response times and improve the user experience.
- Faster ingestion (shard by region): Our largest tables (e.g. all Jira issues across all customers) can be split by region. Instead of one gigantic global table, we have several big (but manageable) regional tables. This limits the size of each merge operation since each job only handles the subset of data for its region. Essentially, adding regions is like sharding the data lake by geography – which improves scalability.
- Fault isolation: In the unlikely event of a catastrophic issue (e.g. a bad deployment or a cloud outage), having multiple regions contains the blast radius. An incident in one region would only impact a fraction of customers, not everyone.
Implementing multi-region support in our pipeline was greatly simplified by our use of infrastructure-as-code. We use Terraform to define the entire data lake stack (Kinesis streams, S3 buckets, Spark/Databricks jobs, etc.). To add a new region, we essentially replicate the Terraform modules for that region’s settings. The code for the pipeline is reused for every region we support, just parameterized with region-specific details (AWS region, network settings, etc.). This lets us stand up a new regional instance of the data lake with minimal effort – we simply instantiate the same parameterized infrastructure template with region-specific values. We’ve done this to deploy in multiple AWS regions.
Moving customer data between regions
Supporting multiple regions also means we need to handle data migration requests. Sometimes a customer will ask to move their Atlassian site from one region to another (for example, if a company decides to relocate their data from the EU to the US). Additionally, we must handle the scenario where a customer leaves Atlassian Cloud entirely and all their data must be purged (to comply with data protection regulations like GDPR’s right to erasure). These cases required building a data migration and deletion workflow on top of our pipeline.
To migrate a customer’s data from Region A to Region B, we leverage the raw event log we kept in Delta. Remember, the raw tables contain every change event for each entity. That means if we replay all those events, we can rebuild the customer’s data from scratch. Our migration process looks like this:
- Trigger migration: Our global control plane (the Atlassian provisioning service) notifies the data lake that customer X’s site is moving from region A to region B. This gives us the source and target context.
- Export from source (replay events): We spin up a migration job in region A that reads that customer’s entire history from the raw tables. Essentially, we filter the raw Delta tables to just the events belonging to the customer (each event is tagged with a site/org ID), and stream those events out. Instead of transforming them to analytics tables in region A, we inject them into the Kinesis stream of region B as if they were happening in real time. We have a special pipeline that can read from Delta and produce to a remote Kinesis stream, acting like the “producer” on behalf of the migrating customer.
- Import to target: In region B, the events land in the normal streaming pipeline (ingestion -> merge) and rebuild the customer’s refined tables from scratch. We use a secondary “throttled” channel for these backfill events to avoid overwhelming the real-time pipeline. In practice, we write migration events to a separate Delta table in region B (an “import queue”), and then union that with the live stream in the merge job. This way, we can control the rate of backfill (slow it down if needed) and give priority to any live data for other customers.
- Tombstone the source: Once the copy is done and verified, we need to delete the customer’s data from region A. For this, we run a deletion job that goes through all refined tables in region A and inserts tombstone events for every record belonging to that customer. Those tombstone markers get processed by the merge logic in region A, which deletes the records (or rather, marks them as deleted). This cleanup step satisfies our data residency promise – none of the customer’s personal data remains in the old region after migration.
This migration system also doubles as our account deletion / GDPR compliance mechanism. If a customer leaves Atlassian Cloud and invokes their right to be forgotten, we use the same deletion job to purge their data from the lake on demand. Because all data is partitioned by customer and tagged, the deletion job knows exactly which slices of the tables to tombstone. We’ve automated this so that a single control-plane request triggers the entire find-and-delete workflow across our data lake.
Delivering value: analytics, exports, and in-product dashboards
After a long journey of building and hardening this data lake platform, what did we achieve? In short, we unlocked a wave of new capabilities for Atlassian’s customers and products:
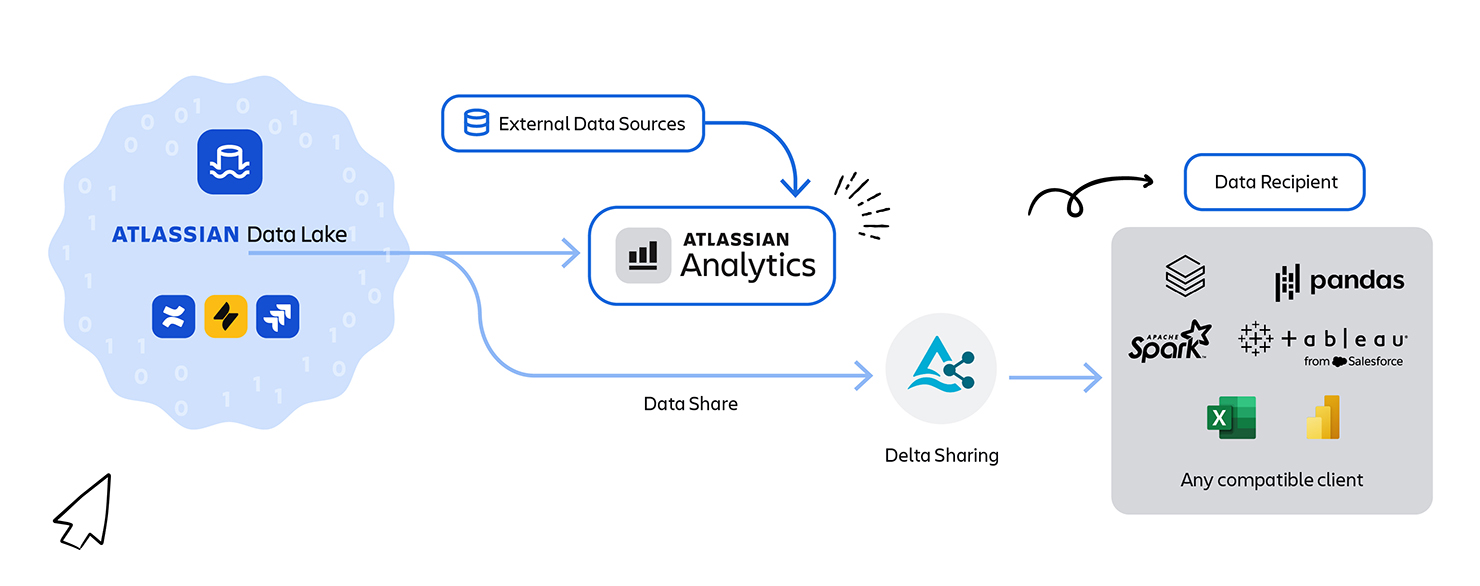
- Atlassian Analytics for customers: We launched Atlassian Analytics, a new product experience that sits on top of the Atlassian Data Lake. Customers can instantly explore and visualize their Jira, Confluence, and other Atlassian product data with no setup – the data is already there, fresh and queryable. This was exactly the “zero to hero” analytics experience we envisioned. Under the covers, every Analytics query is powered by the refined tables in the data lake. Teams can use out-of-the-box dashboards or write custom SQL, and they don’t have to worry about API rate limits or building their own data pipelines – we handle it for them. Learn more about Atlassian Analytics and explore the full documentation.

Enterprise data exports (Delta Sharing): For customers who need to pull Atlassian data into their own warehouses or BI tools, we built a data export feature on the lake. Rather than giving direct database dumps, we leverage Delta Sharing, an open protocol for secure data sharing. Essentially, for each customer that opts in, we isolate their data in an “exclusive” set of Delta Lake partitions and then provide a Delta Sharing endpoint to access those partitions. The customer can use a Delta Sharing client (or any platform like Databricks, Snowflake, etc. that supports the protocol) to fetch their data incrementally from our S3 bucket. It’s as if we gave them a dedicated data warehouse, but without actually copying the data out – we’re just providing secure access to their slice of the multi-tenant lake. This solved the cloud migration blocker: customers can now get all their data out of Atlassian Cloud easily, to feed into other systems, just like they used to with direct DB access on-prem. Learn more about data shares, how to create them.

In-product dashboards (performance wins): We have also started rolling out embedded analytics within our products (e.g. richer Jira dashboards and Confluence reports) that draw from the data lake behind the scenes. By offloading these queries to the lake, we avoid hitting the operational databases with expensive reads. This has made our products more scalable and allowed us to build more advanced reporting features. For instance, Jira can now display historical trends or cross-project insights that would have been infeasible to compute on the fly against the live DB. The data lake acts as a read-optimized replica for analytics, and the operational DBs are happier focusing on transactions. Learn more about Jira dashboards and reporting.


Perhaps just as importantly, we built this in a way that meets the needs of our most demanding enterprise customers. The multi-region support, granular encryption, and deletion workflows ensure that our analytics platform is enterprise-ready with compliance in mind. These features were not afterthoughts; we baked them into the design from the beginning, which saved us a lot of pain later on.
Building a platform, not just a feature
Looking back, the decision to invest in a customer-facing data lake has been validated many times over. It wasn’t easy – we had to navigate a diverse tech stack, choose a replication strategy, and invent new solutions for scaling and security. We embraced a logical replication model guided by data mesh concepts (with teams owning their data contracts), built a robust streaming pipeline for real-time transformations, and engineered solutions for stability and compliance at scale. In the end, this platform has become a foundation for data-driven experiences across Atlassian Cloud. It’s a great example of how taking the long view in architecture – doing the hard things like instrumenting code and building flexible systems – can pay dividends in agility and customer value.
We’re proud of what we’ve accomplished so far, but the journey isn’t over. We continue to onboard more data sources into the lake, optimize performance, and add new analytics features. If you’re an engineer facing similar challenges (or interested in these kinds of problems), we hope our story provides useful insights. And if you’re an Atlassian customer, we hope you’re already seeing the benefits of this work in your analytics, exports, and fast dashboards. We believe data belongs to our customers, and we’re excited to keep building systems that put that data to work for you