
Atlassian’s Cloud Engineering Overview
People. That is my leadership strategy – pure and simple.
- Find amazing people.
- Give them tools, frameworks, teammates, autonomy, and a mission.
- Do everything in my power to help them do their best work.
Over the last five years, we’ve done just that – created an amazing engineering team to help propel us forward on our cloud journey. We’ve been scaling like crazy, growing fourfold since I joined. And we’re not taking our foot off the accelerator anytime soon.
Every day, our engineers are driving new innovation, improving on how we build, ship, and run high-quality software for our customers. At the core of this are Atlassian’s values, our engineering philosophy, and our cloud foundation. Together, we’ve built a shared cloud platform that underpins our products and ultimately helps our engineers put collaboration tools in the hands of teams finding a cure for cancer, landing a rover on Mars, and increasing vaccination supply.
We want our customers, our partners, and the broader software industry to benefit from what we’ve built along the way. Hopefully, there are ideas here that others in our ecosystem can apply to their own businesses.
What excites me is knowing that this is just the beginning. We want to hear from engineers who want to get on this rocketship! So, read on to learn more about what we’ve built and imagine how we can help YOU do the best work of your life as part of the TEAM.
Visit our Careers page to find out more about becoming an Atlassian and building the future of teamwork
Contents
- Abstract
- Cloud applications infrastructure, services & tools
- Application development
- Common architecture patterns
- Atlassian Resource Identifiers (ARI)
- Cloud resource provisioning & orchestration (Micros)
- Micros
- Costs management
- Data storage
- Service-to-service communications
- Inter-service REST APIs
- Event bus & inter-service messaging (StreamHub)
- Shared utility services
- Distributed cron triggers (Cronman)
- Configuration management
- Secrets management (Vault)
- Encryption framework for transmission or storage of sensitive data (Cryptor)
- Real-time communications for front-end applications (PubSub)
- Tenant-based services
- Observability
- Logging (Splunk)
- Metrics and time-series data storage (SignalFx)
- Distributed request tracing (LightStep)
- Error aggregation (Sentry)
- Distributed, synthetic monitoring (Pollinator)
- GraphQL schema observability (Apollo Studio)
- Front-end Observability
- Build & deploy infrastructure
- Build & deploy pipeline
- Service and application deployments (Spinnaker)
- Build and deploy artifacts (Artifactory)
- Product localization & internationalization
- Code quality & security scanning
- Feature flags (LaunchDarkly)
- Data services platform
- Data lake & warehouse (Socrates)
- Data ingestion
- Transformation and Query
- Visualization and dashboards
- Front-end platform, components & tools
- Application development
- Tech stack
- Reusable development patterns
- Atlassian Design Guidelines (ADG) & Atlaskit
- Atlassian front-end platform
- Server-side rendering
- Progressive rollouts
- Application development
- Mobile platform, components & tools
- Application development
- Tech stack
- Mobilekit
- Application development
- Cross-product experiences
- Identity and accounts (Atlassian account)
- Authentication
- Account profiles
- Administration experiences
- Access management
- Permissions
- User experiences
- Cross-product search
- User pickers, user recommendations, and user searches
- User activity
- Media file attachments
- Cross-channel notifications (Notification platform)
- Atlassian Mail
- Editor
- Renderer
- Identity and accounts (Atlassian account)
- Ecosystem and public platform
- Ecosystem, Apps, and Extensibility
- Application development platform (Forge)
- Ecosystem, Apps, and Extensibility
- Where to go for more
Abstract
All of Atlassian engineering builds upon common foundations in order to develop, ship, and run highly secure, reliable, and compliant software at scale. This guide introduces our shared services, components, and tools. This is not a detailed list of every service and component that we have built, but rather it serves as a “big picture” and gives entry points to discover more details.
Cloud applications infrastructure, services & tools
We use the following standard infrastructure, services & tools for building cloud applications.
Application development
We have three standard tech stacks for building backend cloud services and applications, Java/Kotlin, Node.js, and Python. Internally, we maintain a detailed list of recommended frameworks and libraries that include things like Spring Boot, Express, React, and many other libraries and tools that are evaluated and recommended by our team of experts.
Common architecture patterns
We rely on standard architectural design patterns across all our products, services & components. Our architectural patterns describe the preferred approach to solve common engineering challenges.
We rely on our library of patterns to:
- Document patterns and best practices in a consumable, consistent format, that includes code snippets, reference architectures, version information, and team feedback.
- Enable engineers to browse and explore our library of patterns so that they can be applied when called for, instead of spending time to develop a bespoke solution.
- Enable contribution back to the body of knowledge in a structured manner using a request for comments (RFC) or a pull request.
- Define a framework to identify, develop, and create new standardized patterns.
Atlassian Resource Identifiers (ARI)
An ARI is a globally unique identifier for content and shared objects across our products and services. Some examples of content identified by an ARI include pull requests, Jira issues, Confluence pages, Bitbucket workspaces, and many more. ARIs are used to identify individual objects as well as the containers that those objects exist within. We maintain an internal registry of ARI object and container types.
Having a common way of identifying objects and containers, enables us to build generic functionality that operates on these identifiers, like our Permissions service. For example, “grant read/write permission to object ARI to user UID”.
The combination of “unique identifiers for content” and “services that know how to operate on them” allows us to build cross-product functionality that remains product-agnostic. Some examples:
- Platform components like Comments or Mentions can perform permission checks independently from the host product.
- Given an ARI, SmartCards could render any Atlassian resource.
- ARIs could be used to identify which resources need to be stitched together at the GraphQL API Gateway.
Cloud resource provisioning & orchestration (Micros)
One of the most important aspects of the Cloud platform is the mechanism by which all resources are provisioned and deployed.
Micros
Micros is our orchestration system for automating the management, placement, scaling, and routing of containers. It uses the concepts of configuration-as-code, and immutable infrastructure, and encourages the design principle of Twelve-Factor Apps, which, when followed properly, yield more scalable and operationally mature systems. Micros is used for static apps and websites, as well as internal and external application services.
Micros uses AWS’s CloudFormation to deploy microservices within containers using AWS resources and an opinionated set of defaults. Developers provide a service descriptor file and a container image, then use the Atlas CLI (command-line interface) to tell Micros to deploy your service and the required constellation of supported resources, such as databases, caches, load balancers, firewall rules, etc. Micros then deploys all the necessary resources needed to match the state you’ve specified in your descriptor.
Micros provides:
- Managed deployments of microservices and all supporting services
- Supports blue/green deploys, and progressive deployments with automatic rollback
- Auto-scaling of resources
- Configuration as code, which results in a change management mechanism and a record of all changes
- Runtime configuration, environment variables, and adding secrets
- Default application security settings such as:
- Secrets management for connecting to internal resources
- Closed-by-default network policies
- Audit trails for all changes
- Access controls
- Tagging for resource tracking and costs management
- Integrations with all supporting services, including networking, observability, security services, alerting, service catalog, and others
- Disaster recovery, backups, and failover support
- Adherence to our compliance requirements
- Separate environments for development, staging, and production
- Artifact registry for storing and serving all dependencies
- Backed up by a team of engineers who are regularly maintaining and improving our infrastructure services
For more info on Micros check out our previous blog: https://blog.developer.atlassian.com/why-atlassian-uses-an-internal-paas-to-regulate-aws-access/
Nebulae
Nebulae is a tool we use to help develop and test Micros services in your local environment, prior to ultimately deploying them in the cloud. It is used to create sandboxed environments on your local machine, that can also contain simulacrums of the supporting resources, such as databases, caches, etc. This is useful for exploratory testing and running integration tests while the service is under development.
Instant micros
Instant Micros is a bootstrapping tool for quickly creating a new Micros service based on a boilerplate application for different tech stacks. It is used to create starter code for a microservice and contains quite a bit of boilerplate code for things like application logging, capturing metrics, building and deploying your service, configuration injection, etc.
Costs management
In order to account for our usage costs, all resources must be correctly tagged with information relating to the team and department that operates the resources. The basic tags include the name of the service this resource is part of, a name for this specific resource, the business unit that owns the resource, and the individual who manages the resource. We have a cost management tool known as Alfred, that ensures all resources are properly tagged according to our tagging policy. When provisioning services using Micros, the tagging information is taken from the service descriptor file automatically and no further attribution is necessary.
Data storage
There are many different options for storing data when developing a service using the Micros framework. Cloud applications can define the types of storage they need using a Micros service descriptor to define the requirements. Micros will take care of networking, security, backups, disaster recovery, scaling, compliance requirements, integration with observability tools, cost tagging, and other best practices. The options available are:
- PostgreSQL (or Aurora) via RDS for relational databases
- DynamoDB for key/value storage
- S3 for storing files (but if you’re storing media attachments, use the media service instead, see below)
- Redis or Memcached for caching and ephemeral storage
- AWS Elasticsearch for full-text search indexes
In addition, there are some higher-level services available for storing media file attachments, and full-text indexing and searching that will be introduced below.
Service-to-service communications
There are two main mechanisms we use for service-to-service communications, REST APIs and asynchronous messaging.
Inter-service REST APIs
Service authentication (ASAP)
Our services use “Atlassian Service Authentication Protocol” (ASAP) in order to ensure all requests are coming from an authentic, identifiable client. ASAP is our company-wide standard for authenticating internal REST API calls. It makes use of standard asymmetric cryptography and JSON web tokens (JWT). It’s been designed to minimize protocol overhead, especially the number of requests, and avoids the need for distributing secrets.
We recommend using the Service Proxy (described below) for off-loading ASAP authentication, however, stand-alone libraries are available in instances where using the Service Proxy isn’t feasible. Micros provides simple ASAP integration in the form of the internal key repository and a key-pair provisioning mechanism that provides ASAP keys to your service automatically.
For more information about ASAP and service-to-service authentication, see https://s2sauth.bitbucket.io/
Service Proxy
The Service Proxy is implemented as containers that are deployed alongside your Micros service or application, referred to as a “sidecar”. It’s designed to act as a low-latency, small-footprint proxy for all internal REST APIs calls. It provides common functions used in most incoming and outgoing traffic and has been built to save development time for anyone building services by providing a number of useful features, including:
- Standardized metrics and dashboards for service-to-service communications
- ASAP authentication for incoming requests
- Automatically adds ASAP tokens to outgoing requests
- Enables automatic service discovery by providing endpoint URLs for services you are communicating with. This includes a DNS pre-fetching function to eliminate DNS resolution in order to minimize latency.
- Connection pooling to minimize the overhead of connection establishment on each request
- Automatic retries for unsuccessful outgoing requests
- Rate-limiting on the inbound traffic of your service
The service proxy continues to be developed and additional features will be added including functions to improve working with databases and caches, among others.
Alternative to the service proxy for authentication (SLAuth)
As an alternative for using the Service Proxy, Micros offers another sidecar known as SLAuth, which can be used for authenticating other services, build tools, or Atlassian staff. It is recommended you use the Service Proxy, as it’s a superset of SLAuth’s functionality, unless there is a specific reason to choose SLAuth instead. The SLAuth sidecar can handle authentication for:
- Authenticating Atlassian staff using single-sign-on, when accessing your service via a CLI or a browser
- Authenticating CI/CD systems via build tokens
- Authenticating other internal services via ASAP tokens
Alternative to the service proxy for rate-limiting (Heimdall)
Heimdall is our rate-limiting solution that can be used by any of our services to control their incoming traffic, in order to protect itself from being overrun. Services can select different rate-limiting algorithms, define a custom policy, and Heimdall will advise whether requests should be allowed or rate limited. Rate limiting is useful for protecting our services against noisy neighbors, mitigating attacks, and avoiding unbounded volumes of traffic that might harm your service. Its policies are applied across all the nodes of a microservice within a region and its functionality can either be used as part of the Service Proxy, as a Java library, or as a sidecar.
Event bus & inter-service messaging (StreamHub)
StreamHub is our internal event bus that is designed to facilitate decoupled, service-to-service messaging via asynchronous events. Events are typically used to trigger functionality or store data in other downstream services. Any service can be an event producer, consumer, or both, but must be registered with StreamHub before first use. All events have a defined schema that is also registered with StreamHub prior to first use. To maximize utility to downstream services, events are intended to be fully self-contained, and simply document “something happened” with as much context as necessary. StreamHub is also used by almost all of our services for streaming events into our data warehouse.
StreamHub details:
- Asynchronous communication between producers and downstream consumers
- Producers don’t need to know anything about their consumers, or even if there are any consumers
- Optimized for batched delivery of a large number of messages, cheaply
- It is not optimized for real-time, end-to-end low latency event delivery
- At-least once delivery without any sequencing of events
- Producers send events to StreamHub through an HTTP API
- Consumers define a subscription to filter the events they are interested in and received messages via an SQS queue or a Kinesis stream
- Committed, documented service-level objectives (SLOs)
Shared utility services
Distributed cron triggers (Cronman)
Cronman is Atlassian’s distributed, Unix-like cron service that enables services to schedule recurring or one-time, time-based tasks for the future. Services can define jobs to be run on a schedule by using Cronman’s API. When the jobs are due, Cronman invokes the configured callback endpoint of your service, thus invoking your task. Your callback endpoint is typically an HTTP handler dedicated to invoking a specific job, but can also be a message consumer listening to a message queue for events produced by Cronman that will trigger your job.
The Cronman service can be used directly, via its API, or it can be configured in your Micros service descriptor.
Configuration management
Our configuration registry service is a highly-available, shared service that allows people, services, or CI/CD pipelines to register and distribute configuration objects under specific namespaces, each with its own access controls. Configuration objects are usually small configuration files or settings that a cluster of services needs to access during runtime. Services can watch for changes, allowing your app to reconfigure itself when they change. The configuration registry is not to be used for sensitive data like secrets or customer data, we have separate services for those data types.
Secrets management (Vault)
Vault is a secret management service created by Hashicorp that has been licensed by Atlassian and is available to all developers to help with injecting encrypted secrets (private keys, database passwords, etc.) into your applications. It stores secrets by encrypting them prior to storage and provides tight access controls and detailed audit logging, to ensure security. Our existing integration between Vault and our build & deploy services allows teams to securely inject secrets into applications at deploy time or runtime.
Encryption framework for transmission or storage of sensitive data (Cryptor)
Cryptor is an encryption framework designed to make it easy for everyone to encrypt and decrypt data using industry standards and best practices. It can be used to protect sensitive data when in transit between services, or stored at-rest. The data can then be decrypted when necessary. Cryptor utilizes the Amazon Encryption SDK to simplify the generation of envelope-encrypted payloads that are encrypted using the Amazon Key Management Service (KMS). However, Cryptor contains modifications to both the encryption and decryption code paths to provide fault-tolerant, multi-region support, and to enable high-performance caching, to minimize the requests to KMS, to reduce costs and latency.
Common situations where Cryptor is used:
- Customer PII (personally identifiable information) that is transmitted between internal services via StreamHub
- Storing database credentials
- Storing application-level secrets in a persistent storage service
Cryptor can be used either as a Java client library or as a sidecar that is deployed within your services’ container and accessed directly via a REST API running on the localhost.
Real-time communications for front-end applications (PubSub)
We have a shared capability for communicating real-time data into web and mobile applications, known as Front-end PubSub. It allows our services to push auxiliary events to web and mobile applications and provides a library that enables UI components to subscribe to these events. It is our facade/wrapper for PubNub, a third-party service.
Tenant-based services
Some of our products are tenant-based applications, meaning that when a user accesses one of these applications, they do so in the context of an organization/customer. In order to manage the per-customer data isolation, tenant-based applications use some common services to manage the tenant context.
Tenant provisioning & lifecycle events
New tenants are provisioned by the Cloud Provisioner service, which acts as the orchestrator of the tenant provisioning process after a customer initiates a new purchase or free trial. It handles events from our Cloud Order Fulfillments Service (COFS), which is described later in this document.
Also, when certain lifecycle events are triggered by our commerce platform, including things like deactivation, suspension, renewal, data deletion requests, etc. our tenant provisioning infrastructure responds to those lifecycle events and manages the appropriate orchestrated workflow.
Tenant catalog
The Catalogue service is a source of truth for all the tenant details. It is populated by the Cloud Provisioner service and stores the complete tenant state in a persistent database. It exposes an internal API that is used by other services for querying the catalog.
Serving requests across shard and regions
Tenants exist within different shards of our infrastructure and also exist within different regions. When a user who belongs to a tenant makes a request for a resource, that request is routed to the correct region and infrastructure in order to serve the request, along with metadata about the shards in which the tenant’s data resides. The sharding capability enables us to provide fault-tolerance, data residency, and disaster recovery while maintaining strict isolation of our customer’s data. The region routing and shard capabilities are shared across many internal systems that service APIs and end-user experiences.
Observability
We have several tools used for monitoring and debugging our applications and services whether they are in development, testing, or production. Many of these tools are provided by third parties, with some Atlassian-specific configuration and tweaks. When using Micros, these observability tools are already integrated but can be augmented by the application or service developer to include application-specific functionality.
Configuration-as-code for observability tools
In order to manage the configuration for any of the observability tools, we rely on a practice known as configuration-as-code, where all of the configurations for the tool including permissions, filters, detectors, alerts, dashboards, etc. are stored in text files within a source code repository. When the config files are updated, a provisioning tool (usually Terraform) applies the new configuration. This way of working gives your team the ability to use pull requests for reviewing all changes, a mechanism to recreate the configuration if it is lost or corrupted, and a record of what was changed. Manual configuration of observability tools is not recommended because it eliminates the ability to recreate the environment and track changes over time.
Logging (Splunk)
Our logging infrastructure consists of a centralized logging pipeline and Splunk, a third-party service. Splunk provides log indexing and search tools, which are available to every engineer. Integration with the logging pipeline and Splunk is provided by default for all Micros services.
The Splunk interface is primarily designed around ad hoc searches, normally used during the investigation of a problem. Splunk has an expressive search grammar, and highly configurable dashboards and graphs. Searches can also be scheduled so they are run on a recurring or one-time schedule in the future. Using it for alerting purposes is discouraged, instead, operational alerts should be sent through the alert service or through the metrics service (described below).
Application logs are an important part of Atlassian’s security infrastructure, providing raw data for alerting, anomaly detection, and security monitoring. They’re also useful for debugging, auditing, reporting, and analytics. We have a company-wide standard on logging that includes our policy on what can and can’t be logged.
Metrics and time-series data storage (SignalFx)
We use SignalFx, a third-party company, for our near real-time metrics and time-series data storage. SignalFx has a visualization tool that supports monitoring and alerting. Most teams send data to SignalFx via the built-in client for their chosen application stack, which forwards metrics to a StatsD sidecar service that runs on the host alongside your Micros service. Most teams also set up detectors to generate alerts when conditions are met.
SignalFx provides highly configurable dashboards and graphs, real-time alerting, and integration to Opsgenie and Slack. It also has long-term data storage that enables us to see how metrics change over several months. By default, all Micros services are automatically configured to emit a default set of metrics to SignalFx. The default set of metrics from Micros include common things like system & network metrics, and it is expected that you and your team will add application-specific metrics for your service.
Progressive deployments with anomaly detection
Micros supports progressive deployments where the deployment of your service occurs incrementally while the new version is being monitored to ensure the deployment is not introducing any problems in the production environment. Micros can use the metrics in SignalFx to determine the health of your service as the latest version is being deployed, and roll back the deployment if necessary.
Distributed request tracing (LightStep)
We use LightStep, a third-party distributed request tracing service. It enables us to view client requests as a correlated trace through all of the services that are involved in the client request. It allows us to see how one service fits into the larger constellation of services that are involved in the handling of a customer’s request. We use it for performance analysis, debugging, and dependency visualization. Request tracing uses HTTP headers to pass contextual data between services, allowing a centralized aggregation platform to correlate data from all of the services together, to form one complete picture for the entire request stack.
Tracing relies on all services adopting and adhering to standard conventions for trace headers. In order to correlate your services’ traffic with all of the other services involved in a client request, your service must adhere to our request tracing standards.
Micros services include a tracing sidecar container that provides a local endpoint for your service to submit tracing data to. Using the sidecar is the recommended way of integrating most services with LightStep. In addition, your service should use the Zipkin client library that is included in our tech stacks in order to enrich your requests with trace information for your service. Asynchronous messages can also be traced including events published to StreamHub, SQS, or Kinesis, where it makes sense to do so.
Error aggregation (Sentry)
Sentry is a third-party service available to us that is used for aggregating and alerting on application-level errors generated by services, web apps, and mobile apps. Normally, these errors are emitted to Sentry in exception handling code within our applications. Sentry provides tools for filtering, analyzing, and visualizing runtime errors and also has a mechanism for triggering alerts. It can be configured to have visibility into your code, providing correlation between your source code and any errors that are raised, in order to allow easier debugging. It will also provide an event stack that helps you visualize the code path that triggered the error. Sentry alerts can be forwarded to other services via webhooks, or through direct integrations with Slack, Opsgenie, and others.
Distributed, synthetic monitoring (Pollinator)
Pollinator is our internally developed, distributed monitoring service that provides remote polling of endpoints in order to monitor the endpoints of our services. Pollinator monitors uptime and is also used for continual testing of end-user transactions. It supports basic HTTP requests (with ASAP, if needed), page loads, as well as more advanced synthetic checks to imitate real users. Synthetic browser clients can be configured using Selenium and Cypress scripts. Pollinator also helps us recreate the exact timelines of incidents when they occur.
When you deploy a Micros service, Pollinator sets up a job to automatically monitor your services’ health check endpoint. If you happen to change your health check endpoint, Micros updates Pollinator on the next deployment. Monitoring jobs will also be automatically set up for any deep check endpoints you configure as well. Pollinator is integrated with Slack, Opsgenie, and our incident management tools and processes.
GraphQL schema observability (Apollo Studio)
Apollo Studio, a third-party tool, is used in both development and production to track the evolution of GraphQL schemas over time and identify breaking changes. It also highlights existing queries that would be impacted by schema changes. In addition, it surfaces detailed usage and latency statistics.
Apollo Studio is integrated with our GraphQL Gateway’s schema build and publish process, so teams exposing APIs via the gateway benefit from Apollo. Teams are also encouraged to use Apollo directly to monitor and evolve their APIs. It is integrated with our internal single-sign-on (SSO) system so any employee can use it.
For more information on Apollo Studio, check out: https://www.apollographql.com/docs/studio/
Front-end Observability
Browser metrics library (Metal)
Metal is our front-end client library used for capturing and reporting browser metrics. It is designed to include a default set of metrics, that can be augmented with any additional metrics you need for your application. The library has helper functions to aid in capturing your own custom measurements. The default set of metrics include error, reliability, and performance metrics for pages, components, and user interactions.
Metal transmits the metrics to SignalFx for monitoring and alerting.
Front-end analytics, monitoring, and alerting (FAMA)
FAMA is a bridge between our Analytics pipeline and SignalFx that enables the usage of operational analytics events to monitor and alert on the health of product experiences. It transmits our metrics to SignalFx for monitoring and alerting as well as to our data warehouse for analysis and machine learning.
Build & deploy infrastructure
There is a dedicated team at Atlassian that is responsible for managing our build, CI/CD, and deployment infrastructure. Their mission is to ensure we have a fast, powerful, and reliable way to build and deploy services and applications. There are detailed how-to guides available on how to use all of the build and deploy infrastructure.
Build & deploy pipeline
Our teams use two different CI/CD systems for building and deploying cloud applications and services, depending on their needs:
- Bitbucket Pipelines – is part of Bitbucket Cloud, and is the preferred mechanism for managing builds and deploys for most services.
- Bamboo – is a stand-alone CI/CD server, with several instances, that are used to build and deploy some applications and services at Atlassian.
Service and application deployments (Spinnaker)
Spinnaker is an open-source, multi-cloud continuous delivery platform for releasing software changes with high velocity and confidence. Our Spinnaker service has been extended to work on top of our internal platform to help you deploy and manage your Micros services.
We have begun using it for:
- Simple blue/green deployments of Micros services.
- Progressive rollouts of Micros services
- Advanced deployment use-cases such as soaking, controlling the deployment to certain time windows, or canary analysis during your deployment.
- Deploying front-end, single-page application progressive rollouts in combination with Janus (introduced below).
Build and deploy artifacts (Artifactory)
We use Artifactory, a third-party service from JFrog, to host our private build and deployment artifacts, including npm packages, Maven packages, PyPI packages, container images, and any other artifacts used to build and deploy our products & services. We also use it to proxy the public registries (like npm.org, the Docker registry, etc.) when we access open-source packages, containers, and libraries to ensure that our builds and deploys are as fast as possible and that we are insulated from problems that those public services might be experiencing.
Product localization & internationalization
We have a dedicated team that is responsible for the localization of the product UI for all of our products across our mobile, web, and desktop applications. They primarily use a localization tool called Smartling to carry out localization with a fixed team of translators managed by one language vendor. If you are a developer on an internationalized product, you play a big part in ensuring our products are internationalized and localizable.
Code quality & security scanning
We have several tools that are integrated with our CI/CD services that are used for source code analysis. These tools aid in ensuring code quality, adherence to standards and help us to deliver secure products that are free of known security vulnerabilities.
Code analysis for quality (SonarQube)
SonarQube is a platform for continuous inspection of code that improves quality and security metrics. It performs static analysis, as part of the build process, to detect bugs, code smells, code duplications, security issues, and more. SonarQube can be used to create reporting dashboards for individual repositories and aggregate information in portfolios and apps. Depending on the metrics and analyzed language, build time artifacts like code coverage files might be required. The SonarScanner scans the code and sends it to the SonarQube service for further processing.
SonarQube can be configured to analyze pull request branches, in addition to the main branch. This can be useful to check the quality of branches prior to merging them into the main branch. SonarQube can be configured to annotate pull requests using APIs provided by both Bitbucket Cloud and Server. SonarQube integrations exist for our tech stacks and can be easily included in your team’s builds.
For more information about using SonarQube for your builds, refer to https://www.sonarqube.org/
Code analysis for security (Security Assistant)
Security Assistant is our internal tool that runs security-related code analysis checks against our source code. It’s an important part of our application security program because it uncovers common mistakes and reveals security vulnerabilities before they are deployed into production. It uses a combination of in-house, proprietary, and open-source tools to scan the code within our repositories.
Each time you push code to a monitored repository and create a pull request, you will trigger an automated scan. Results will be displayed on your pull request so that you can make sure to fix any issues prior to merging.
For more information about our security practices, refer to https://www.atlassian.com/trust/security/security-practices
Feature flags (LaunchDarkly)
We use feature flags in our services and applications to control whether certain code paths are enabled or disabled at runtime. By default, our tech stacks contain feature flag SDKs that we use during development to put blocks of code behind a feature flag. Some examples of when we typically use feature flags are:
- Toggling new features on or off, in case there are problems with them.
- Test conditional implementations on production traffic without actually deploying another version of the code.
- Run user behavior experiments and gather metrics for A/B testing.
For serving and managing our feature flags, we use LaunchDarkly, a fast and reliable third-party feature flag service. The LaunchDarkly management application is used to create and maintain feature flags across our products and services. See https://docs.launchdarkly.com/home/getting-started for more details.
Data services platform
Our products and services produce a huge volume of data including runtime data from our services, product usage data, billing data, support data, marketing data, sales data, etc. Our data platform is used by almost everyone across Atlassian to perform tasks such as:
- Combine datasets from many domains to uncover new insights and trends, and support decision making across all activities at Atlassian
- Generate analytical artifacts (reports, dashboards, blog posts) to record and share their findings
- Discover trends and patterns in data, then work with domain experts to develop a deeper understanding of how our business is changing over time
- Find answers to questions about how our products are used and explore and quantify user behavior
- Train, tune, evaluate and publish machine learning models
- Track key metrics for our business including metrics like revenue, monthly active users (MAU), etc.
Data lake & warehouse (Socrates)
Socrates is our data warehouse in which we store many petabytes of data produced by our applications and services. All data in Socrates is stored using Amazon S3 in a compressed, columnar file format that supports high-performance interactive querying using SQL, Python, R, and Scala using our analytical engines.
Exploring the data catalog with Data Portal
Our Data Portal is a web-based tool that enables our data engineers, data analysts, and data scientists to browse detailed information about the data in our warehouse. It serves the following purposes:
- Make it easier to find or search for data in Socrates
- Help users understand which tables and reports have fresh data, have gone through proper testing, and can be trusted to be accurate
- Displays information about data lineage, so users can understand the flow of data
- Contains links to all of our various data tools, since there are quite a few
Data ingestion
Data is ingested into our data platform from many sources including our microservices, our web, desktop, and mobile applications, snapshots of our databases, and our observability and deployment tools, among others.
To send events into the data pipeline we recommend using one of the existing client libraries included in our frontend and backend tech stacks. They provide common functionality (e.g. batching and retry support) and APIs for each of the event types. Our client libraries transmit data events into one of two primary interfaces by which all data enters the pipeline, the Global Analytics Service and the Data Landing Framework.
Global Analytics Service (GASv3)
This is the core means of getting analytics events (behavioral and operational) from our cloud products and marketing sites into Socrates. GASv3 exposes an API that is used by all of our product analytic client libraries to transmit structured data into our pipeline.
Data Landing Framework (DLF)
Data Landing Framework (DLF) is the mechanism by which data from our microservices is streamed into our data warehouse. DLF consumes events off StreamHub and ingests them in batches in 1-2 minute intervals. DLF also stores a backup of the events in raw format (GZIP JSON ) in case there is a need to replay events in the future. DLF is also the backend for the GASv3 API service.
Replication of other data stores (Facsimile)
Our data pipeline can be used to replicate data from a system-of-record into one or more downstream data stores. This technique is used for applications such as search, caching, graph databases, ML, and other systems in which a copy of the original data is required.
Transformation and Query
Transformation as a Service (TaaS)
TaaS is our data analytics transformation service that allows us to create derivations and/or aggregations of data in our warehouse. It is used by our data engineers, analysts, and scientists who build transformation jobs and then run them on a schedule. TaaS ensures that our transformations adhere to our data management practices and policies. It is commonly used to create filtered and aggregated tables from huge datasets, to simplify and accelerate analysis and reports.
Airflow
Airflow is a third-party workflow scheduling and monitoring tool that we use to author and manage data pipelines. These workflows are implemented as directed acyclic graphs (DAGs) where each node is a task, which helps to visualize and manage jobs with complex dependencies. We typically use Airflow to schedule and monitor extract-transform-load (ETL) pipelines or Transform as a Service (TaaS) jobs.
Databricks
Databricks is a third-party tool we use to provide an interface similar to Jupyter notebooks that allow any employee to run queries or functions across our data warehouse. These jobs are written in R, Python, and SQL.
We typically use Databricks for:
- Interactive SQL queries
- Reporting and dashboards
- Advanced analytics and visualization with R and Python
- Machine Learning
Databricks is also the execution engine for most of our data visualization tools (Tableau, Redash, and Mode), as well as for our scheduled data pipelines (TaaS and Airflow).
Visualization and dashboards
We have several tools for visualizing data within our data warehouse. All of these tools are accessible by any employee and are typically used for creating dashboards and reports that are relevant to a team’s mission. The tools we use are:
- Redash
- Tableau
- Amplitude
- Mode
Front-end platform, components & tools
Atlassian developers use the following standard frameworks, components & tools for building web applications.
Application development
Tech stack
For web-app development, we have a standardized tech stack that is described in detail in our web tech stack recommendations.
Reusable development patterns
We intend to share architectural design patterns for front-end development across all our products, services & components. Our architectural patterns will describe the preferred approach to solve common engineering challenges. By sharing common patterns and practices, we are able to develop tools and automation that improve our efficiency, workflow, and quality.
Atlassian Design Guidelines (ADG) & Atlaskit
All of our products and applications share a common design framework known as ADG. Our design framework expresses our brand, establishes consistent visual foundations, and uses shared patterns and components for end-user interactions across all of our applications. The component library, styles, and resources that we use are all bundled together in a library that is called Atlaskit.
For more information about ADG, see https://atlassian.design/ or to jump right into our shared library, see https://atlaskit.atlassian.com/.
Atlassian front-end platform
Most shared front-end components are developed in a single, monolithic repository (mono-repo) and are distributed as NPM packages. Developing all shared components in a mono-repo eliminates the complexities associated with managing dependencies, since everything lives in the same repository. We also recommend that all new product front-end code is developed in this repository, for the same reason. Tooling has been built around this mono-repo to provide teams with a managed development and deployment tool-chain. The front-end repository tools include:
- Storybook for local development, unit, integration & visual regression testing, code style & project structure linting
- Automated CI and upgrade integration with Jira front-end and Confluence front-end repositories for packages
- Tools for managing deployments and rollbacks of Micros static applications
- A merge queueing system and automated flakey test detection
- Atlaskit dependencies that remain up to date at all times
Server-side rendering
Tesseract is our shared server-side rendering (SSR) service. Server-side rendering enables us to develop and deploy our single-page applications on the server-side so that the page assembly is done as close to the data as possible, in order to improve the page load performance time for our end users.
Each front-end application generates a single bundle consisting of concatenated application code that will be run by the Tesseract service. Tesseract’s Atlas CLI command is then invoked to deploy this bundle to the Tesseract service. Each bundle is run in a Kubernetes container to isolate different applications from each other. The Tesseract Atlas CLI command is also used to spin up SSR environments for local development & debugging.
The Tesseract service uses ASAP for API authentication and is integrated with our observability tools, including logging, metrics, and request tracing.
Progressive rollouts
Janus is a service that supports progressive rollouts of our front-end changes. It allows us to deterministically associate cohorts of users to certain app versions, and then adjust those buckets over time. The infrastructure that hosts the front-end apps can then use this information to decide which version to serve, and increase (or decrease) the number of users who are pinned to a particular version of the application.
When used in conjunction with Spinnaker for orchestrating deployments, anomalies in SignalFx metrics can be used as decision points to automatically pause or rollback an ongoing progressive rollout.
Mobile platform, components & tools
We use the following standard frameworks, components & tools for building iOS and Android applications. All of our mobile apps leverage shared code from Mobilekit, our module library (described below). The mobile editor, used in all of our mobile apps, is included using a hybrid model, where web-app code is embedded within the native apps.
Application development
Tech stack
For mobile development, we have standardized tech stacks used for developing our applications.
Mobilekit
Mobilekit is a collection of Android and iOS modules that are designed to accelerate mobile feature development. The modules encompass a broad range from low-level components such as analytics to fully implemented, high-level features such as sign up for new users.
Mobilekit exists for the same reason as other collections of reusable capabilities at Atlassian. Having a shared set of modules:
- Helps deliver a consistent user experience that leverages the Atlassian Design Guidelines (ADG) across all of our mobile apps
- Helps us fix issues faster since we only have to fix common issues in one place
- Enables us to spend more time focusing on new features rather than working on common capabilities that are shared across all apps
- Helps us comply with privacy and security policies as well as adhere to our own internal standards
- Allows us to share reusable modules that are performant and efficient
- Minimizes the number of third party libraries needed within our mobile applications
Cross-product experiences
Our products share many common experiences for end-users and administrators. These shared screens, interactions, and interfaces unify our products, providing a consistent surface area for the benefit of our customers.
Identity and accounts (Atlassian account)
All of our products have (or will soon have) a common account system for end-users. This is known as the “Atlassian account”. Our customers use their Atlassian account to access all of our products with one set of credentials and underone authentication session. The single account connects all information about a user including things like their profile, activity, settings, and privacy choices.
Authentication
Authentication occurs when a user accesses one of our products, APIs or services. We support many different common mechanisms of authentication including:
- Basic authentication (email address and password)
- Two-Step Verification (2FA via email, token, SMS, mobile app)
- A customer-supplied external identity provider (e.g. Active Directory) via an industry-standard known as Security Assertion Markup Language (SAML)
- Social logins including Google, Microsoft, or Apple
- OAuth and OpenID Connect
Once authenticated, our identity services maintain authenticated user sessions via a shared Session Service and Edge Authenticator. A valid session allows a user to move freely between all our cloud products and services without needing to re-authenticate, providing Single Sign-On (SSO).
Account profiles
An Atlassian account has a corresponding account profile, where users set and maintain their personal information such as email address, name, profile avatar, and public name. Using their profile settings, they can also make and update privacy choices for their account, which affects how their information appears to other users. All of our products interact with this common user profile capability whenever profile information is displayed or used.
Administration experiences
We have a central administration experience for end-users, called Atlassian Access, that is shared across our products. Administrators can use Access to manage their Atlassian products and settings. It allows them to:
- View and manage all accounts and groups that are within their company’s directory
- View and manage the DNS domains that are associated with their company
- Configure single-sign-on settings and password policies, and enforce two-factor authentication for their organization
- Use administration tools that support Atlassian Access and premium features
- Manage sites, including controlling if/how users are able to self-sign up to a site
Access management
Access management is how permissions are applied to grant or deny access to our products, APIs, and services. Our access management practices are applied across our account management system and permissions service to control permissions that grant access to our products and sites.
Permissions
Our permissions service is part of our access management capabilities, which provides a generalized mechanism to grant ‘principals’ (users, groups) access to ‘resources’ (e.g. issues, pages) based on an RBAC (role-based access control) permissions model. All of our products integrate with the permissions service, as a centralized method to control access to content.
User experiences
The following section describes end-user experiences that are common across our products. These shared aspects of our products serve to unify our customers’ experiences as they move between our products.
Cross-product search
Our cross-product search surfaces results including pages, tickets, and instances from across our products. It delivers a personalized search experience, by using contextual information about what spaces users work in, to provide the most relevant document(s) specific to each user. The search leverages permissions information and access controls to ensure the results only include information visible to each individual user.
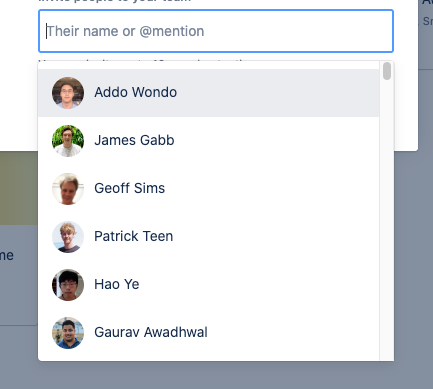
User pickers, user recommendations, and user searches

To deliver a more customized user experience, we developed a Smart User Picker. It is integrated with all of our backend services and provides context-sensitive, machine learning optimized search results. It suggests relevant teammates to collaborate with in different scenarios across our products, before a user types a single character.
User activity
Users can also view recent pages, tickets, and instances they’ve worked on through an activity feed that aggregates their activity across products. This allows users to quickly retrieve documents to help them start working and locate other relevant documents faster.

Media file attachments
We have services, an API, and UI components for uploading, storing, converting, and displaying media files across all of our products. The media file services and components handle many file types including images, video, rich documents, and smart links. These services and components support both web and native mobile environments and include:
- Media API: Manages storing, permissions, organization, conversion, and retrieval of media file attachments within our products
- Embedded cards: Card-like UI components that render for files, links, applications, and collections of media
- Pickers: Components for cross-product media picking, browsing, and uploading rich media formats
- Viewers and editors: Components for viewing, commenting, annotating, zooming, collaborating, and interacting with media files
Cross-channel notifications (Notification platform)
Our notifications platform is used to notify our customers via email, in-product web drawer, and mobile drawer experiences, and push notifications. The key value of this service is consistent, familiar, easy-to-access notifications across multiple channels, including email and an in-app notification list. It provides fine-grained controls for delivery that can be configured differently for each channel. When a user reads a notification somewhere, it’s marked as read everywhere. This eliminates the complexities of delivering notifications to end-users and provides the following capabilities:
- A set of reusable templates for common notification types
- Guaranteed delivery of notifications
- Analytics for notifications
- Control over how notifications are delivered
- Cross-product, in-app notification components (e.g. notification list & notification bell)
- In-product controls for end users which gives them a single control surface to manage all of their notifications coming from our products
Atlassian Mail
Atlassian Mail is a shared resource that provides an abstraction layer for all of the Email Service Providers (ESP’s) we use, in order to provide a consistent email delivery experience for the notification platform.
Editor
The Editor is our cross-product rich-text editor for both web and mobile. It is used across many of our products and has an extensive set of user experiences built-in, beyond just simple text editing. For example, it includes context-sensitive user picking, media picking and uploads, expressive collaboration experiences, reactions, and much more. The editor is available for both web and mobile apps and has several different layouts depending on the usage scenario.
Responsive web editor
The responsive web editor is a web UI component which allows end-users to leverage it either as a component embedded within a page (e.g. comments) or as a full-page editing experience.
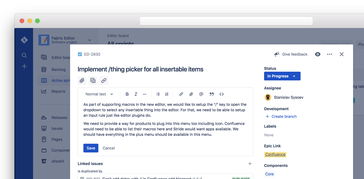
Editing within the context of an app 
Full page editing
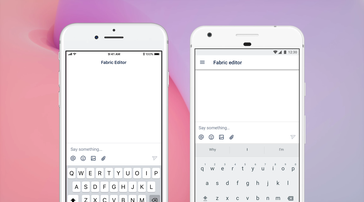
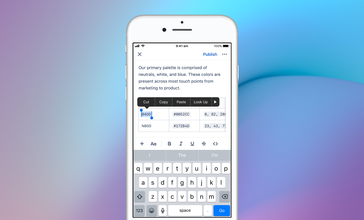
Mobile editor
The mobile editor is a hybrid implementation on both Android and iOS platforms that uses the responsive web editor in a webview and maps to native controls for things like menus and pickers. It aims to provide all the basic editing functionality for mobile applications.
Renderer
Alongside the editor is our cross-product, rich-text renderer for web and mobile. It provides a consistent rendering/reading experience within our editor. The editor and renderer use a proprietary document format to store the underlying document, which contains rich media, pickers, and expressive content, beyond what is included in other formats such as Markdown.
Ecosystem and public platform
Ecosystem, apps, and extensibility
Our products include mechanisms for creating third-party extensions and embedded applications that enhance our capabilities. We have a large ecosystem of developers who build these apps using our development platforms. In some cases, our development platforms are also used for internal feature development, because they enable us to build new functionality within the framework of our third-party apps.
Application development platform (Forge)
Forge is our cloud application development platform, used by third parties and internal development teams, for building add-ons, extensions, and integrations for our products. Forge applications are developed in Javascript or Typescript and are made up of the following components:
Sand-boxed compute
Application code runs within a wrapper runtime on the v8 Javascript engine on top of a serverless environment. The wrapper provides a layer of security by limiting applications to certain core libraries like file system access, networking, and others. Applications have limited runtime before being terminated by Forge to prevent runaway applications.
Forge provides applications with an egress proxy that manages all outbound HTTP requests. It also manages access tokens and authentication for both Atlassian REST & GraphQL APIs and outbound OAuth 2 requests to third-party APIs over HTTP.
Persistent storage
Forge provides developers with an API to store and retrieve key/value pairs that are housed in a hosted storage service. These key/value pairs are stored within a sand-box to ensure tenant and application isolation.
Scheduled, webhook & product triggers
Forge application can use scheduled triggers that call a function within the application as dictated by a schedule. In addition, Forge applications can use inbound webhooks to trigger a call to an application function whenever a webhook is called from an online source. Forge applications can also register to receive callbacks on a predefined set of triggers, specific events within each Atlassian product.
Declarative UI components
The browser-based part of Forge applications uses a set of web widgets provided by Atlassian. The widgets are designed to look and function like similar components in Atlassian’s products. Developers can include these widgets within their applications by using a proprietary declarative markup language known as UI Kit.
Custom UI within an iframe
Forge also allows developers to build their own UI using combinations of HTML, Javascript & CSS, but this custom UI runs within an iframe on the user’s browser for security purposes. The HTML, Javascript & CSS assets are hosted by Atlassian and served from a specific domain, utilizing an Atlassian-specified content security policy (CSP). The custom UI code running with an iframe has access to a Javascript bridge API provided by Atlassian that grants developers limited access to the Atlassian product in which the iframe is operating. All HTTP calls made from any browser-based code are routed back to the serverless portion of the application.
For more information on Forge, see: https://developer.atlassian.com/platform/forge/
Where to go for more
Hopefully, this guide has given you a high-level introduction to what is available within Atlassian’s platform. In addition to this guide, feel free to read through our Engineering blog for more about how we build at Atlassian. If you’re interested in joining us in our journey to reinventing the future of teamwork, make sure to visit our Careers page for open roles.