
Caching JQL search in Jira Cloud
Jira Cloud poses some unique database scaling challenges, due to high query complexity causing high database load and slow queries. Queries run against the database are often highly repetitive and on the surface very cachable, but are not currently being cached. Horizontal scaling is the main technique being applied to services within Jira Cloud to reach performance at scale, but this does not extend to its database, where it still depends heavily on vertical scaling and has reached the maximum provisionable AWS RDS instance size for some customers. Highly repetitive and expensive queries, combined with the limits of vertical scalability, mean that options are being explored for scaling our usage of the database.
There are multiple options being considered for database scalability, including read replicas, but these can be costly to run at scale when storing large quantities of data with high load. Given it’s a mix of both microservices and a very large legacy monolithic codebase, extra care needs to be taken to ensure existing code continues to work. Also, existing code often expects strong consistency, so introducing an eventually consistent solution can require significant rework. Instead, the preferred solution, where possible, is to reduce database load.
Recent additions to Jira Cloud are mostly in microservices, but the Jira Cloud monolith still contains significant amounts of Jira Cloud’s core functionality due to its shared history with Jira Server. Each customer has a Postgres database on which the core highly used functionality in the monolith exerts significant load. One such core area that exerts significant load today is JQL, Jira’s SQL-like language for querying issues. JQL is not only used by power users for performing advanced querying of issues, but it also backs many key experiences in Jira, including all Jira Software Boards and Backlogs, Jira Service Management Queues, and Dashboards. It is also frequently executed in places you would not expect, such as when loading an issue.
Multiple efforts are underway to improve horizontal performance at scale to JQL in Jira Cloud. One of the efforts currently being implemented is the JQL Subscription Service (“JQS”), a new intelligent JQL cache that can dramatically reduce database load and improve response times at the cost of some eventual consistency.

JQL recap
JQL is a query language similar to SQL – specifically, the SQL “where” and “order by” clauses. It is primarily used to query for a list of issues. For example, in Jira, I might have a project called “FOO,” and I want to find all the issues assigned to me ordered by a custom field:
project = FOO AND assignee = currentUser() AND status = Done ORDER BY "My Custom Field[Radio Buttons]" ASCThis will return me a list of issues, e.g. FOO-1, FOO-2, and so on.
Jira is very flexible in what it will allow an end user to configure, from issue types and workflows to security schemes and permissions. Each of these can appear in various forms inside the JQL, and some are present in the JQL above. This complexity means that the JQL query above gets converted to about 100 lines of SQL joining across 26 tables to accommodate this flexibility.
While the SQL query that was generated was very large, for the customer in production that is using it, this JQL only takes 33ms to execute. What makes this JQL have high cost on database load is where and how it is executed.
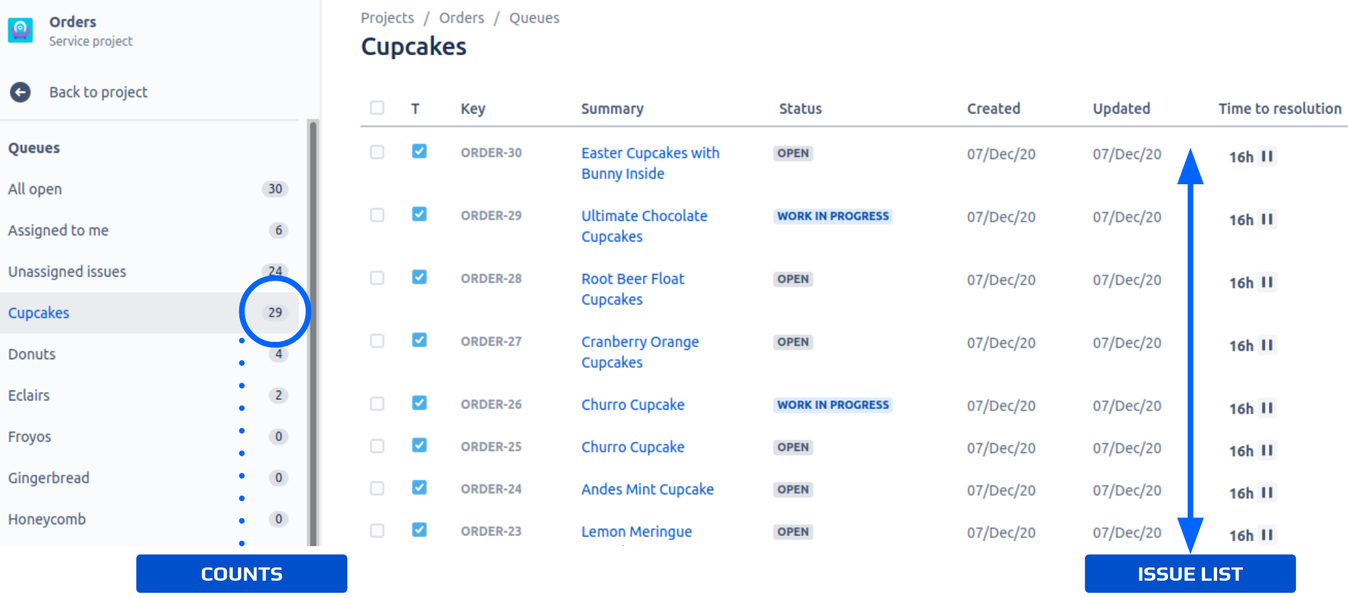
The JQL is used in a Jira Service Management queue, similar to the one pictured above. Queues such as this one poll the JQL every few seconds to keep the queue counts and issue list up to date. High frequency polling of slow and expensive JQL queries exerts a large amount of load on Jira Cloud, and can also make the customer experience feel slow.
A note on Jira and consistency
Jira and JQL today is, for the most part, strongly consistent.
Strong consistency is when a change has an immediate effect. This is most often noticeable with read-after-write patterns where what was just written (e.g., to a database) is immediately available to be read back. Eventual consistency is the opposite, when a change does not have an immediate effect. There is some delay between a change being made and it being possible to observe.
All caches, including those discussed here, have an element of eventual consistency included, which in this context affects the JQL. This can be caused by event propagation delay, invalidation time, races during processing, delays between requests, and deliberately introduced delays.
First iteration read-through cache
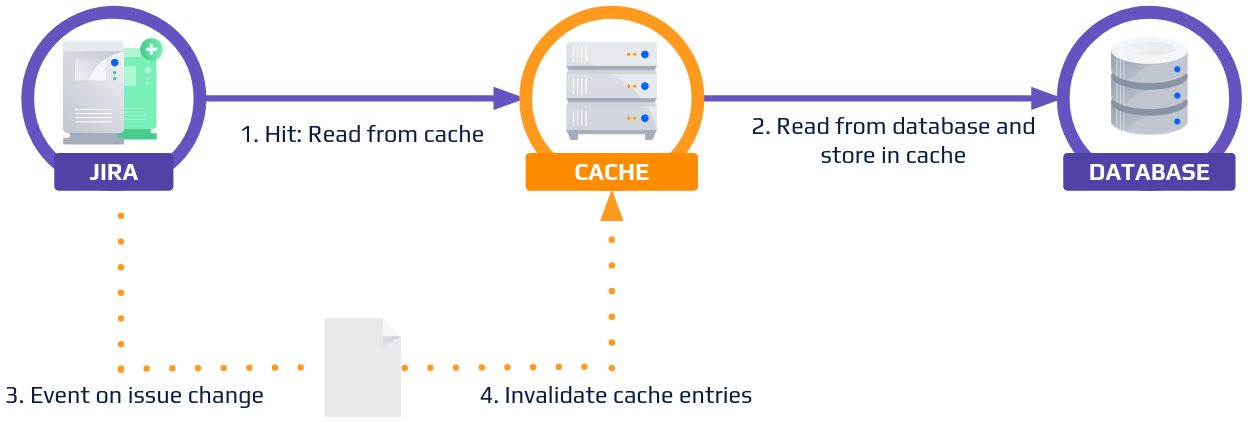
The first and easiest cache we could apply here is a read-through cache, backed by an externalized cache layer, such as AWS Elasticache for Memcached or Redis. In this caching solution, we populate the cache the first time a JQL is executed by storing the results of execution in the cache, then use an invalidation strategy, such as a Time To Live (TTL), or events to invalidate/remove data from the cache. All reads between population and invalidation are served from the cache rather than directly executing the JQL.
in cases like the Jira Service Management queue above, it is important that end users receive up-to-date results quickly – within 10 seconds, rather than minutes or hours. For this reason, we prefer an invalidation strategy that listens to issue change and project configuration events affecting the search results. This is done with a backup TTL because event streams can be unreliable.
This approach has many benefits:
- It is simple to implement – there is lots of tooling and libraries around this strategy already.
- It’s the same strategy that has been applied elsewhere, so it is easy to explain, document, and debug.
- It can provide something close to strong consistency, making integration with legacy code much easier.
- It has a safe fallback if the primary method of invalidation fails, e.g., for issue fields that do not emit change events, if event emission fails, or there is a problem that prevents the events from being received.
But is it an effective approach for caching JQL? Unfortunately not. JQL requires us to add some additional complexity to our solution to account for some dynamic concepts included in the language and its fields. Specifically, our solution does not account for:
⛔️ JQL is per-user. There are actually two problems here.
- User fields and functions. What is returned to the user from
currentUser()in the cache? Who is thecurrentUser()when a JQL is being executed on a user’s behalf by an Atlassian Connect app? - What if one user executing the JQL has permissions to see issues that another user does not?
⛔️ JQL is temporal, with now() and sla being good examples of these, often being compared to fields such as created.

When you execute the JQL, depending on when it is executed, these could have different values.
⛔️ JQL allows you to represent the same value and field in a range of different ways, e.g., project = FOO and project = 123, or assignee = matthew and assignee in (matthew). Two equivalent pieces of JQL may result in cache misses with the current solution.
Let’s address each of these issues in turn.
Second iteration read-through cache
For many temporal concepts, it should be possible to calculate when they will next need to invalidate the cache. For example, if we’re saying that we want issues older than five minutes, we should be able to determine from the contents of our cache when that is, and emit an event accordingly. Unfortunately, this doesn’t work so well for the sla field, which has a user-defined calendar making it quite difficult to determine when the next invalidation should be occur. It also does not resolve the per-user concepts or JQL equivalence.
But what if we didn’t need to cache the whole JQL, and instead only cached part of it? Not all of the JQL is expensive or slow, or has limitations, and we can take advantage of that to only cache what is needed. We refer to this approach as JQL Splitting.

JQL Splitting
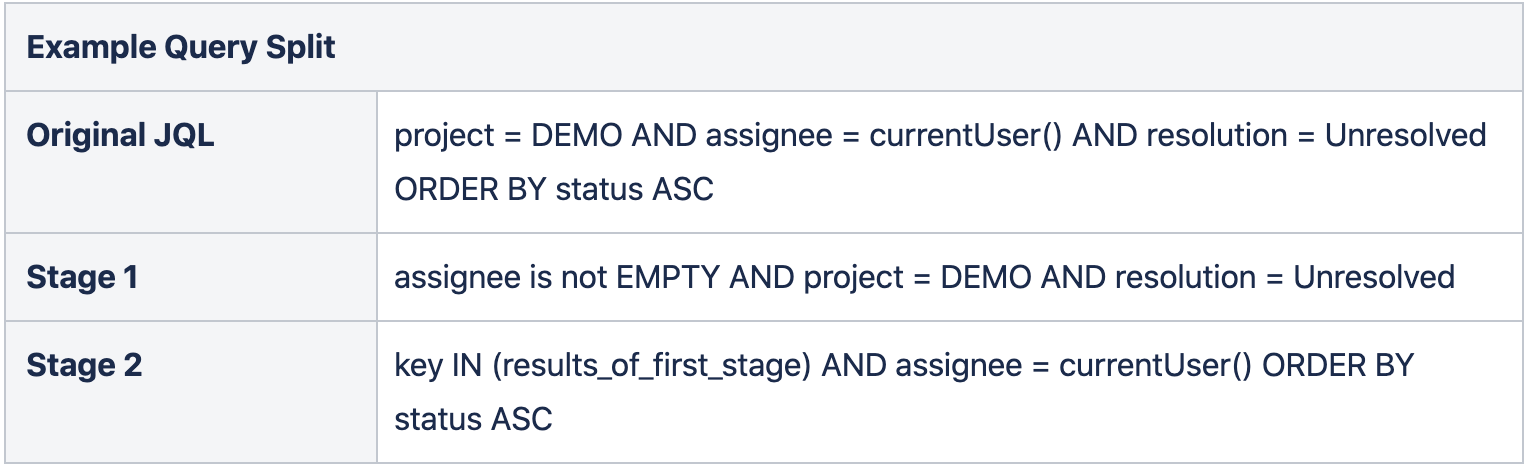
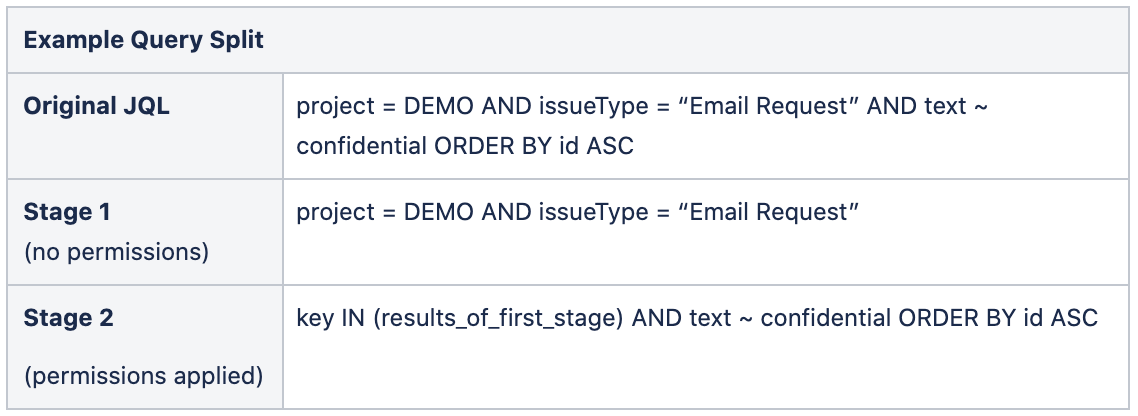
When populating the second iteration of our cache, we can parse the JQL that has been provided to us, normalize its components, and split it into two halves, known as the “Stage 1” and “Stage 2” queries.
Stage 1 contains JQL clauses that are not dynamic (not temporal or user or permission dependent). Dynamic clauses are removed from the JQL, but where possible, some of the dynamic clauses are substituted for placeholders to improve the filtering. For example, assignee = currentUser() becomes assignee is not EMPTY. The data returned from executing the Stage 1 query can be stored in our cache like it was before.
Stage 2 contains the rest of the JQL – that is, all the JQL clauses that are dynamic, as well the order. Ordering is not included in the Stage 1 query because it is possible to order by a dynamic clause, e.g. ORDER BY sla.
When requesting the results of JQL execution from our read-through cache, if results are present in the cache from the Stage 1 query, they can be retrieved and joined to the Stage 2 query by prepending key IN (results_of_first_stage) AND . This query can then be executed before providing the result to the user. Stage 1 consists of the majority of the total JQL results, making this Stage 2 query fast to execute, as it does not filter many issues from the results set.
✅ Looking at this solution in scope of the problems we had with JQL cacheability, it seems to resolve most of the issues we had:
✅ Per-user concepts are only applied for the user performing the query.
✅ Temporal concepts are applied only at request time.
✅ Since we’re already parsing the query to split it, we can normalize it at the same time to improve cache hit rates.
⚠️ We still apply permissions to what we’re storing in the cache, so one user being able to see results another user cannot is still a problem.
Permissions
Let’s look at the permissions problem a little more closely. Here again, we have two categories of problems:
- As a user, I can see/access issues that another user cannot.
- As a user with more permissions than another user, I can query data another user cannot.
With the split query solution, we can easily resolve the first of these permissions problems. If the Stage 1 query is executed without permissions applied, then having access to see more or fewer issues is not a problem. The fact that we will always execute a Stage 2 query, which takes permissions into account before returning the results to the user, provides us with the security we need because it is per-user.
The second of these problems is quite narrow in scope. There is only one place in Jira where you can apply a permission that would in turn affect the results of JQL on a per-clause level: comments. Comments in Jira can have permissions assigned, separating those who can see them. An example use case is a Jira Service Management agent responding to a helpseeker, versus that same agent communicating with internal teams about the issue. To keep a full history of communication about the issue in one place – while not exposing internal conversations to the helpseeker – comment-level permissions can and are used.
By adjusting our query split, we can treat searches over fields that include comments in the Stage 2 query, which is run in the context of a specific user with permissions applied correctly.
Tying the solution back to the problem we’re solving, we can give ourselves a ✅ because we’re applying permissions correctly, both to the issues within the cache and the clauses within the JQL.
Third iteration stale read cache
Our second iteration read-through cache is now ready! But is it an effective approach for caching JQL? Unfortunately, the answer is still no, – we’ve encountered some new shortcomings to resolve:
⛔️Events are very spammy, invalidating our cache sometimes at a higher rate than it is being read. This is because of the high frequency of issue changes, as well as bulk updates to events.
⛔️ The population of the Stage 1 JQL cache on a cache-miss can be slow. For example, the following JQL, which takes 30 seconds for one customer in Jira Cloud production:
project = FOO AND resolution = Unresolved AND queueType ~ supportQueue AND status = "Waiting for support" AND Incidents is EMPTY AND (team = "Product Team" OR assignee = "John Smith") ORDER BY cf[10301] DESCSlow cache population significantly increases the likelihood that another request for the same JQL will arrive before the cache has been populated, increasing the database load.
⛔️ When a cache miss occurs, the results are also slow to return, because the cache population blocks the caller.
⛔️ Events can arrive while the cache is being populated, which renders the cached results immediately invalid.
Again, let’s look at each in turn.

We can prevent the additional database load on cache-miss by having a per-JQL lock. This lock needs to work in a distributed environment to account for horizontal scaling. When the cache is populated, the lock is released, and all waiting callers receive the updated results.
The lock improves database scale, but our goal is performance at scale. Assuming we cannot improve the performance of the JQL (out of scope for this cache), we’re always going to have a slow Stage 1 JQL cache population. The slow population can cause a slow experience for the end user and can time out breaking what the user is trying to use. However, we could perform this work asynchronously with larger timeouts and serve the results when they are ready. The end user could receive a perceived performance boost in the interim time because we can serve the out-of-date “stale” already cached results until the update is complete.
This introduces a large amount of eventual consistency into our cache, but prevents broken experiences from timeouts and improves perceived performance. It also has some useful less-obvious side effects – if the cache update is asynchronous, the threads that were previously waiting for updates are returned to the pool to process other incoming requests, and the update does not need to be processed on the same node. The load can be distributed and balanced between nodes (we do this using Amazon SQS messages) and away from the nodes performing time-sensitive end-user requests.
Moving to using a lock and returning stale results while updating the cache asynchronously has also provided us with two options for resolving the spammy events problem:
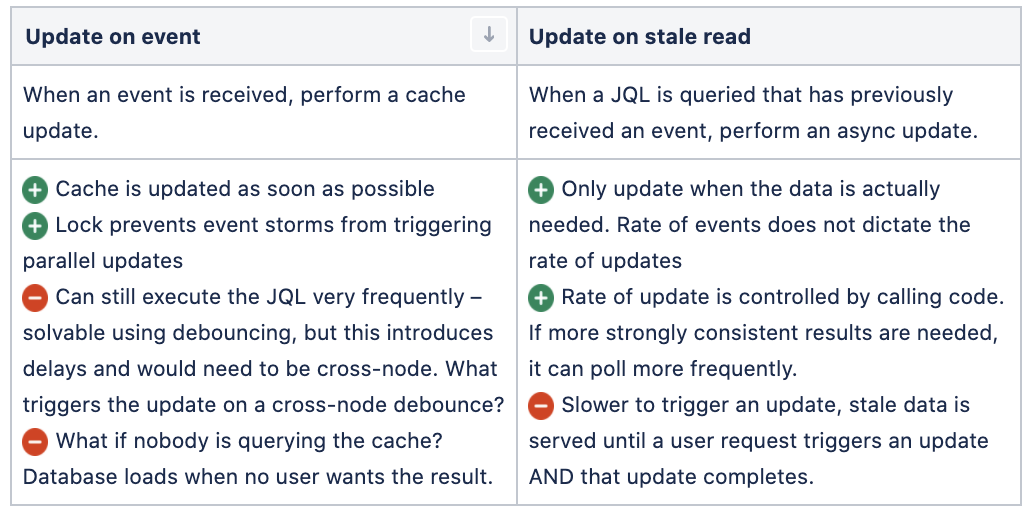
Based on the above and more, we chose to update on stale read. A flag is set in the cache whenever an event has been received for a JQL. The next read checks for this flag and updates if it is present, clearing the flag when the update is complete if no additional events have been received.
Has the third iteration of the cache resolved the problems we identified with the second iteration?
✅ Events are very spammy: Invalidating our cache was sometimes occurring at a higher rate than it was being read – cache invalidation is now decoupled from cache refresh. Cache invalidation is still triggered via events, but cache refresh now only occurs on a user request.
✅ Population of the Stage 1 JQL cache on a cache-miss could be slow: Cache population is now done asynchronously to minimize impact. A lock has been introduced to prevent multiple populations at once.
✅ On a cache miss, the results are also slow to return: Except for the initial cache population, now we never have cache misses. Instead, we serve stale data from the cache (fast) while the update asynchronously occurs.
✅ Events can arrive while the cache is being populated: Again, events are now decoupled from cache refresh, so an update to the cache will only be triggered when a user makes a request.
Fourth iteration: the JQL subscription service
So the cache is ready then, right?
No. There are still a few small problems to be solved
The third iteration of cache again had some issues we’d overlooked:
⛔️ Stage 2 JQL queries can still sometimes be expensive, and if polling frequency is high we’re still executing a lot of JQL very often.
⛔️ JQLs can return a very large number of issues. Caching all the issue data for all of these issues is going to require a very large cache to scale to Jira Cloud. Using an earlier example:
project = FOO AND resolution = Unresolved AND queueType ~ supportQueue AND status = "Waiting for support" AND Incidents is EMPTY AND (team = "Product Team" OR assignee = "John Smith") ORDER BY cf[10301] DESCThis JQL returns ~40k issues for a production customer.
⛔️ How exactly do we match events to JQLs? Aren’t there thousands of different fields and field types in Jira?
⛔️ What if JQLs are Stage 1 or Stage 2 queries only?

Expensive Stage 2 queries were overlooked earlier. All Stage 2 queries have two common properties: they are user scoped, and they are temporal. This makes caching them for anything more than a very short period of time difficult, but we can still cache them for that short amount of time. Acknowledging the irony, we can implement a version of the first iteration cache invalidated by both events and a relatively short TTL (5 seconds – we felt this was a fair balance between consistency and database load impact) to reduce the impact of Stage 2 queries when they are being queried frequently. This cache, also known as the per-user cache, is layered on top of the Stage 1 cache, which has a much longer TTL but is also invalidated by events.
To further reduce the impact of Stage 2 queries here, we must look at what experiences like Jira Service Management queues are doing with the data they receive. Most polls do not receive any changes – they are meant to detect changes, and apply them if there are any. Given we know when either Stage 1 or Stage 2 of the JQL changes – because we’re listening to events, doing cache updates, and intelligently invalidating data we store – we don’t actually need to execute either query to be able to report if we think there were changes (even if we don’t know what they are yet). Instead, a new API can be exposed that reports a “version” representing the current state of the JQL cache. When the results matching a JQL query change, the version changes, and this does not require the experience executing the Stage 2 query preventing needless database load.

This resolves the expensiveness of Stage 2 queries, but what about the next issue on the list – JQL returning too many issues for us to cache?
Caching too many issues is a problem of both data size in the cache and the size of the query. JDBC limits the number of values in an in clause being sent to Postgres to 32767 values (Short.MAX_VALUE). With Stage 1 queries that can exceed this, we either need to apply a workaround or set a maximum value. We chose to set a maximum value to avoid implementing hacks when they are mostly not needed, and because it allows us to progressively test and gain confidence at larger scales. To reduce the amount of data we store, we only store issue IDs, with data hydration being handled by a different Jira service if needed.
Another issue on the list was event matching. Event matching can be challenge, but we avoided this by simplifying what we match on. When parsing and normalizing the JQLs into Stage 1 and Stage 2 queries, metadata is also extracted from the JQL about specific fields, which our analysis has shown is frequently present in JQLs. Such fields include project, issueType, sprint, and status. The metadata is stored with the JQL and a subset of Jira events are subscribed to, informing us about a large number of changes in Jira. Whenever an event is received where the affected issue matches one of these subsets of fields, we treat that JQL as having been changed. It will result in more updates than needed, but we avoid having to understand every event type, every field, and every change. All changes that are not caught by events will either be caught by a future event or by the backup staleness TTL.
Lastly, we overlooked the fact that queries could be Stage 2 only. They will never be Stage 1, only because the Stage 2 query always contains key in (results of Stage 1 query). When they are Stage 2 only, this can be treated the same as Stage 2 without the key in prepended to the JQL.
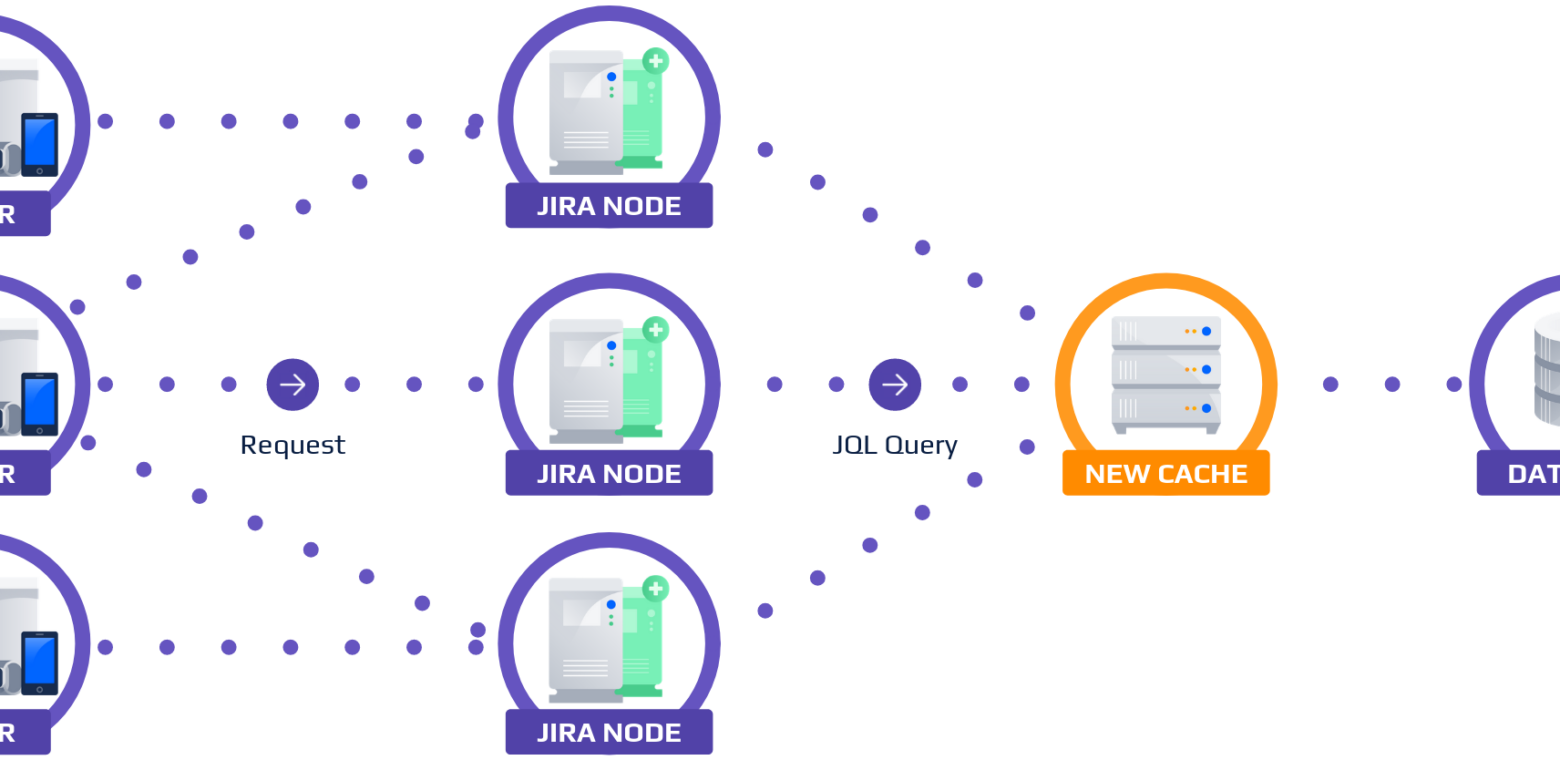
Considering everything from the iterations of the cache that has been discussed so far, as well as some things that were not discussed, we end up with a flow chart for the JQL Subscription Service cache that looks something like this:
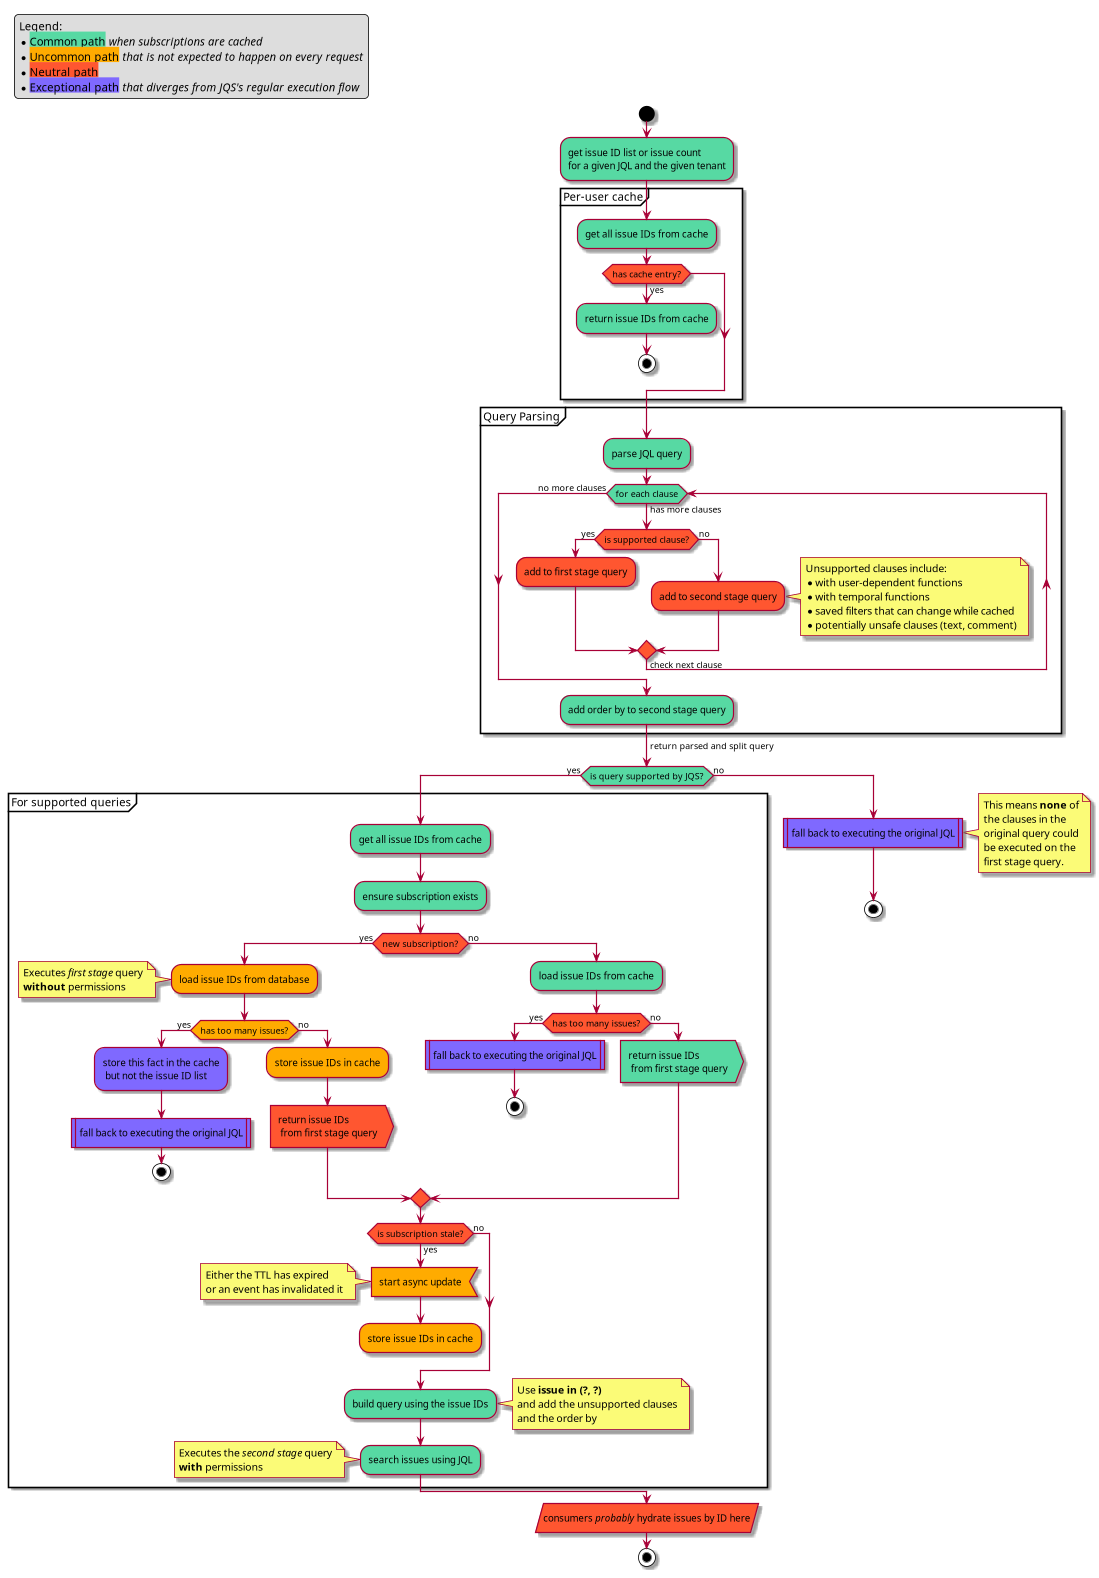
The cache itself is backed by Redis. It could have utilized another in-memory cache or persistent data store, but Redis was selected for a few key reasons:
- Expiry as a first-class citizen. To ensure that we do not serve stale data for too long, improve our ability to ship new changes without worrying about cache state, and enable self-recovery in case of cache-poisoning, having expiry as a first-class citizen is useful. Every key put into Redis, regardless of how long it is expected to live or be unchanged, has an expiry set.
- Complex data types and sets. The JQL Subscription Service primarily caches issue lists, so being able to do efficient operations over those lists using set operations – such as contains, add, and remove – without pulling the full list out of Redis has been very useful.
All JQL metadata and flags are stored alongside the issue IDs in Redis, with all of the different cached values for a JQL being referred to as a “subscription.”
Measuring the database load
How do we know that the cache we have designed and built above was making the right strategic changes at each step to deliver successfully? To do so, we needed to measure database load.
Measuring database load has many dimensions. You could measure using CPU time, IOPS, memory usage, execution frequency, execution time, or one of many more factors, or any combination of them. Amazon AWS also provides various metrics to monitor load at an RDS level. However, these are not as useful when the goal is to measure the load of a single JQL query across users.
As part of this work, we found that an approximation using time to execute the DB query, as measured by calling code, was an effective solution. Errors can be introduced from factors such as noisy neighbors, but JQL is one of the leading causes of this, and having it included in our metrics incentivizes finding solutions that will not be affected.
Measuring database load using execution time as an approximation does not account for one user being disproportionately affected by improvements. For example, user A could have a 50% improvement, but user B could have a 25% regression, for an average 12.5% improvement. Not only do we want to avoid regressions like this, but we also want to have higher throughput – that is, more users able to execute more queries with the same or less load.

DBLoadPerUser was the metric we used to incorporate this user component into the execution time database load measure and the main measure we used to determine success.
Results
The first target for the rollout of the JQL Subscription Service is Jira Service Management Queues (rollout is still in progress). To ensure ongoing improvements during rollout, we have separated the customers that use Jira Service Management queues into different groups by database load, putting similar tenants together. For the first five of these groups and our internal/staging customers, these were the results:

If staging and internal instances are included in the calculation, this accounts for an overall 76.6% reduction in DBLoadPerUser within the Queues experience. The improvements were not limited to database load, even though that was the primary goal. An average of 81% (~4 seconds) improvement in performance at p90 was seen in the REST APIs backing the queues experience.
The effect of enabling the service can also be seen in our metrics, where the peaks in load are now lower than the previous troughs.

For each customer in each group, the improvement has varied, but overall there were no regressions from enabling the service.
What’s next?
The JQL Subscription Service has proven to be a successful initiative for reducing the database load in Jira Cloud. Its intelligent cache can reduce database load by up to 76% per user.
While this version it is still being rolled out, there are many further iterations that can be done.
Specifically, there are more experiences in Jira Cloud to onboard, including Jira Software Boards; changes that will enable it to be integrated in experiences that only have a subset of their JQLs polled (e.g., search); and supporting a push-based model rather than just polling. Existing features can also be iteratively refined – event matching, for example, currently only matches on a subset of events and fields, and adding more could theoretically increase the database load impact by reducing the number of invalidations.
Our intent is to look at these and consider how we can continue to improve database scalability in Jira Cloud over the coming months.