
Over the past two years the Confluence team has spent a significant amount of time investing into improving performance – halving the 90th percentile latency for completing page loads https://community.atlassian.com/forums/Confluence-articles/Confluence-Performance-Journey-2x-Faster-in-1-Year/ba-p/3097191. One of the big change we have made in the last 12 months has been to introduce React’s new streaming capabilities for server-side rendered (SSR) apps. This has allowed us to significantly lower the amount of time it takes to make content visible in the browser and opens up further opportunities to improve Confluence’s performance. We’ve observed about 40% improvement for the first contentful paint.
In this post, we cover how we integrated React 18’s streaming capabilities into Confluence to reduce the time it takes to display content on page load. These foundations have enabled us to further optimize how the page is loaded – ensuring pages are visible and interactive faster.
Page Load Performance Metrics
In order to understand how streaming impacts page load performance – we will first cover what metrics we use at Atlassian to measure and understand page loading performance. We track a fairly broad range of metrics for page load times – but some key metrics we track include:
- First Contentful Paint (FCP) measures the time it takes for the first visual elements to be rendered within the browser when loading a page. This could be the entire page or just a small first subset like the navigation menu. A low FCP typically helps users see a page loading earlier, making the page feel more responsive.
- Time to visually complete (TTVC) measures the time it takes to render the entire page, in particular, how long it takes for the entire page to settle. Importantly, TTVC requires elements to be loaded and not to shift; as such, a low TTVC number makes the page feel significantly faster. On the Confluence team, our target is to have 90% of the page visible and stable as quickly as possible (VC90).
- Time to interactive (TTI) measures how long it takes for content on a page to be able to handle user interactions. This usually requires JavaScript code to be loaded and executed. A low TTI indicates that the page is ready to be used sooner.
- Hydration Success Rate measures what percentage of pages that are successfully hydrated in the frontend. If the percentage drops, then more pages are falling back to frontend rendering – which will likely impact both TTVC and TTI.
How We Implemented Streaming SSR
Streaming SSR with React 18
In a typical React single-page application, the browser must fetch and load static assets, and then fetch data from a server, before the page contents are visible to the user. This results in a slow initial load for users, particularly if their network is slow or has high latency (as it takes a long time to fetch assets and data), or if their CPU is slow (as code is slow to parse and execute).
On Confluence, we have been investing in SSR to ensure that the product loads as quickly as possible for all users. By executing client code first on a server close to our backend servers, we can ensure that the user sees a visually complete page faster. The key drawback with this, is that we must load almost all data and render markup before responding to the client – increasing the time to see the page.
With the release of React 18, several new capabilities were introduced to React, enabling apps to further improve their loading performance in the browser. One of these new capabilities was the ability to emit parts of the page markup as the page is generated, rather than requiring the page to complete rendering. This allows the browser to display the rendered markup as it arrives, to begin fetching and loading static assets earlier, and to become interactive sooner.


Adopting React Hydration
When SSR was first introduced for React, applications would need to discard the server response on the frontend, replacing it with the frontend-rendered equivalent. This was considerably slower and had the potential to lead to jank in the UI when DOM nodes were recreated.
With more modern versions of React, it is possible to reuse the existing markup from the server using a technique called Hydration. When React hydrates in the frontend, it iterates through the component trees and checks that the markup is identical to the markup produced on the server. In the event this succeeds, it attaches any necessary event handlers and side effects, and the app becomes interactive.
Hydration allows apps to reduce both the time until visually complete (TTVC) and the time to interactive (TTI) by quickly reusing existing nodes. Hydration requires identical markup to complete successfully – in the event it is not identical it requires the page to be re-rendered on the client which can have a negative impact on overall load times.
Adding Suspense Boundaries
React allows apps to wrap parts of their component tree with a <Suspense /> tag, creating a suspense boundary. If a pending dependency is encountered React discards rendering anything up to the nearest suspense boundary. Anything within the suspense boundary can then be replaced with a loading state and sent to the client.
Suspense boundaries work in both frontend-rendered apps and SSR apps when combined with renderToPipeableStream or renderToReadableStream, depending upon your SSR environment. When executed in a server environment, React will emit all markup in any rendered suspense boundary and then stream the markup for subsequent boundaries as their dependencies are resolved.
To stream this content to the client, React adds additional markup to the page to denote pending suspense boundaries and completed markup, along with a small amount of inline JavaScript to update nodes before the page is ready. Suspense boundaries are surrounded by special marker comments – <!–$?–> and <!–/$–> when pending, and then transitioning to <!–$–> when the boundary is resolved.
<!-- initial markup containing a suspense boundary with id B:1 -->
<div>
  ...
  <!--$?-->
     <template id="B:1"></template>
  <!--/$-->
  ...
</div>
<!-- chunk -->
...
As completed chunks arrive in the browser, their existing loading placeholders are replaced with the loaded chunks – making the content visible to the user.
Streaming Data
Confluence makes use of NodeJS streams for it’s streaming implementation – taking the result of renderToPipeableStream and piping this into several transforms before returning the content to the frontend.
To successfully hydrate content on the frontend, the page needs to have access to the same state that was used to render the page on the server. As part of introducing streaming to Confluence we build a set of data streaming abstractions that allowed us to both inject arbitrary markup in the page produced by react and to inject data into the markup that can be consumed within the page on bootstrap.
// On the server
const stream = getServerStream<TestObject>('data-stream');
stream.emit({ value: 'test1' });

// Later ...
stream.emit({ value: 'test2' });

// On the client
const client = getClientStream<TestObject>('test-1');
client.addListener(({value}) => console.log(value));

// Logs:
// 'test1'
// 'test2'
This data and markup is injected into the returned HTML markup via the use of a NodeJS transform stream, which buffers data while react is generating markup for a specific suspense boundary – and then emits data before emitting the associated markup. This cycle occurs several times during page rendering as chunks are produced an emitted to the client.
The transform makes use of setImmediate to signal when react has finished a chunk, and to prepare to flush data again. The app also uses this as a signal to trigger flushing the current buffer to the frontend – as otherwise the compression middleware would hold onto part of the response preventing it from reaching the client when ready.
Sequencing the data before the markup for each chunk is important as it ensures that when hydration is triggered the data is already available. If this is not correct – the page may not hydrate correctly as there may be a state mismatch.


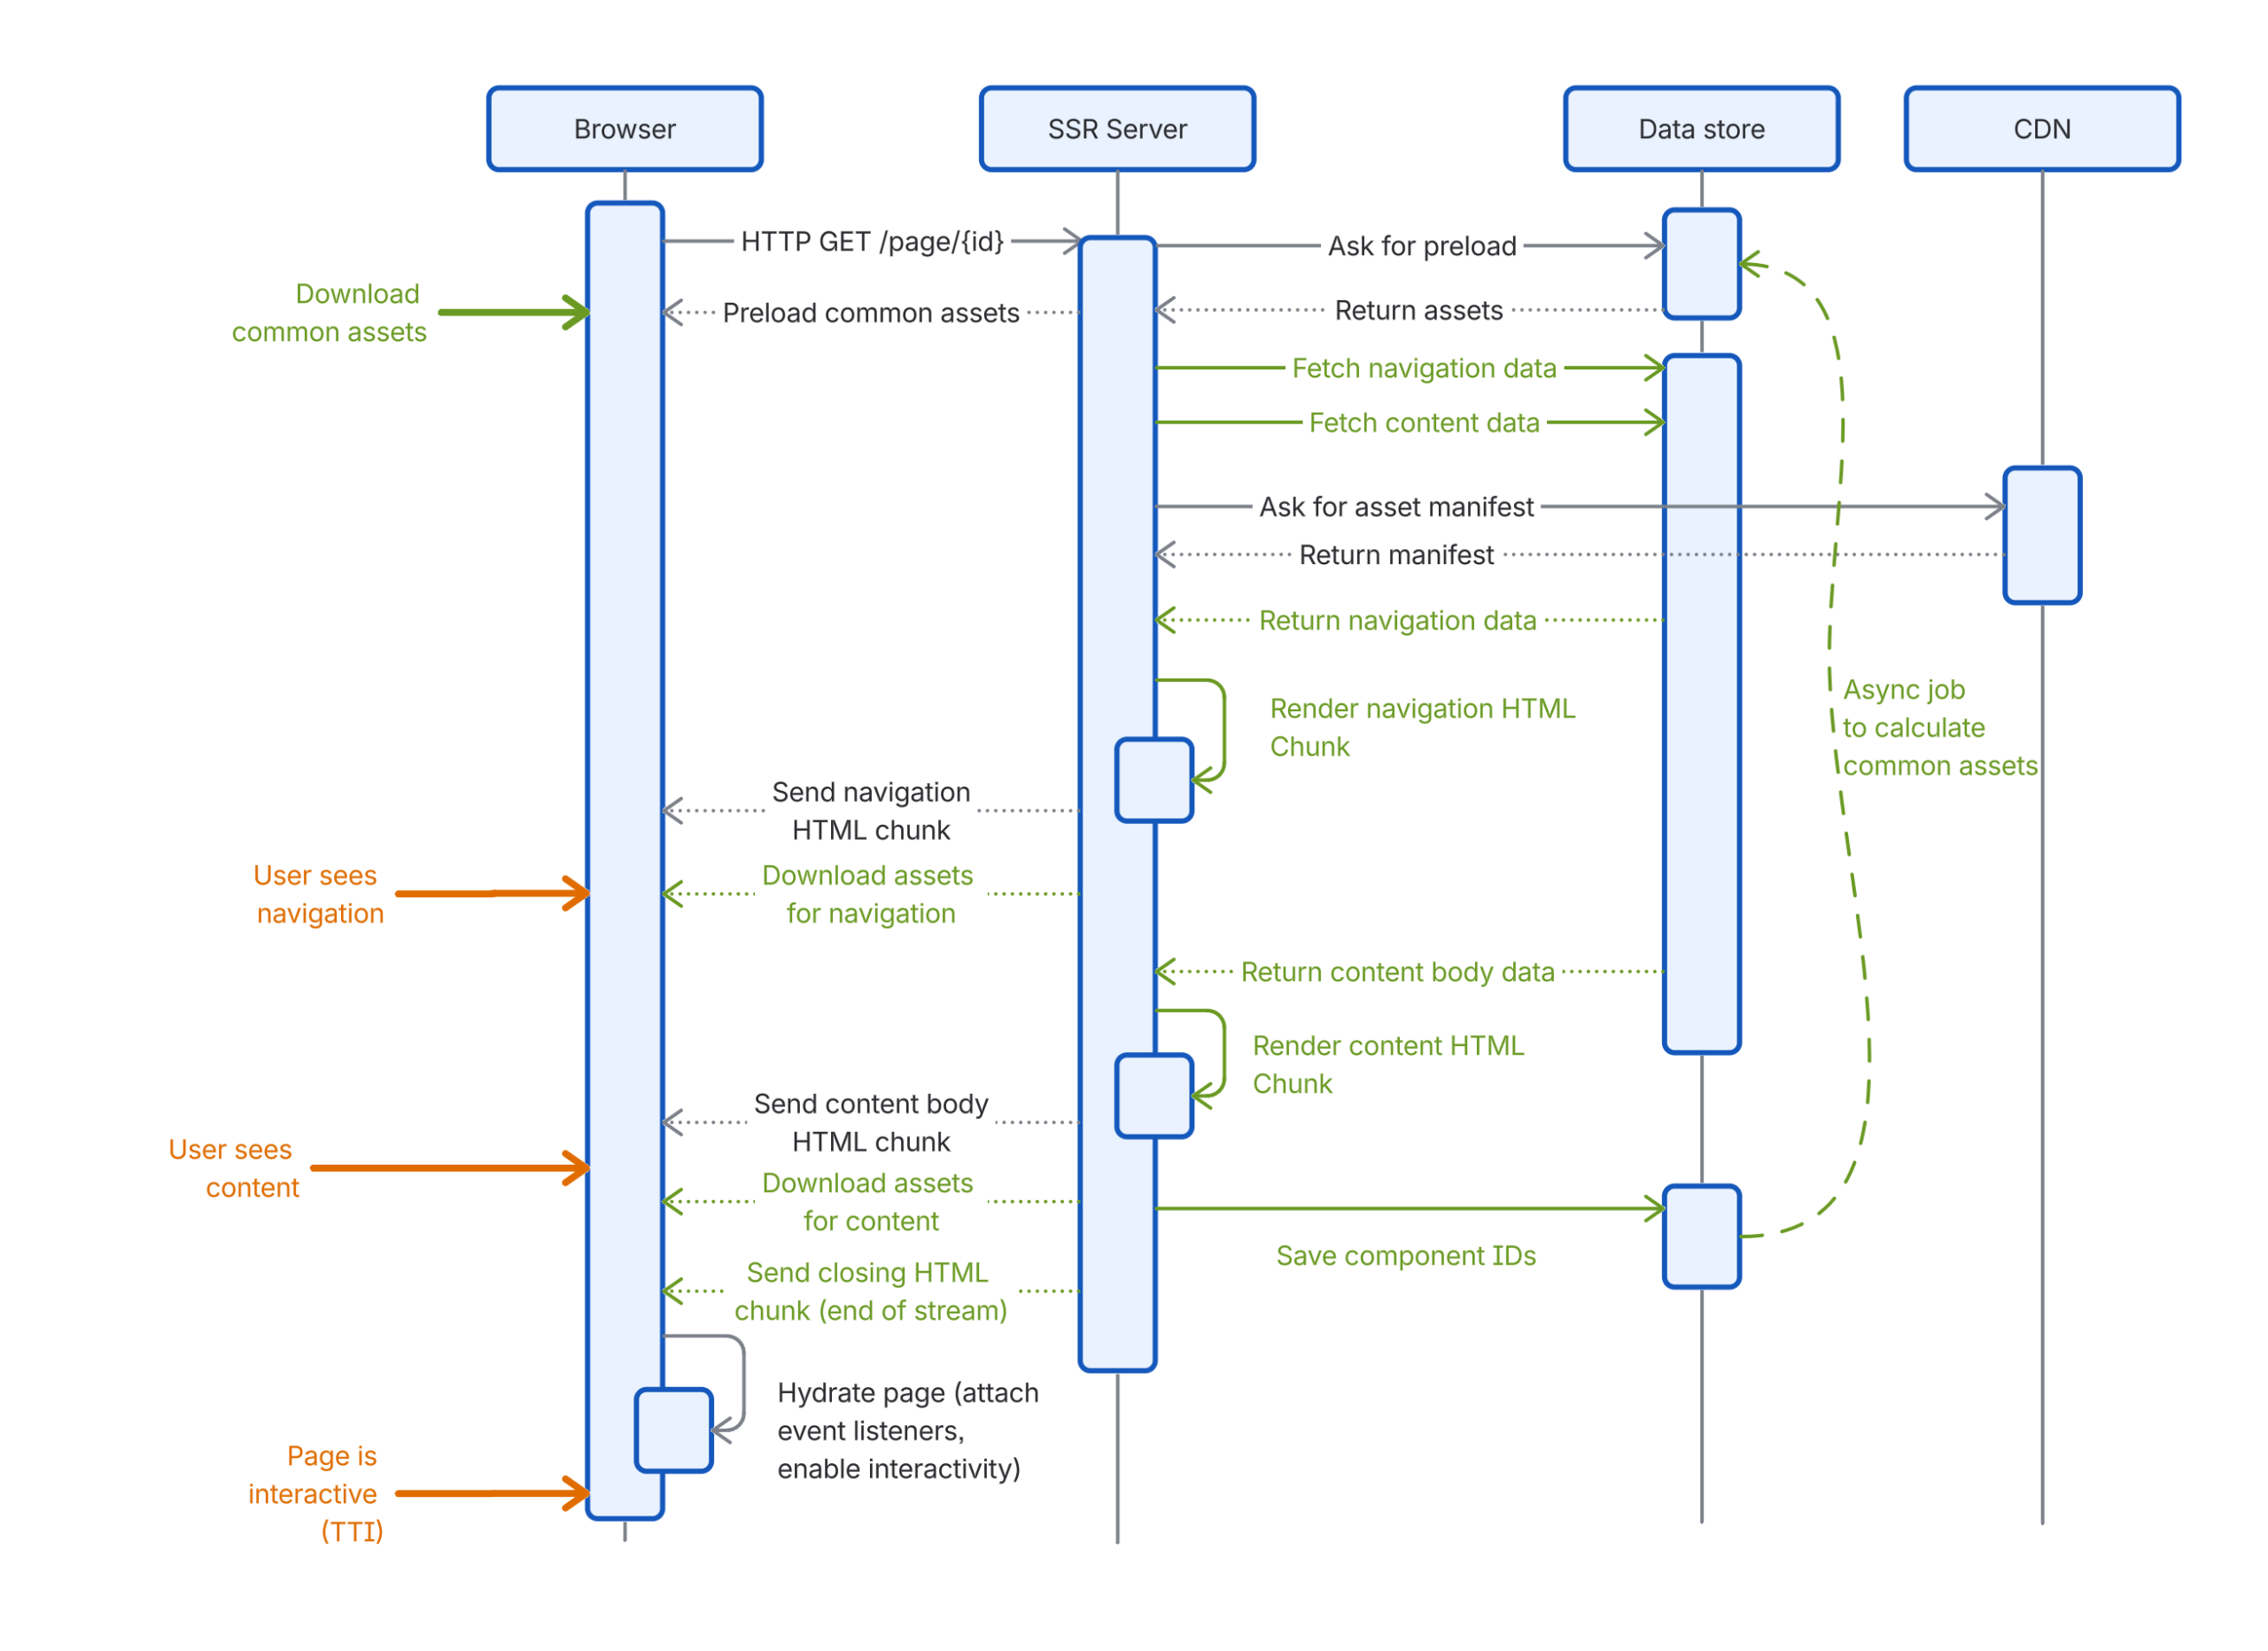
From the above diagram:
- React renders components, emitting markup as it completes rendering sets of components
- As React components are rendered they emit data via our data streaming abstractions
- This data is buffered in the order it was emitted
- The transport stream is always in one of two states – either streaming markup or waiting. When markup is received from react it immediately flushes buffered data and starts streaming markup. It waits for a setImmediate before transitioning back to waiting.
- Chunks are passed through compression middleware, and flushed upon a setImmediate event being triggered
- Chunks are received and hydrated in the client.
Optimizing Client Asset Loading
In an SSR rendered app, download assets is an extremely slow step and was delayed until quite late in the page load as we don’t know the required assets until after rendering. This can have a significant impact on when the app is able to be interacted with by users (TTI).
Here is a typical component tree for a Confluence page. Boxes in orange dotted lines are dynamic splits; they are features that get conditionally loaded based on the content.


When rendering on the server side, as we render these components we take note of their IDs. After the server-side rendering is done, we cross-reference a static manifest file generated at build time to figure out the required bundle assets that the client needs for hydration. Then we ask the browser to download these files and hydrate the page.


As you can see from the above sequence diagram, asset downloading happens quite late and is a blocking operation before hydration. To mitigate this, we added a feedback loop so that we can predict what JavaScript the browser will need based on the previous render results. This way, we can let the browser download them much earlier. Although hydration is still blocked by asset downloading, we have preloaded the majority of the assets, making it much faster than before. This optimization successfully cut down nearly half of the interaction-ready time.


Client Asset Preloading During Streaming
Despite our attempts to predict the assets needed for the page, it’s not perfect. Different Confluence pages use different features; for example, some pages have a Table of Contents, some have Charts. The prediction will only generate the list of assets commonly used for every page. For those components that differ from page to page, the hydration process still needs to wait for the server-side rendering to finish.
Firstly, streaming breaks up the two big steps: loading data and rendering into logical small tasks. We are able to render small sections of the page and send them back to the browser much earlier. For example, navigation is usually lighter than the content body. Instead of showing the user a blank page while waiting for the server to render, we can deliver the navigation much earlier. This improves FCP (First Contentful Paint), as well as the user’s perception of performance.

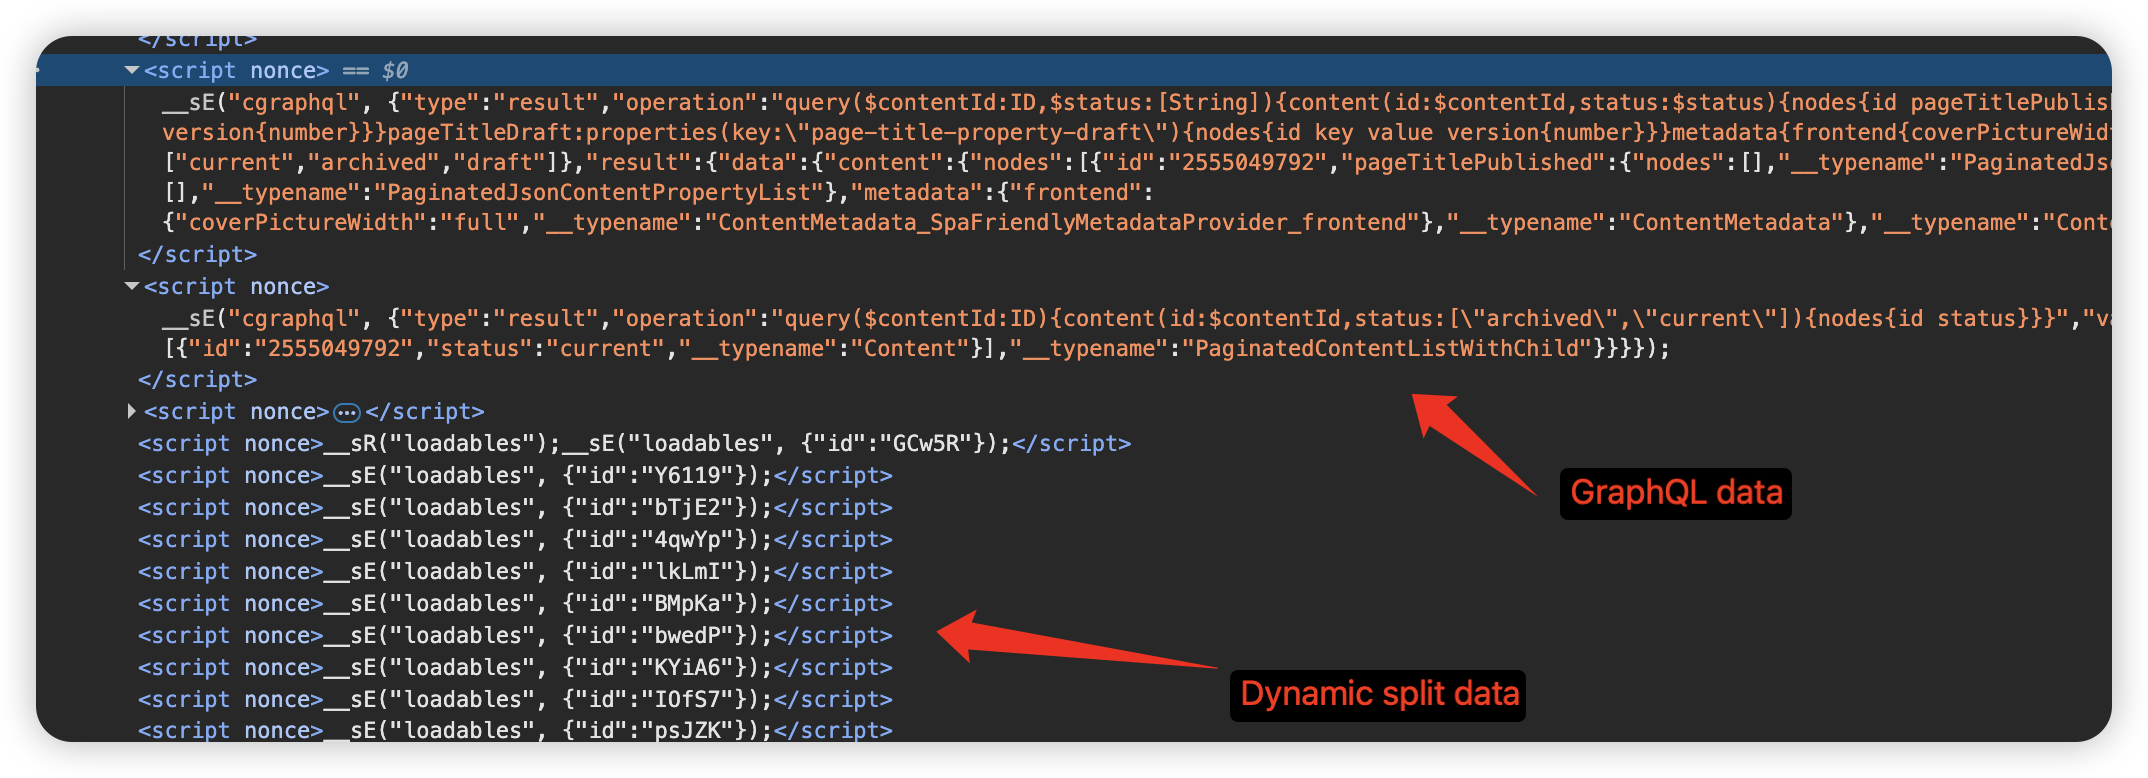
Furthermore, as we render the page on the server-side, we continuously send metadata embedded in the HTML stream to the browser building upon our streaming data abstractions. This allows us to initialize the data and download the required JavaScript assets much earlier without waiting for the whole page to finish rendering on the server-side.

Challenges
Implementing and releasing a fundamental change like streaming incrementally was not without its set of challenges. A lot of the existing app was built around the existing lifecycle of the page – in which the full page was rendered, all data extracted and then sent to the client to execute in one large chunk.
Data Loading
To support streaming we needed to rework how data fetching occurred within the client, how information about the rendered page was captured and how we rendered the page in the frontend. Many of the issues we encountered were difficult to diagnose as they were often timing related – and would manifest as cryptic hydration errors.
To mitigate these challenges we introduced a new data preloading implementation that allowed us to split up preloading into granular chunks that approximately mirror the component tree. These were then coupled a suspense boundary which would allow parts of the page to wait for their dependencies to be loaded.
Performance Overheads
When Confluence renders a page today, we have several transformations we run over the output. These transformations are responsible for things like marking the start and end of the page content, denoting which scripts need to be preloaded and marking parts of the page for metrics purposes.
Previously we were able to rely upon fairly simple transformations to make this possible – in particular making use of regex run over the page body. With the move to streaming we needed to not only be able to execute this over a subset of the page – but we also needed to be able to execute many of the transforms repeatedly. This introduced significant performance overheads – which were particularly problematic on larger pages.
To address this we had to do the following:
- Switch over our streams to run in “object mode” – in NodeJS streams normally use buffers under the hood. To be able to run these through regexes we needed to operate on strings – which meant we needed to repeatedly transform between strings and buffers. This was quite slow in our SSR environment. Swapping over to object mode meant we were able to consistently operate on strings instead.
- Modify our existing algorithms to operate on a smaller subset of the data where possible – for example tweaking our page start / end content detection to emit data as soon as we were certain that it didn’t match a tag we were searching for. This allowed us to keep the size of the content we searched over to be substantially lower.
Suspense Boundaries and Hydration
When React code is rendered in an SSR environment hooks like useEffect are not triggered – instead components are rendered a single time, turned into markup and emitted to the client. Suspense boundaries allow an app to signal to React that part of the app is not yet ready. When hydrating, we need to ensure that the data on the server is consistent with the data on the frontend.
When getting close to release, the team observed that the page was taking significantly longer to become interactive on our metrics. Diving into the issue, the root cause appeared to be that script execution on the frontend was significantly more expensive during streaming.
After significant investigation we found an interesting behavior in React 18 – in particular, if a change to context occurs during hydration then the component and all children are discarded and re-rendered. When rendering across a ready suspense boundary – React ends up rendering and discarding the result multiple times – 1 additional time per suspense boundary.


This was further exacerbated by one of our state management libraries, which did not correctly clean up listeners when discarded by React, leading to an explosion of event listeners and permanently higher CPU usage.
This issue was confirmed to be fixed in React 19. As a short-term mitigation, we were able to use the unstable_scheduleHydration feature to manually schedule the hydration of suspense boundaries at a higher priority level. This prevented context changes from triggering additional render cycles. We caught and fixed this inefficiency before the final rollout, showing the importance to not only rely on the topline metrics, but also using secondary guardrail metrics to detect unexpected behaviors.
Buffering
In order for a rendered page in Confluence to be loaded in the client, it needs to pass through several different intermediate services. Many servers buffer content received from the upstream service, in order to ensure that the data sent to the client is as efficient as possible – particularly if using compression.
For a typical SSR page this is not a problem as the page should arrive in the browser at a similar time irrespective of if the intermediate servers buffer the contents. With streaming however, this can be an issue – as buffering often holds data until some size threshold is reached, which can result in some chunks being merged with the next delayed chunk.


We addressed this by tweaking adding the X-Accel-Buffering header with a value of no to the service response – which prevented one of the intermediate nginx proxies from buffering chunks when streaming. We also modified the streaming logic to detect when react had finished rendering a chunk – and to trigger flushing the compression middleware on the next server tick.
Deliver Performance Optimization with Confidence
When releasing a performance improvement to customers, we want to ensure that we are able to measure the impact of the change. Not all performance improvements actually result in a measurable improvement for customers.
To measure the impact of a performance improvement we track a large number of metrics within the customer’s browser – to capture a snapshot of how changes behave across a broad range of environments. We then track the performance of the app at specific percentiles (typically p50, p90 and p99) as it releases. To ensure that any improvements are a result of a specific change, we run experiments (A/B tests) to statistically prove that any change is leading to improvements before shipping it.
The complexity of a change influences the rollout strategy – with riskier changes requiring a more conservative rollout speed. For rolling out the streaming changes we used a very conservative rollout over several weeks – and tracked a broad range of metrics including FCP, TTVC, TTI and hydration success rates. Once we were happy with the improvement we rolled the changes out to all customers.
Summary
In this post, we outlined how streaming SSR and hydration helped us improve first paint, reduce time to visually complete, and bring pages to an interactive state sooner. Looking ahead, we’ll continue to build on the foundations outlined in this post to further improve page interactivity and load performance, making Confluence fast and snappy.