

Incident management for high-velocity teams
How to choose incident management KPIs and metrics
Tracking and improving incident management over time
In today’s always-on world, tech incidents come with significant consequences.
System downtime costs companies an average of $300,000 per hour in lost revenue, employee productivity, and maintenance charges. Major outages can far outstrip those costs (just ask Delta Airlines, who lost approximately $150 million after an IT outage in 2017). And customers who can’t pay their bills, video conference into an important meeting, or buy a plane ticket are quick to move their business to a competitor.
With so much at stake, it’s more important than ever for teams to track incident management KPIs and use their findings to detect, diagnose, fix, and—ultimately—prevent incidents.
The good news is that with web and software incidents (unlike mechanical and offline systems), teams usually are able to capture a lot more data to help them understand and improve.
The bad news? Sometimes too much data can obscure issues instead of illuminating them.
The value of incident KPIs, metrics, and analytics
KPIs (Key Performance Indicators) are metrics that help businesses determine whether they’re meeting specific goals. For incident management, these metrics could be number of incidents, average time to resolve, or average time between incidents.
Tracking KPIs for incident management can help identify and diagnose problems with processes and systems, set benchmarks and realistic goals for the team to work toward, and provide a jumping off point for larger questions.
For example, let’s say the business’ goal is to resolve all incidents within 30 minutes, but your team is currently averaging 45 minutes. Without specific metrics, it’s hard to know what’s going wrong. Is your alert system taking too long? Is your process broken? Do your diagnostic tools need to be updated? Is it a team problem or a tech problem?
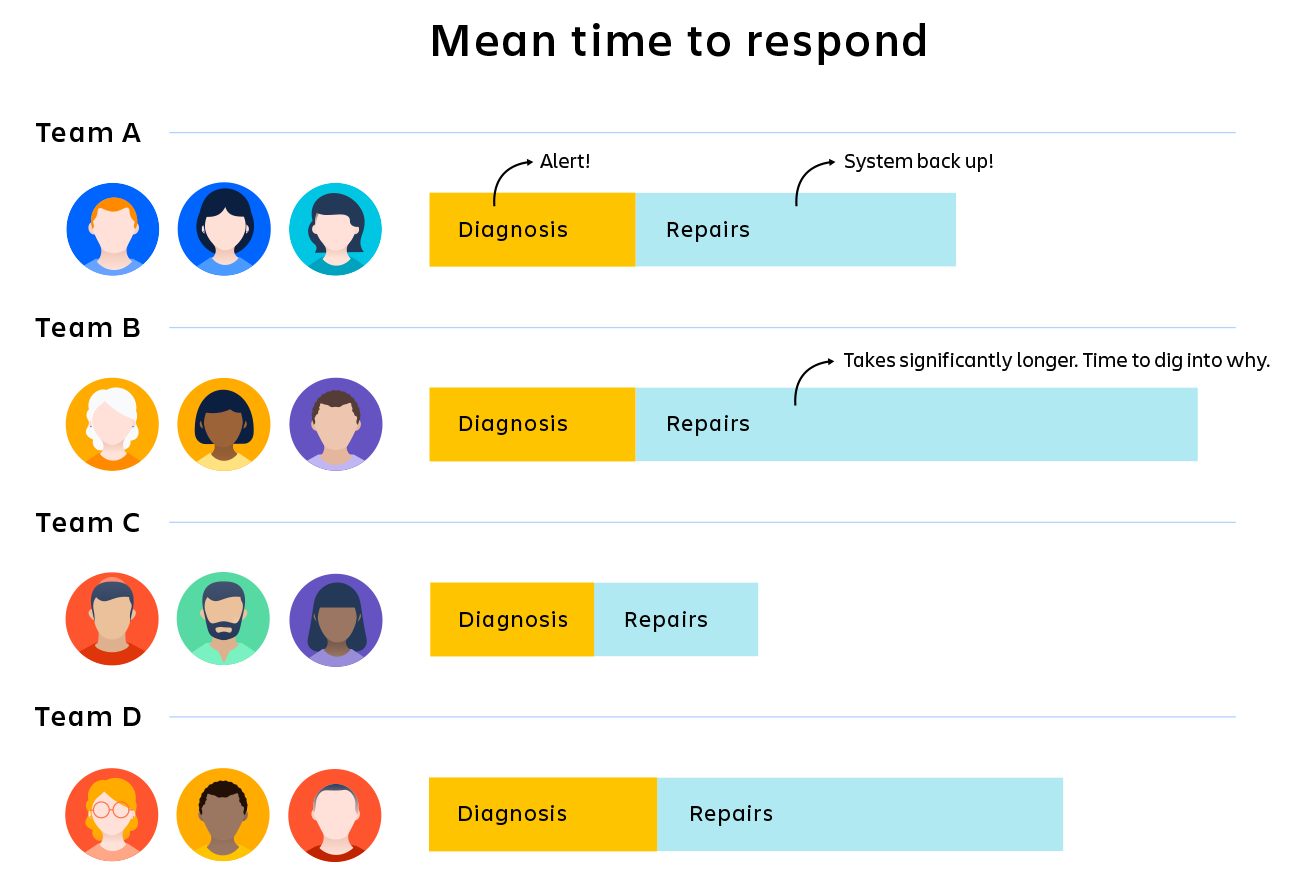
Now, add some metrics: If you know exactly how long the alert system is taking, you can identify it as a problem or rule it out. If you see that diagnostics are taking up more than 50% of the time, you can focus your troubleshooting there. If you see that Team B is taking 25% more time than Teams A, C, and D, you can start to dig into why.
KPIs won’t automatically fix your problems, but they will help you understand where the problem lies and focus your energy on digging deeper in the right places.
Popular incident KPIs and metrics
Alerts created
If you’re using an alerting tool, it’s helpful to know how many alerts are generated in a given time period. Using a solution like Jira Service Management, you can both send alerts and spin up reports and dashboards to track them.
Watch for periods with significant, uncharacteristic increases or decreases or upward-trending numbers, and when you see them, dig deeper into why those changes are happening and how your teams are addressing them.
Incidents over time
Tracking incidents over time means looking at the average number of incidents over time. This can mean weekly, monthly, quarterly, yearly, or even daily.
Are incidents happening more or less frequently over time? Is the number of incidents acceptable or could it be lower? Once you identify a problem with the number of incidents, you can start to ask questions about why that number is trending upward or staying high and what the team can do to resolve the issue.
MTBF
MTBF (mean time between failures) is the average time between repairable failures of a tech product. It can help you track availability and reliability across products.
As with other metrics, it’s a good jumping off point for larger questions. If your MTBF is lower than you want it to be, it’s time to ask why the systems are failing so often and how you can reduce or prevent future failures.
MTTA
MTTA (mean time to acknowledge) is the average time it takes between a system alert and when a team member acknowledges the incident and begins working to resolve it. The value here is in understanding how responsive your team is to issues.
Once you know there’s a responsiveness problem, you can again start to dig deeper. Why is your MTTA high? Are teams overburdened? Distracted? Is it unclear whose responsibility an alert is? MTTA can help you identify a problem, and questions like these can help you get to the heart of it.
MTTD
MTTD (mean time to detect) is the average time it takes your team to discover an issue. This term is often used in cybersecurity when teams are focused on detecting attacks and breaches.
If this metric changes drastically or isn’t quite hitting the mark, it’s, yet again, time to ask why.
MTTR
MTTR can stand for mean time to repair, resolve, respond, or recovery. Arguably, the most useful of these metrics is mean time to resolve, which tracks not only the time spent diagnosing and fixing an immediate problem, but also the time spent ensuring the issue doesn’t happen again. Recovery is a primary DevOps metric that DevOps Research and Assessment (DORA) notes is key to measure the stability of a DevOps team.
Again, this metric is best when used diagnostically. Are your resolution times as quick and efficient as you want them to be? If not, it’s time to ask deeper questions about how and why said resolution time is missing the mark.
Recovery is a key DevOps metric that measures the stability of a DevOps team, as noted by DevOps Research and Assessment (DORA). It’s the total time it takes to detect, mitigate, and resolve a problem.
On-call time
If you have an on-call rotation, it can be helpful to track how much time employees and contractors spend on call. This metric can help you make sure no one employee or team is overburdened.
Using Jira Service Management, you can generate comprehensive reports to see these figures at a glance.
SLA
An SLA (service level agreement) is an agreement between provider and client about measurable metrics like uptime, responsiveness, and responsibilities.
The promises made in SLAs (about uptime, mean time to recovery, etc.) are one of the reasons incident management teams need to track these metrics. If and when things like average response time or mean time between failures change, contracts need to be updated and/or fixes need to happen—and quick.
SLO
An SLO (service level objective) is an agreement within an SLA about a specific metric like uptime. As with the SLA itself, SLOs are important metrics to track to make sure the company is upholding its end of the bargain when it comes to customer service.
Timestamps (or timeline)
A timestamp is encoded information about what happened at specific times during, before, or after the incident. This information isn’t typically thought of as a metric, but it’s important data to have when assessing your incident management health and coming up with strategies to improve.
Timestamps help teams build out timelines of the incident, along with the lead up and response efforts. A clear, shared timeline is one of the most helpful artifacts during an incident postmortem.
Uptime
Uptime is the amount of time (represented as a percentage) that your systems are available and functional.
The increasing connectivity of online services and increasing complexity of the systems themselves means there’s typically no such thing as 100% guaranteed uptime. The goal for most products is high availability—having a system or product that’s operational without interruption for long periods of time. Industry standard says 99.9% uptime is very good and 99.99% is excellent.
Tracking your success against this metric is all about making and keeping customer promises. And, as with other metrics, it’s just a starting point. If your uptime isn’t at 99.99%, the question of why will require more research, conversations with your team, and investigation into process, structure, access, or technology.
A word of caution about incident analytics
The downside to KPIs is that it’s easy to become too reliant on shallow data. Knowing that your team isn’t resolving incidents fast enough won’t in and of itself get you to a fix. Because you still need to know how and why the team is or isn’t resolving issues. And you still need to know if the issues you’re comparing are actually comparable.
KPIs can’t tell you how your teams approach tricky issues. They can’t explain why your time between incidents has been getting shorter instead of longer. They can’t tell why Incident A took three times as long as Incident B.
For that, you need insights. And while the data can be a starting point on the way to those insights, it can also be a stumbling block. It can make us feel like we’re doing enough even if our metrics aren’t improving. It can lump together incidents that are actually dramatically different and should be approached differently. It can discount the experience of your teams and the underlying complication of incidents themselves.
“Incidents are much more unique than conventional wisdom would have you believe. Two incidents of the same length can have dramatically different levels of surprise and uncertainty in how people came to understand what was happening. They can also contain wildly different risks with respect to taking actions that are meant to mitigate or improve the situation. Incidents are not widgets being manufactured, where limited variation in physical dimensions is seen as key markers of quality.”
- John Allspaw, Moving Past Shallow Incident Data
The point here isn’t that KPIs are bad. We don’t think you should throw the baby out with the bathwater. The point is that KPIs aren’t enough. They’re a starting point. They’re a diagnostic tool. They’re the first step down a more complex path to true improvement.
Jira Service Management offers reporting features so your team can track KPIs and monitor and optimize your incident management practice.
Setting up an on-call schedule with Opsgenie
In this tutorial, you’ll learn how to set up an on-call schedule, apply override rules, configure on-call notifications, and more, all within Opsgenie.
Read this tutorialIncident communication templates and examples
When responding to an incident, communication templates are invaluable. Get the templates our teams use, plus more examples for common incidents.
Read this article