

After a year of our users leveraging Rovo’s AI capabilities within Jira, we analysed usage data to identify if and how users’ productivity had been impacted. We found that users who adopted Rovo’s AI capabilities within Jira started work 30% faster and ultimately get an extra day of productivity each month — time that can be leveraged for running retrospectives, team health checks and more. In this post, we detail the analytical steps we followed to reach this finding!
What is Rovo in Jira?
Rovo is Atlassian’s AI app used by over 5 million users. Rovo works across the Atlassian suite of products and has exciting capabilities for Jira. Check out the following demo videos to learn more.
Defining “productivity” in Jira (and why it’s hard!)
Jira is used to track the full life-cycle of work items from planning to maintenance and everything in-between. There’s a plethora of metrics that measure the time taken to progress between these phases such as the time between creating a Jira work item and closing a Jira work item, between requesting feedback from peers and actioning that feedback and so on. We found that by selecting a transition between two specific phases in a work-item’s lifecycle, we avoided a lot of potential noise. This is why we chose to measure productivity as:
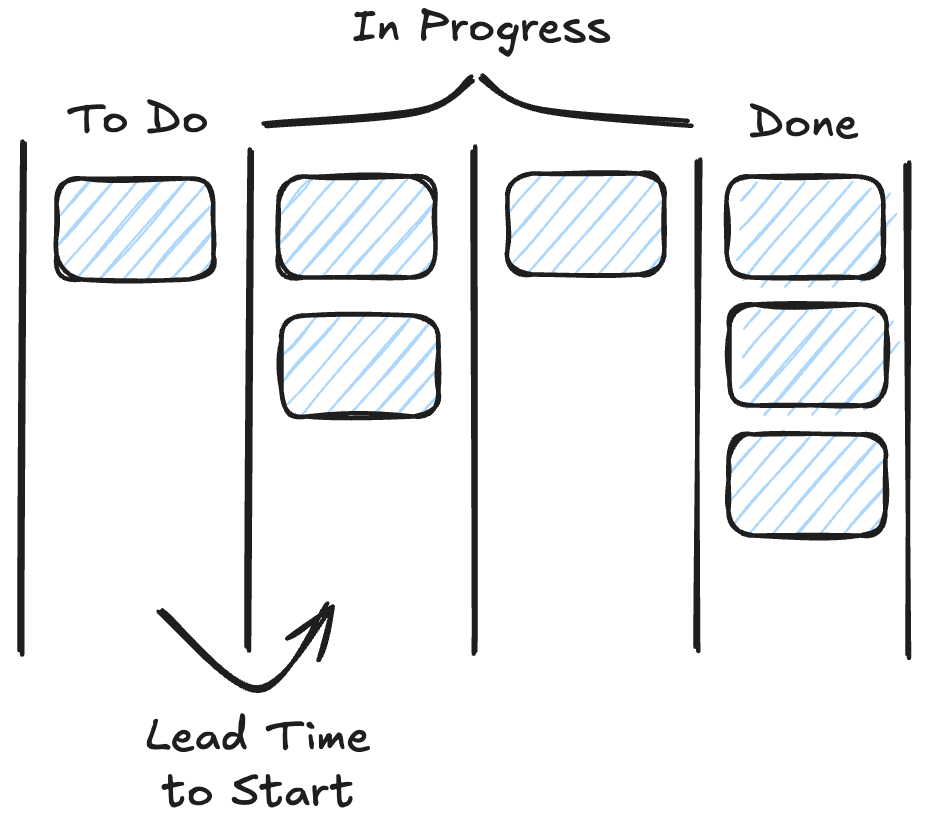
- Lead Time to Start — The time taken between a Jira work item’s creation and when it moves into “In Progress”.
Our hypothesis was that the suite of AI functionality provided by Rovo in Jira was significantly improving this metric for our customers. We also repeated the analysis using a secondary metric:
- Number of work items moved into In Progress — The number of work items moved into “In Progress” for the first time.
To define these two metrics in detail, it’s important to understand the difference between status and status category in Jira. A Jira board can have many different statuses which are represented as columns in the board view. Each of these statuses is mapped to one of three categories: “To Do”, “In Progress” and “Done”. For the above two metrics, we are measuring this based on the Jira work items which move from the status category “To Do” into “In Progress” for the first time. It’s technically possible for a work item to move back from “In Progress” into “To Do”. This is why we choose to measure only the first time it moves from “To Do” into “In Progress”.
Designing the study
We used a quasi-experiment approach to compare two cohorts, control and test.
- Control: Jira users who never used Rovo AI features within Jira.
- Test: Jira users who became regular Rovo Jira AI users and stayed that way over 45 days.
Quasi-experiments differ from traditional statistical experiments in a major way: there isn’t randomised assignment to test and control cohorts. In the latter, the randomness results in a fair sample. However, for quasi-experiments it’s necessary to control for several variables to make the sampling fair. For this reason, we used the following filters for both the control and test cohorts:
- Only Jira work items that were created by users who had at least 180 days of tenure within Jira were included.
- Only included users who were on a paid premium or enterprise Jira license.
- To avoid outliers in seat size, we only included licenses with between 50 and 1,000 paid seats.
- We leveraged winsorization to avoid outliers, a simple technique where we exclude the bottom and top 10th percentile of Lead Time to Start values. This can be commonly required at Atlassian since we often find that outliers can be very extreme where people are using Jira in creative ways!
We then defined a normalised timeline. “Day 0” was used to refer to the day that the user became a Rovo Jira AI user whereas “Day 45” was 45 days later. You may be wondering: how did we determine what Day 0 was for the control group since these customers never used Rovo Jira AI! To fairly compare these two cohorts, it was necessary to assign a Day 0 to users in the control group. Since there was an equal number of samples in the control and the test group, we simply took all the “Day 0” dates from the test group, shuffled them, then assigned them to the control group users. This ensured that the days compared were randomly distributed from the exact same distribution. Since users in the control cohort never became Rovo Jira AI users we randomly shuffled the dates from users in the test cohort and assigned them to the users in the control cohort.

The final part of our methodology involved comparing the relative change from Day 0 to Day 45 between the two cohorts. We compared these two cohorts using a two-sided t-test with significance 0.05 and power of 0.8.
Findings
30% more work reached “In Progress”
We discovered statistically significant (p<0.01) evidence indicating that users who adopted Rovo AI in Jira experienced an average improvement of 30% in the number of work items they moved to “In Progress” after 45 days. In contrast, those who did not utilise Rovo Jira AI at all didn’t experience a difference.
Users started work 35% faster
We also found that users who adopted Rovo AI in Jira for 45 days experienced a statistically significant difference in the relative change in Lead Time to Start compared to those who didn’t adopt Rovo AI in Jira at all. Whilst both groups experienced a reduction in Lead Time to Start, Rovo AI in Jira adopters experienced 1.4x times the reduction compared to those in the control group.
Put another way, users who adopted Rovo AI in Jira experienced a 35% reduction in Lead Time to Start. For the typical user, this represents a savings of roughly 1 day every 28 days.
What we’re doing next
This is just the first chapter in how we’re measuring the impact of Jira AI in the real world. Next, we’ll be digging into questions like: Are work items better written? Are boards easier to manage? Are sprints running more smoothly? By pairing careful experimentation with real customer usage, we want to move beyond hype and make sure every new AI capability delivers tangible value for teams.
If you’d like to follow along or try these features for yourself, read more about Rovo in Jira here.


