
Knowing where your team is investing time & effort is crucial to understanding whether you’re heading toward your goals or not. This challenge becomes bigger as organizations expand, as there’s a persistent need to provide a return on investment. In times like these, some common questions start to popup:
- Why can’t a larger team deliver on the roadmap? Where is the effort going?
- Are we investing enough in improving existing products/platforms or have we been too focused on building new things?
- Are we able to sustainably address a growing customer base?
- Are we taking the necessary time to address technical debt and improve our efficiency?
- How well does our planning line up with reality – especially for unknowns and incidents?
“You can’t improve what you don’t measure.”
Peter Drucker

While this may sound obvious, tracking this information without falling into a micromanagement trap can be tricky – leaders often feel pushed to constantly interrogate teams about ongoing work.
At Atlassian, our engineering teams were feeling this burden every time we held monthly and quarterly reviews. Comparing plans vs. actuals can be painful when it relies on individual teams reconciling numbers through custom spreadsheets – or even worse: the good old finger-in-the-air technique, powered by memory.
If you don’t know how wrong your previous planning was, chances are you’re likely to fall into the same pitfalls again.
The model: Engineering Work Taxonomy (EWT)
We needed a framework to bring structure to teams. After testing a number of formulas and building on learnings, our Engineering Work Taxonomy (EWT) model was designed.
EWT allow us to talk about a standard set of areas, share them with stakeholders, and prioritise investments in a way that serves our business goals.
Our problem statement:
Teams do not have an effective mechanism to communicate where they are spending their time and how that should evolve to meet growing expectations.
Two key areas contributed to this problem:
- Inadequate categorization and reporting mechanisms for what a team is working on
- Inadequate transparency for team health funding asks caused by a lack of shared understanding of what a healthy team should look like
EWT aims to effectively describe four categories:
- Change the Business (CtB) – Creating or improving customer-facing features
- Developer Productivity – Reducing development impediments and building high-leverage internal tools
- Run the Business (RtB) – Maintaining technical health of applications and running them at expected levels of security, reliability, and performance
- Team Management (TM) – Org Development (hiring, interviewing, onboarding, growth, performance reviews) and admin work
We then set rule-of-thumb targets across them, except for Team Management.
Summarizing – this is how engineering capacity is approached:
Engineering capacity = Total capacity – Team management allocation
The report: Buckets of Work (BoW)
Next up: how do we apply the EWT framework in real life to retroactively track the actual focus of our teams and consider our work categories?
Note:
This is definitely not an Atlassian-specific challenge.
After attending countless planning sessions throughout my career where the finger-in-the-air approach came up, I was interested in helping to solve this problem. By using data.
We needed a simple approach that every team could use without much heavy lifting. Something that didn’t scream micromanagement. Ideally, we needed an approach powered by the data and capabilities Atlassian products offer (and that we use internally).
The rules of engagement were:
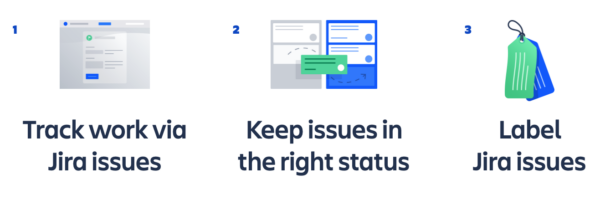
- Engineering teams at Atlassian use Jira to manage their work backlog and progress. We decided to use that as the source of truth for our EWT report.
- Focus on getting data for the steps of the workflow that represent work actively being done. That indirectly means teams needed to keep their Jira issues updated to reflect the status properly.
- Agree on specific labels in advance and tag Jira issues accordingly (ewt-ctb-feature, ewt-dp-empowered-teams, etc). Jira automation is vastly used to tag issues at scale (based on Epic → Child relationships).
TL;DR:
Once we had the rules of engagement set, we needed to plot the data in a simple and accessible way.
Atlassian Analytics had just been launched as a BETA when I was experimenting with solutions in this space. Atlassian Analytics has native access to all of our Jira data and adopting our own products to tackle this challenge was a no-brainer.
The idea
build an Atlassian Analytics dashboard on top of the time in status information each Jira issue provides.
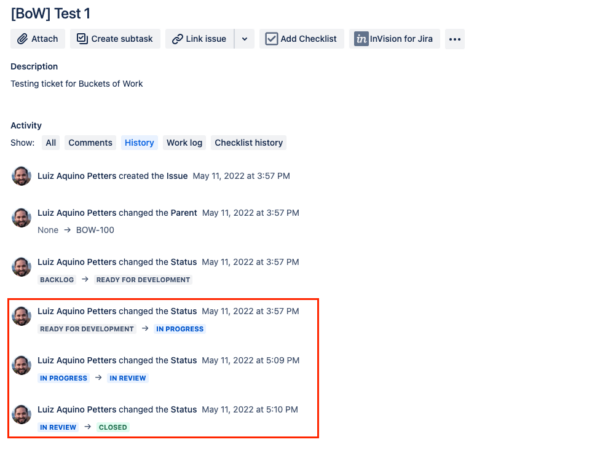
Boom! Once we followed this approach, we were able to easily track the information we needed.
No exporting the data to “XYZ” format. No micromanagement involved.
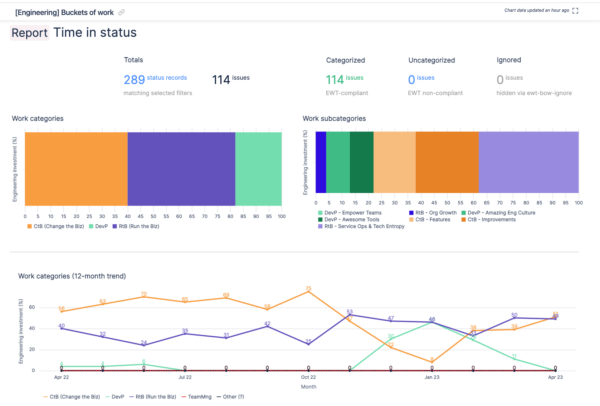
Here’s an example of how it looks (filters were adjusted to display results for a single team):
Before landing on this model, we experimented with other solutions that involved querying the Jira API, plotting the data in Google Sheets and even resorting to other visualization apps. Each of these options had some drawbacks:
- Manual steps prone to errors
- Performance issues
- Too hard to scale to dozens of teams.
Atlassian Analytics capabilities helped to alleviate all of these blockers
Now, teams using the BoW report don’t need to understand the details of how their data is being captured – and that’s a good sign.
Our teams are interested in getting insights from data that’s ready for analysis.
Best practices
It’s important to note the report is only as good as the quality of data we feed into it. For that reason, we have runbooks educating our teams on a few best practices:
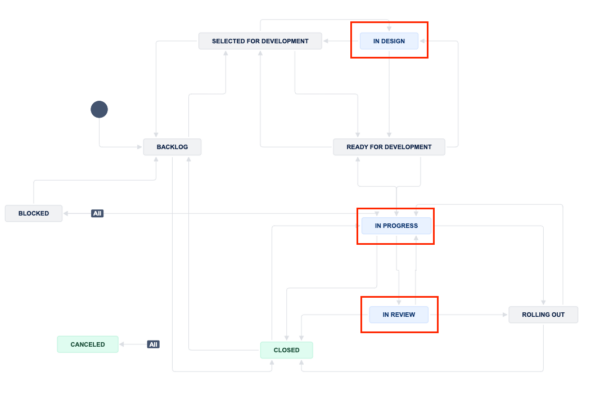
Process 1:
- Jira projects must have sane workflows, meaning the right statuses need to be correctly configured and marked as part of the IN PROGRESS status category – as these are the ones we’re interested in.
- This approach allows team autonomy, since each group can manage their own workflows. The only requirement is for teams to correctly use the IN PROGRESS status to communicate when they’re actively working on a task.
- See the sample below (items marked in blue):
Process 2:
- Individuals should focus on starting and finishing a single piece of work before starting new ones – as much as possible. Benefits of this approach include:
- Limited context switching – a common productivity killer.
- Feeding high-quality data to the BoW metrics, otherwise, the report will consider multiple pieces of work (represented as Jira issues) being actively pushed forward simultaneously.
Process 3:
- Reviewing the results should be a regular exercise (e.g. monthly) and considered a team effort. This helps to identify unbalanced investment across our core work categories and drive more realistic conversations during Roadmap sessions, for example.
Using the insights
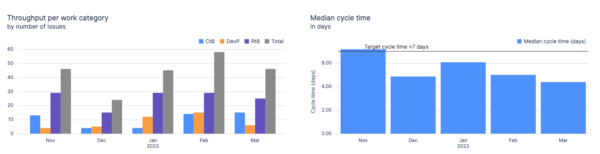
The BoW report also provides insights into the amount of completed work in a given time period. The theory is, as we unlock developer productivity gains across the company we should see two things happening simultaneously:
- the amount of completed work trending up
- the cycle time trend going down
See the example below: one of our teams focused on developer productivity initiatives in December & January – as a result, their cycle time is decreasing!
Other real-life stories:
- Using the same methodology, a different team was able to spot the amount of induced work they had in their backlog and the source of it. That allowed them to better organise the workload and request extra support from upper management – backed by real data.
- In our mobile apps space, the insights helped teams sharing the same codebase ensure they were evenly sharing the Run the Business load across different teams/orgs. It also informed the decisions about the distribution of component ownership during a recent re-organization.
Finding focus with Buckets of Work
The EWT + BoW approach was designed to solve a real problem at Atlassian: a need for more engineering focus and insights, at scale. We’ve started to roll this out across individual teams and the larger organization.
We currently have 200+ teams using this measuring system internally and making more data-driven decisions. Adoption has happened organically without any mandates from senior leadership.
It may also take a while for all teams to understand the benefits of doing this type of work tracking.
A useful analogy: think about it as managing your finances on a shared bank account.
Without a tracking system, it becomes impossible to know what’s going on as others are also operating on it.
If the account balance starts trending down, the first thing to do is to review where the money is going to stop the downward spiral.
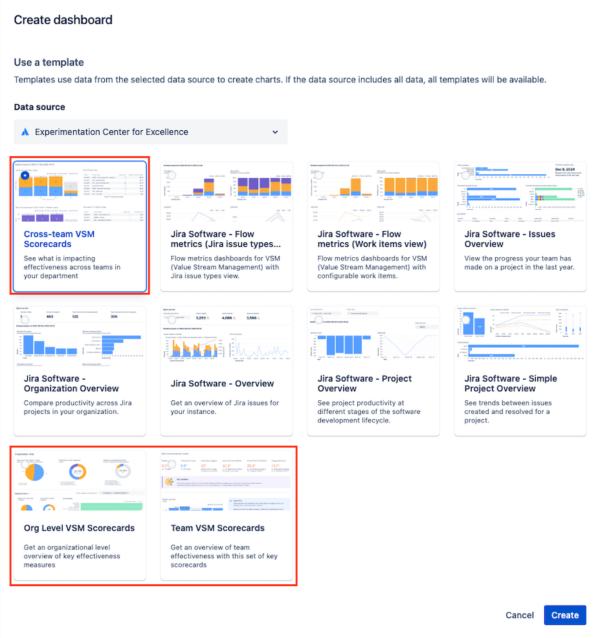
If you would like to try this approach with your team, the Atlassian Analytics team took the learnings from our internal Buckets of Work initiative and transformed them into awesome templates you can use.
They’re focused on Value Stream Management (VSM):
- Team Effectiveness Scorecards
- Cross-teams Effectiveness Scorecards
- Organisational Effectiveness Scorecards
Learn more about Atlassian Analytics:
Supercharge data-driven decisions with Atlassian Analytics today – Work Life by Atlassian