

Let’s be straight: no tool in the world will magically make you DevOps (or agile, or lean, or capable of continuous delivery…) DevOps champions collaboration and communication between development and operations teams, so it’s more of a cultural shift than a magic recipe.
However, there are tools and technologies that support automation and collaboration between teams. People often ask us about the tools we use to support DevOps practices at Atlassian (besides our own), so we put together a buyer’s guide that will point out things to look for when choosing among popular DevOps tools, as well as tell you which tools we use on our teams.
Let’s be straight: no tool will magically make your team DevOps.
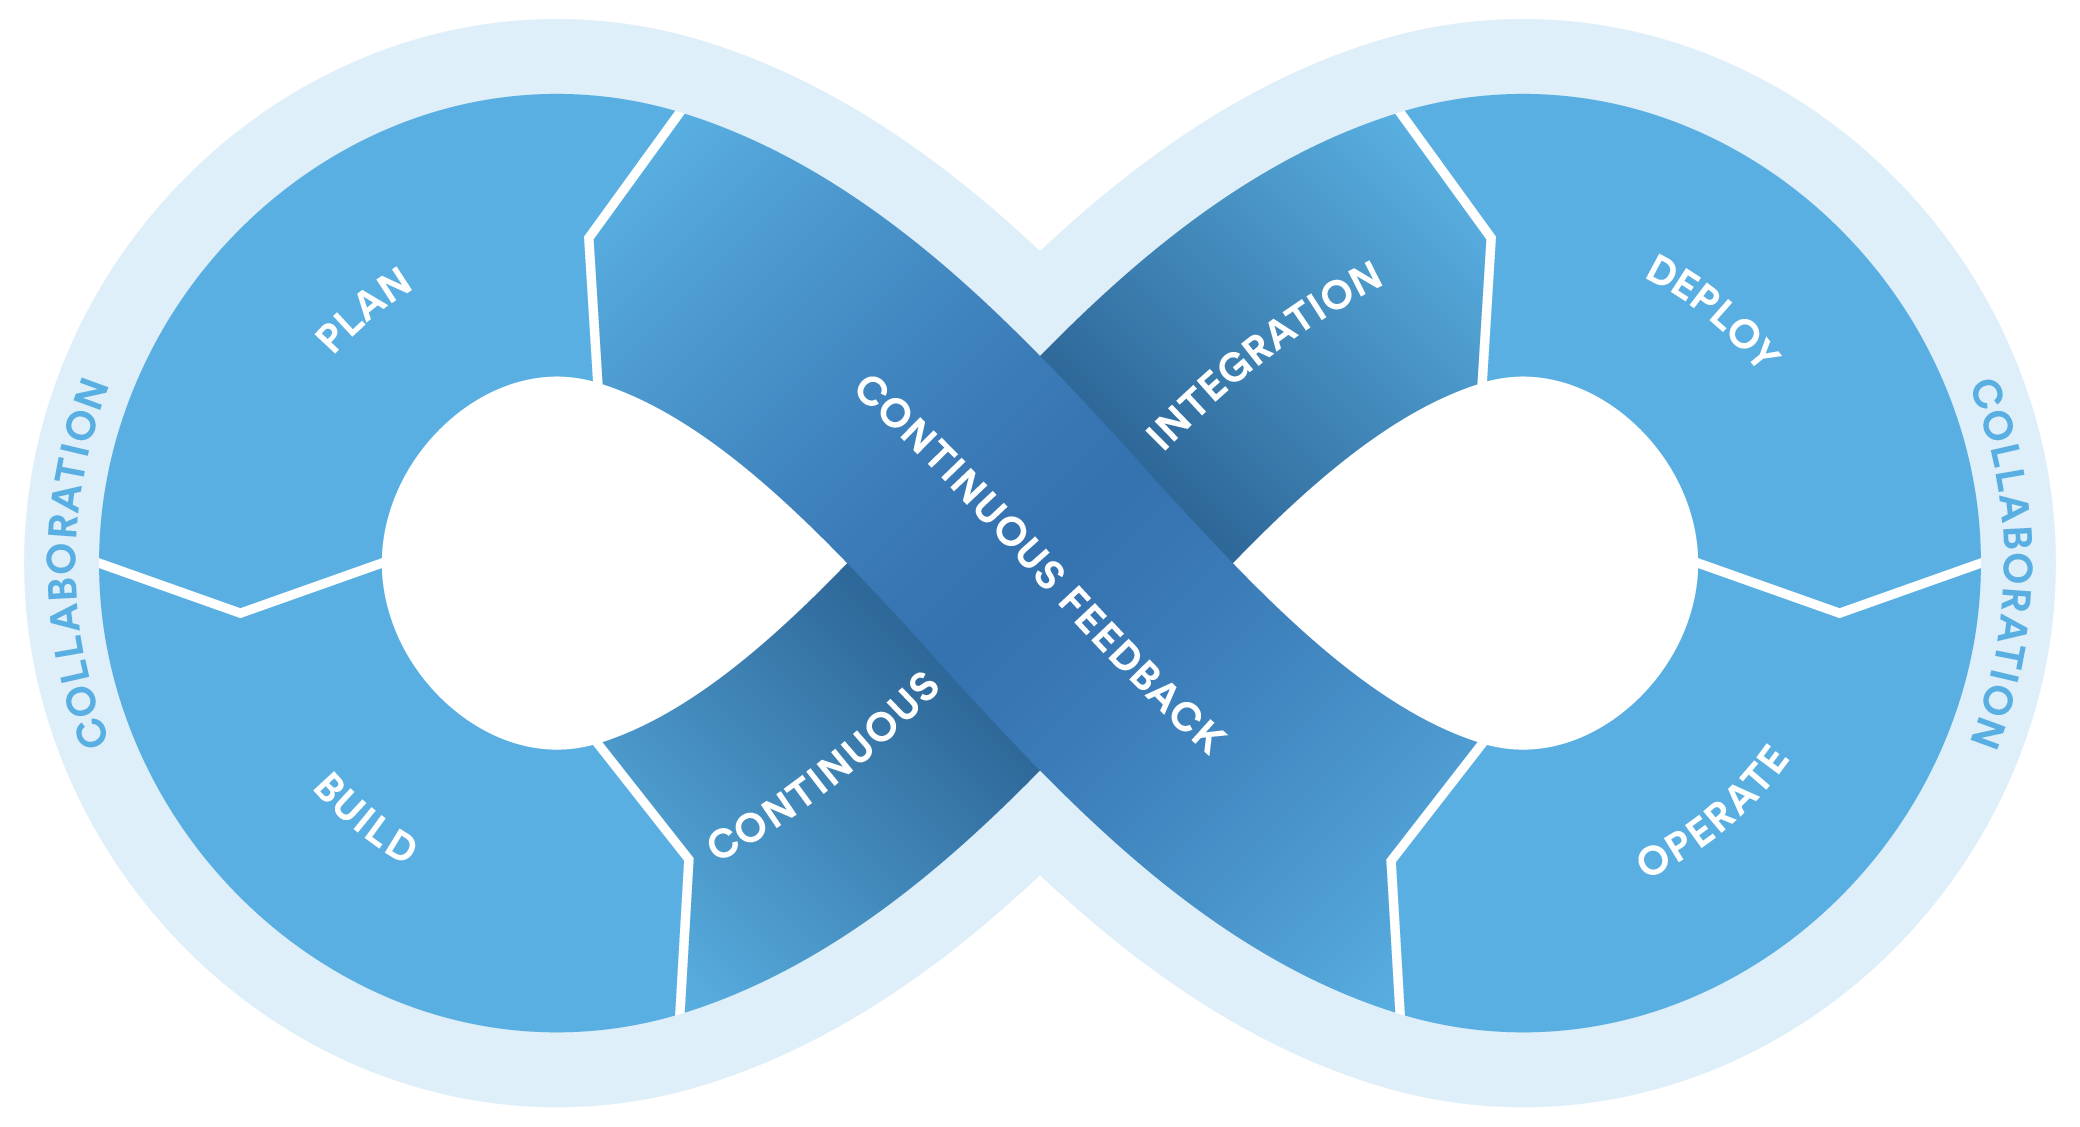
Although many tools touch all phases of the development cycle in one way or another, no single tool we know of plays the primary role in each phase. So when thinking about DevOps tools, breaking it down by phase is helpful. Here are our preferred tools for each phase of the development cycle.
1. Planning: Confluence, Hipchat, Jira Software
Collaborate on vision and design
Taking a page out of the agile handbook, we recommend tools that allow your development team to plan in iterations. This way, you start learning from users sooner and can optimize your product from that feedback. Look for tools that provide sprint planning features.
Another great practice is continuously gathering user feedback, organizing it into actionable inputs, and prioritizing those actions for your development teams. Look for tools that encourage “asynchronous brainstorming” (if you will). It’s important that everyone can share and comment on anything: ideas, strategies, goals, requirements, roadmaps and documentation.
And don’t forget about integrations. Wherever you decide to scope your feature or project should be converted into user stories in your development backlog.
For more on this phase, check out this post from Atlassian product managers about backlog grooming and prioritization.
2. Building
Staging environments for development: Docker
While Puppet and Chef primarily benefit Operations, developers use tools like Docker, an open source tool, to provision individual development environments. Coding against virtual, disposable replicas of production helps you get more work done.
Something weird about the class path? Maven installation suddenly borked? Infrastructure as code means re-provisioning is faster than repairing – and more reliable, too. It also means you can spin up variations of your development environment.
When every team member works from identically-provisioned environments, “Works on my machine!” stops being funny because it’s true (now it’s just funny).
Infrastructure as code: Bamboo, Bitbucket, Chef, Docker, Puppet
Developers create modular applications because they’re more reliable and maintainable. So why not extend that thinking to IT infrastructure?
This can be difficult to apply to systems because they are always changing. So we get around that by using code for provisioning. Provisioning code can be applied to bare metal, and re-applied to bring a server back to baseline.
It can be stored in version control. It can be tested. Incorporated into CI (continuous integration). Peer-reviewed. You name it.
When institutional knowledge is, well, codified in code, the need for run books and internal documentation fades. What emerges are repeatable processes, and reliable systems. Less talk, more rock.
Collaborative coding
Rather than waiting on change approval boards before deploying to production, you can improve code quality and throughput with peer reviews done via pull requests.
What are pull requests, you ask? Pull requests tell your team about changes you’ve pushed to a development branch in your repository. Your team can then review the proposed changes and discuss modifications before integrating them into the main code line.
For more on collaborative coding (and why one developer changed his mind about code reviews) check out “Hello World! A new grad’s guide to coding as a team” – even seasoned coders might learn a thing or two.
3. Continuous Integration
Continuous Integration: Bamboo, Hipchat
Continuous integration is the practice of checking in code to a shared repository several times a day, and testing it each time. That way, you detect problems early, fix them when they’re easiest to fix, and get shiny new features to your users as early as possible.
Because branch-and-merge workflows are all the rage (and deservedly so!), tools that take the pain out of running CI in a multi-branch environment are the key to maintaining testing rigor without sacrificing dev speed.
Look for tools that automatically apply your tests to development branches, and give you the option to push to master when branch builds are successful. Along with that, you can get real-time alerts in your team’s chat tool with a simple integration.
For a deeper dive, check out winning at CI with feature branches and Bamboo.
Automated Testing: Bamboo, Bitbucket, Capture for Jira
Automated testing pays off over time by speeding up your development and testing cycles in the long run. And in a DevOps environment, it’s important for another reason: awareness.
To prepare for and support what Development builds, it’s important for Operations to have visibility into what is being tested, and how thoroughly. Unlike manual tests, automated tests are executed faithfully and with the same rigor every time. They also yield reports and trend graphs that help identify risky areas.
Risk is a fact of life in software development, but you can’t mitigate what you can’t anticipate. Do your operations team a favor and let them peek under the hood with you. Look for tools that support wallboards, and let everyone involved in the project comment on specific build or deployment results. Extra points for tools that make it easy to get Operations involved in blitz testing and exploratory testing.
4. Deployment
Release dashboards: Jira Software
One of the most stressful parts of shipping software is getting all the change, test, and deployment information for an upcoming release into one place. The last thing anyone needs before a release is a long meeting to report on status. This is where release dashboards come in.
Look for tools with a single dashboard integrated with your code repository and deployment tools. Find something that gives you full visibility on branches, builds, pull requests, and deployment warnings in one place.
Automated deployment: AWS, Bamboo, Hipchat, Puppet
There’s no magic recipe for deploy automation that will work for every application and IT environment. But converting Operations’ runbook into a cmd-executable script using Ruby or bash is a common way to start. Good engineering practices are vital. Use variables to factor out host names – maintaining unique scripts or code for each environment is no fun (and misses half the point anyway). Create utility methods or scripts to avoid duplicated code. And peer review your scripts to sanity-check them.
Try automating deploys to your lowest-level environment first, where you’ll be using that automation most frequently, then replicate that all the way up to production. If nothing else, this exercise highlights the differences between your environments and generates a list of tasks for standardizing them. As a bonus, standardizing deploys through automation reduces “server drift” within and between environments.
Provisioning tools like Puppet and Chef reduce the pain in standardizing environments. And there are loads of tools to help with deploy automation. Atlassian’s own Bamboo orchestrates complex deployments step by step and provides visibility into each environment’s history.
Using Puppet or Chef with Hipchat allows you to control deployments from chat rooms. With a little Googling, you’re sure to find a good fit for your application and budget
5. Operations
Application and server performance monitoring: BigPanda, Hipchat, HostedGraphite, Nagios, New Relic, Pager Duty, Pingdom, Splunk
There are two types of monitoring that should be automated: server monitoring and application performance monitoring.
Manually “topping” a box or hitting your API with a test is fine for spot-checking. But to understand trends and the overall health of your application (and environments), you need software that is listening and recording data 24/7.
And you guessed it: there’s an app for that. Lots of them, actually. New Relic, Splunk and Nagios are among the most popular, and handle both types of monitoring. Look for tools that integrate with your group chat client so alerts go straight to your team’s room, or a dedicated room for incidents.
Communication and swarming: BigPanda, DataDog, Hipchat, New Relic, Pager Duty, Statuspage
Cross-team communication is the first step towards a cultural shift, and chat tools facilitate it in real-time. Many chat tools have dedicated rooms, where experts can hop in to swarm on incidents as they happen and get them fixed faster.
It’s also important to stay alert so can maximize up-time. Look for a chat tool that is extensible and integrates with monitoring tools so you never miss an important service degradation alert.
The best-loved companies extend communication outside their own four walls. Look for tools that help you notify users when $#!τ hits the fan and keep them up to date on the resolution of an incident.
Read more about how Atlassian deals with incidents.
Incident, change and problem tracking: Jira Service Desk, Jira Software
The keys to unlocking collaboration between DevOps teams is making sure they’re viewing the same work. What happens when incidents are reported? Are they linked and traceable to software problems? When changes are made, are they linked to releases?
Nothing blocks Dev’s collaboration with Ops more than having incidents and software development projects tracked in different systems. Look for tools that keep incidents, changes, problems, and software projects on one platform so you can identify and fix problems faster.
6. Continuous Feedback: GetFeedback, Hipchat, Jira Service Desk, Pendo, SurveyMonkey, Hootsuite
Customers are already telling you whether you’ve built the right thing – you just have to listen. This includes NPS data, churn surveys, bug reports, support tickets, and even tweets. In a DevOps culture, everyone on the product team has access to user comments because they help guide everything from release planning to exploratory testing sessions.
Look for applications that integrate your chat tool with your favorite survey platform for NPS-style feedback. Twitter and/or Facebook can also be integrated with chat for real-time feedback. For deeper looks at the feedback coming in from social media, it’s worth investing in a social media management platform that can pull reports using historical data.
Analyzing and incorporating feedback may feel like it slows the pace of development in the short term, but it’s more efficient in the long run than releasing new features that nobody wants.
Perfecting your DevOps tools collection
Atlassian makes tools that support cross-team collaboration in each phase of the development lifecycle. And as you’ve seen, we augment our DevOps tool stack with add-ons and stand-alone tools built by our peers.
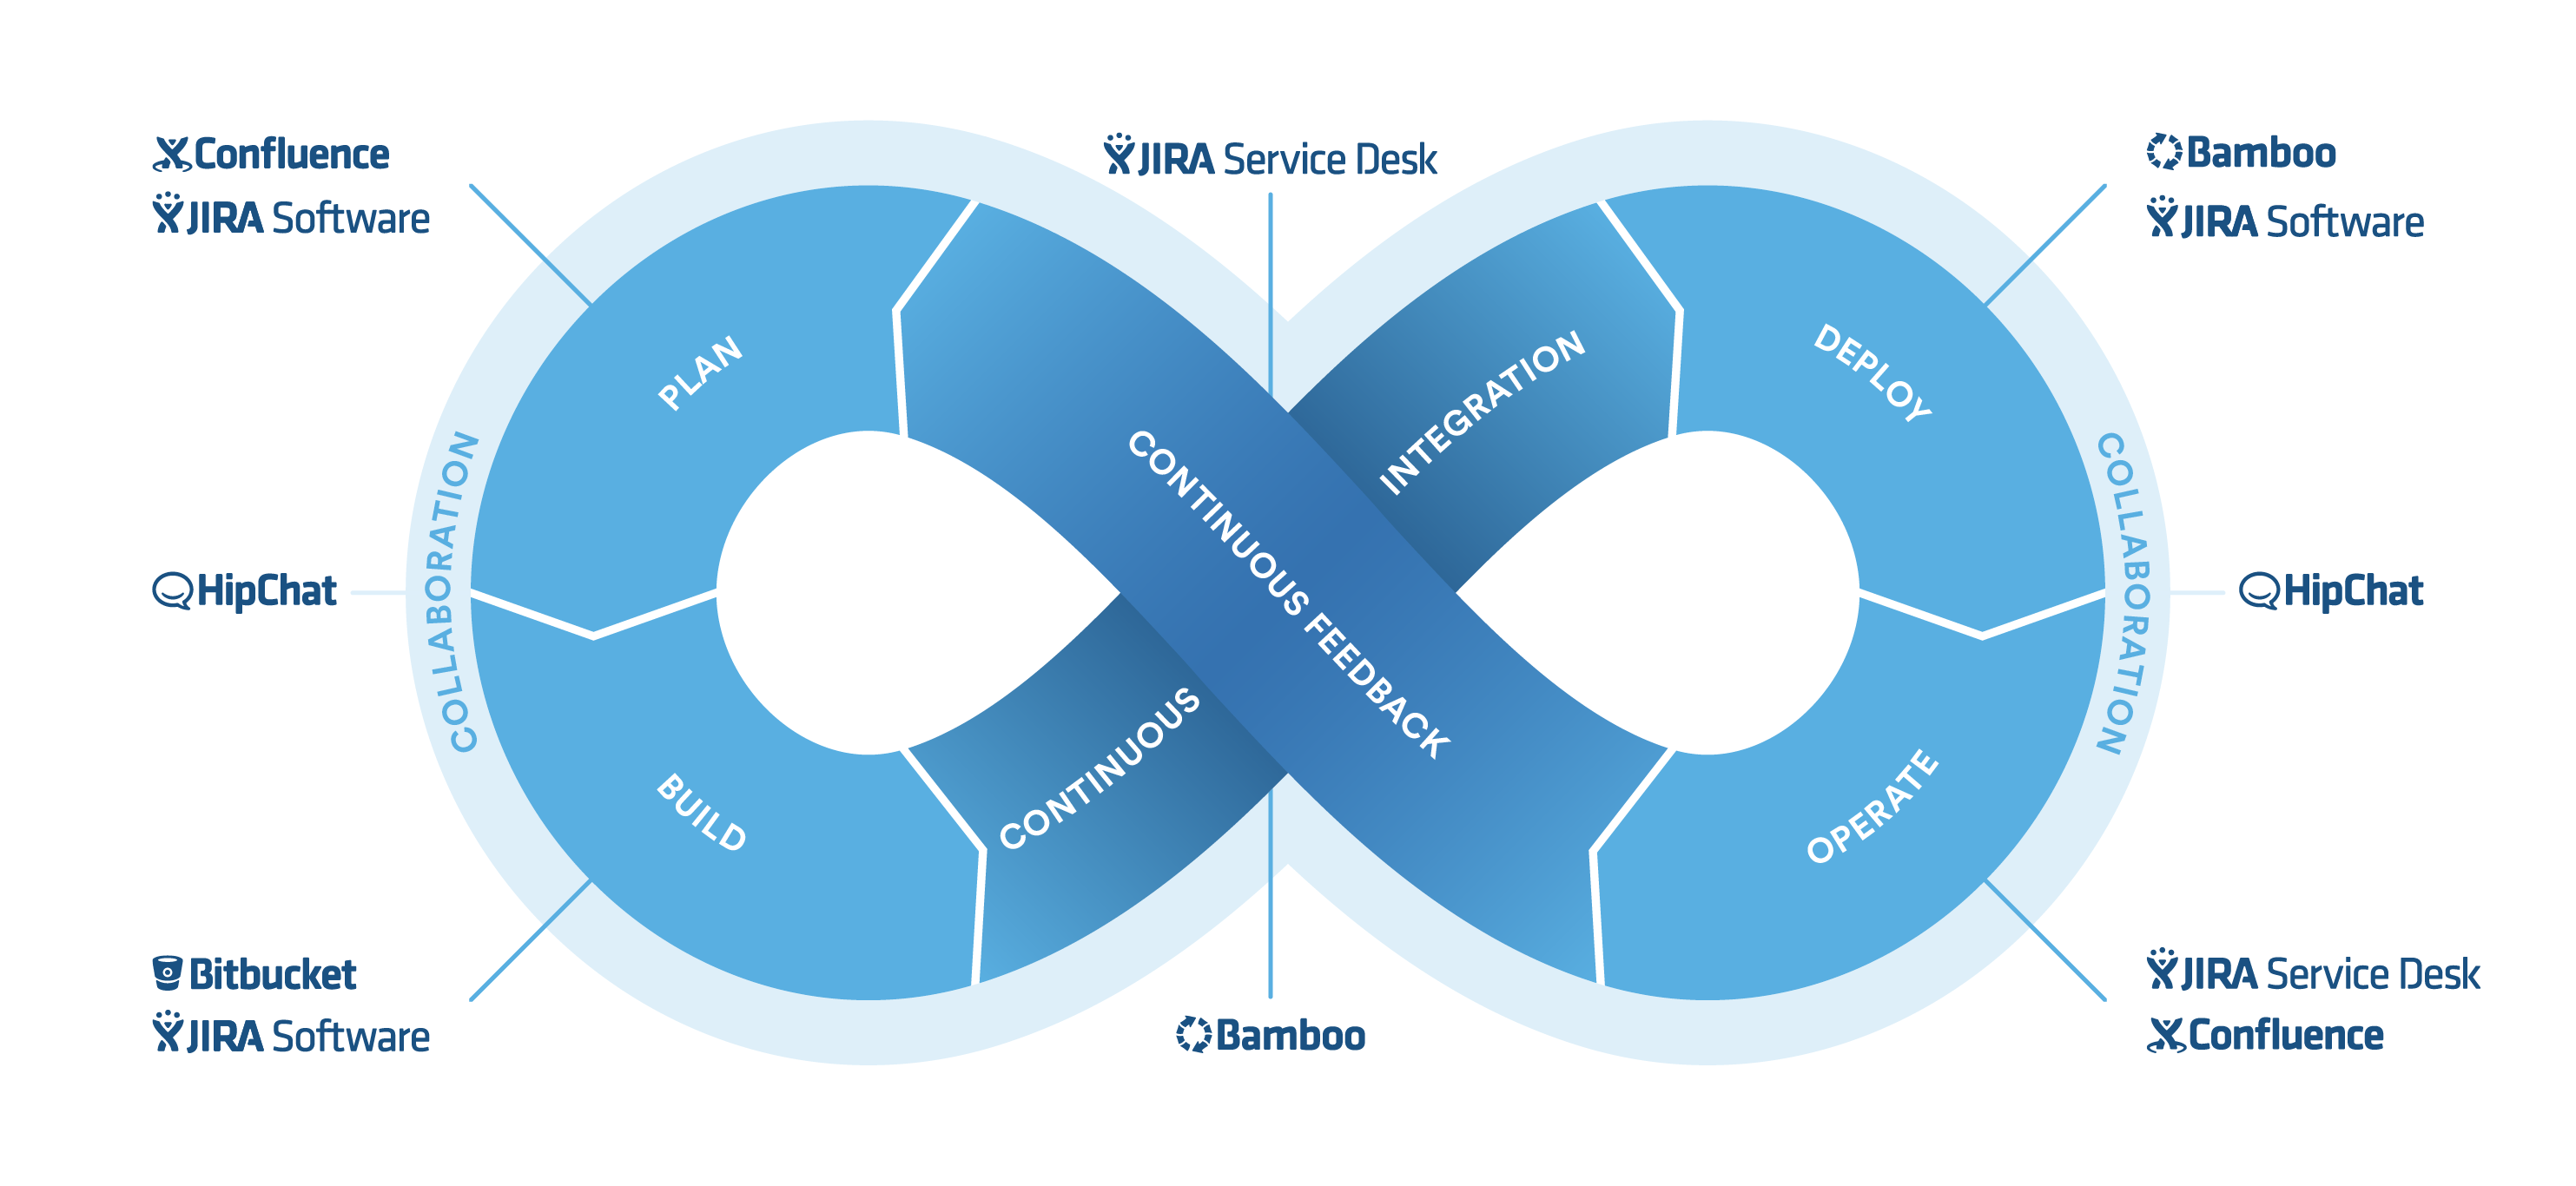
In small companies, one team may be responsible for the entire development lifecycle. In larger companies, it’s split by department. Regardless, DevOps is about breaking down silos and making this lifecycle faster, highly automated, and seamlessly collaborative – whether it’s cross-functional or within one team.
Choosing the right DevOps tools is first and foremost about taking a hard look at your current software development and IT operations process and deciding where you need to improve. I hope this list points you in the right direction. Happy shopping!
Get DevOps best practices, tips, & resources delivered directly to your inbox.